Transcription
PRILINKhttp://www.prilink.comTel: P-Trunk and Internet MonitorUser Guide
SIP-Trunk and Internet Monitor User GuideTable of ContentsGetting Started.3Hardware Setup.3Implementation using Mirror Port.3Implementation using Network Tap.4IP Address Assignment.5Software Setup.6SIP Trunk Table.7SIP Group / Route Table.9Alert Notifications.11Firmware Updates.12Exploring Network Endpoint Analytics.13Active Endpoint.13Daily View.14Monthly View.15Search Endpoint.16SIP Group / Route Analytics.17Generating Reports.19Automatic Daily Reports.21Export data to Microsoft Excel.22Troubleshooting with Deep Packet Inspection.23Rev. 782
SIP-Trunk and Internet Monitor User GuideGetting StartedThis guide documents Prilink SIP-Trunk & Internet Monitor software version 2.3.5. For furtherassistance please contact Prilink support at 905-940-8844 or support@prilink.com.Hardware SetupA Prilink IP-Meter collects and analyzes IP traffic databy monitoring 10/100/1000 Ethernet circuits through itsmonitor ports. A Mirror port or Ethernet TAP can beused to send a copy of network traffic from theDEMARC point to the IP-Meter monitor ports.MONLAN4.88” (124 mm) 0.8” (21mm) 4.7” (120mm)Implementation using Mirror PortBefore connecting power to the IP-Meter, first connect the LAN and monitor ports as follows:1. Connect the LAN port on the Meter to your network (the LAN port is labelled “LAN1”).2. Configure port mirroring on your Switch/Server/Router.3. Connect the monitor port on the Meter to the configured mirror port of yourSwitch/Server/Router (the monitor port is labelled “LAN2”).4. Finally, connect power to the Meter.Once powered on, wait approximately 2 minutes for the LED plug to begin blinking (the LED plug isthe green RJ45 plug connected to the “Console” port).Rev. 783
SIP-Trunk and Internet Monitor User GuideImplementation using Network TapStep 1.Connect Network TAP betweenDEMARC and Edge Router, withoutpower connected to the TAP.Step 2.Connect power to Network TAP.Step 3.Connect monitor ports on IP-Meter toNetwork TAP.Connect LAN port on IP-Meter to LAN.Connect power to IP-Meter.Once the IP-Meter is powered on, wait approximately 2 minutes for the LED plug to begin blinking(the LED plug is the green RJ45 plug connected to the “Console” port).Rev. 784
SIP-Trunk and Internet Monitor User GuideIP Address AssignmentTo configure the IP address settings on the IP Meter, establish a serial connection between the meterand your Windows PC as follows:1. Locate the Console Port next to the DC jack.Remove the LED plug from the console port andconnect the console port to your PC usingconsole/serial cable.Console2. Download the PuTTY terminal emulator:http://the.earth.li/ sgtatham/putty/latest/x86/putty.exe3. Run putty.exe and configure the PuTTY menu as follows:a) Under Connection type, select Serial.b) In the Serial line field, enter the COM# you are using to connect your PC to the meter.c) In the Speed field, type 2400.d) In the Category option tree on the left,choose Connection - Serial and configurethe serial line as shown on the right.e) Click Open.A blank screen should appear and the meterserial number should begin to output.4. Hit Enter to query the current IP address settings. The output will indicate whether the meter isusing DHCP or a static IP address (status ‘dhcp’ or ‘static’). E.g.,status:static a 192.168.0.30/24g 192.168.0.15. To configure DHCP:Type ‘dhcp’ and hit enter, then type ‘y’ and hit enter to confirm changes. The meter will rebootand attempt to acquire an IP address through DHCP.5. To configure Static IP:Type the following and hit enter, substituting desired values for a (address) and g (gateway):static a 192.168.0.2/24 g 192.168.0.1(Note that a is written in CIDR notation: IP address / # of bits for routing prefix . Todetermine the number of bits for routing prefix based on a given netmask, see table below.)Type ‘y’ and hit enter to confirm changes. The meter will reboot with a static IP address.Rev. 785
SIP-Trunk and Internet Monitor User GuideTable: Number of bits for routing prefix for a given netmaskNetmask kPrefixBits128.0.0.0 1255.128.0.0 9255.255.128.0 17255.255.255.128 25192.0.0.0 2255.192.0.0 10255.255.192.0 18255.255.255.192 26224.0.0.0 3255.224.0.0 11255.255.224.0 19255.255.255.224 27240.0.0.0 4255.240.0.0 12255.255.240.0 20255.255.255.240 28248.0.0.0 5255.248.0.0 13255.255.248.0 21255.255.255.248 29252.0.0.0 6255.252.0.0 14255.255.252.0 22255.255.255.252 30254.0.0.0 7255.254.0.0 15255.255.254.0 23255.255.255.254 31255.0.0.0 8255.255.0.0 16255.255.255.0 24255.255.255.255 326. Finally, disconnect the console/serial cable from the meter and replace the LED plug in theconsole port.Software SetupPrilinkNM application software can be installed on any Windows based PC or server by executing theprilinknm-2.3.5-setup.exe installer. Once installed, start the PrilinkNM application:You will be prompted for a password to begin. Enter thepassword that was supplied to you when you purchasedthe software.If you have forgotten your password or do not haveaccess to the installer, please contact Prilink support at 1866-261-0649 or support@prilink.com.Keyboard navigationThe application can be navigated almost exclusively using the keyboard.Arrow Keys orPageUp / PageDownHighlight screen items or menu options one at a time (Arrow Keys) orone page at a time (PageUp / PageDown).EnterAccess menu for selected screen item or choose menu option.EscGo back to previous screen, close menu or exit application.Rev. 786
SIP-Trunk and Internet Monitor User GuideIP-Meter Connection StatusAfter successful login, the application will automatically attempt to connect to all IP-meters. Whenconnected, the local time and run time fields will be populated and increasing.If local time / run time fields are blank, the application is unable to connect to the IP-Meter. Checkbelow the IP-Meter name to see which IP address/port the application is trying to reach the meter at(e.g. for IP-Meter 8192-2 above, it is 192.168.0.50 port 3007). If the address shown is not the sameaddress that was assigned to the meter during installation, contact Prilink support for software update.SIP Trunk TableIn order to compile SIP trunk analytics, an IP-Meter must know where to look for SIP signalling. Themain purpose of the SIP Trunk Table is to tell the IP-Meter which IP addresses and port numbers areused for SIP signalling. The table is also used to assign names to SIP trunks, and to identify which IPaddresses are Telco-side, so that the direction of SIP calls can be recorded correctly.To view or edit the SIP Trunk Table, highlight an IP-Meter on the main screen, hit Enter and choosemenu option SIP Trunk:SIP trunks can be detected automatically by the IP-Meter or defined manually.Rev. 787
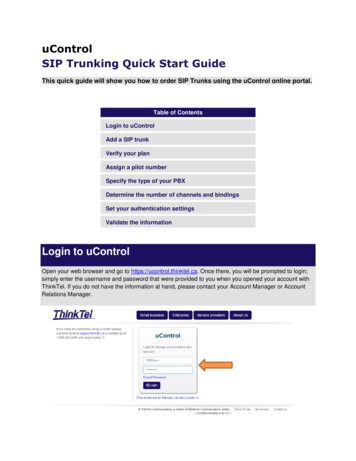
SIP-Trunk and Internet Monitor User GuideAuto-DetectWhen SIP trunk auto-detection is turned on, the IP-Meter willscan all packets for SIP signalling. When a SIP packet isdetected, the meter will check if the packet matches any current entries in the SIP Trunk Table. If thereis no match, it will create new entries based on the SIP packet, and auto-detection will be turned off.Auto-detection can be turned on again by hitting Enter and choosing menu option Detect On. Once allSIP Trunks have been detected, auto-detection should remain off to conserve IP-Meter resources.Manual EditTo edit an existing entry in the SIP Trunk Table, or to create a new entry, highlight a row, hit Enter andchoose menu option Edit:SIP Trunk: Number from 0–7 identifying this SIPtrunk (up to 8 SIP trunks can be defined). Multipleentries can be combined by using the same SIP Trunknumber (for example, if you want to group SIP trafficfrom multiple IP addresses)Name: Any meaningful name for this SIP trunk.Threshold: Number of active channels that must bereached in order to generate an alert (see Alerts).IP address: IP address used for SIP signalling.Port: TCP/UDP port number used by the above IPaddress for SIP signalling.TelcoIP: Is the above IP address on the Telco side?This is used to categorize calls as inbound vs outbound.disable: Check this field to ignore this entry.IP Trunk: See IP Trunk Table below.IP Trunk TableAn IP trunk is a pair of MAC addresses that have exchanged network traffic. The IP-Meterautomatically detects and compiles network analytics on each unique IP trunk. To view all IP trunksdetected (the IP Trunk Table), highlight an IP-Meter from the main screen, hit Enter and choose menuoption IP Trunk.Rev. 788
SIP-Trunk and Internet Monitor User GuideIP trunks are numbered starting from 0. When an IP trunk is first detected, the IP-Meter will arbitrarilylabel the MAC addresses “A” and “B”, based on the source and destination of the first packet received.For example, in IP trunk #2 above, the “A” side is 00-53-02-FB-54-0B and the “B” side is00-53-27-9F-EE-DC.When defining a SIP trunk in the SIP Trunk Table, in addition to specifying the IP address and portnumber used for SIP signalling, you must also specify the IP trunk used and the side of the IP trunk (Aor B) where the specified IP address will be found.SIP Group / Route TableOnce SIP trunks have been defined, the IP-Meter will automatically detect all internal and external SIPendpoints (phone numbers) and will compile network analytics on each individual phone number. ASIP group is a combination of phone numbers that you wish to monitor as a unit, such as a route, ACDqueue, or other important business application.The SIP Group Table allows up to 128 SIP groups to be defined. To view or edit the SIP Group Table,highlight an IP-Meter on the main screen, hit Enter and choose menu option SIP Group:Rev. 789
SIP-Trunk and Internet Monitor User GuideEach SIP Group is defined by one or more entries in the SIP Group Table. For example, Group #0above (“Front Desk”) is defined by three entries, combining three internal phone numbers.To edit an existing entry, or to create a new entry, highlight a row, hit Enter and choose menu optionEdit:Group #: Number from 0–127 identifying this SIPgroup (up to 128 groups can be defined). Multipleentries can be combined by using the same Group #.Name: Any meaningful name for this SIP group.Threshold: Number of active channels that must bereached in order to generate an alert (see Alerts).Phone Number: Phone number to match. The %character can be used as a wildcard to match any digit.If the last digit field is checked, then any phonenumber whose last digits are equal to the above numberwill be included in the group. Otherwise, an exactmatch is required to be included.External #: Is this an external phone number?SIP Group Example: Help DeskSuppose our Help Desk includes 12 internal phone 01Suppose further that for outbound calls, the phone numbers appear prefixed by 1 (eg. 1-123-456-7800).By checking last digit in each group entry, we can ensure that both outbound and inbound calls arematched. The complete group definition would require only 3 entries:Rev. 7810
SIP-Trunk and Internet Monitor User GuideAlert NotificationsIn both the SIP Trunk Table and SIP Group Table, each SIP trunk or group can be assigned a channelthreshold. If the number of active calls belonging to the trunk / group ever reaches the assignedthreshold, then an alert is generated. The SIP trunk / group definition dialog includes an emailcheckbox that should be checked if you wish to receive notifications by email for threshold alerts. Amaximum of 3 alerts per 15 minutes will be generated for each SIP trunk or group.In order for Email notification to function, the PrilinkNM application must be able to connect to anoutgoing SMTP mail server. To configure mail server settings, hit Enter from the main screen andchoose menu option Email:Use the Test button to send a test message, and consult the Log to see the response from your mailserver. Hit Save to store mail server settings permanently, or hit Close to return to previous settings.Rev. 7811
SIP-Trunk and Internet Monitor User GuideFirmware UpdatesThe firmware version running on an IP-Meter can be viewed at any time from the main screen:The version string is composed of “Server” version followed by “Site” version.v5.30.52.24 indicates Server version 5.30 and Site version 52.54.For example,Firmware updates are completed using the PrilinkNM application as follows:1. Extract firmware files into C:\ip directory.2. Highlight IP-Meter on the main screen, hit Enter and choose menu optionServer Reboot/Shutdown/Update. Then choose sub-option Firmware Update.3. Wait approximately 2 minutes while the IP-Meter reboots. Once the application reconnects tothe IP-Meter, confirm that Server version has updated (first half of version string).4. Highlight IP-Meter on the main screen, hit Enter and choose menu optionSite Reboot/Shutdown/Update. Then choose sub-option Firmware Update.5. Wait approximately 2 minutes while the IP-Meter reboots. Once the application reconnects tothe IP-Meter, confirm that Site version has updated (second half of version string).Firmware update is complete.Rev. 7812
SIP-Trunk and Internet Monitor User GuideExploring Network Endpoint AnalyticsThe IP-Meter automatically scans several types of network endpoints at the Link, Internet, Transportand Application layers, and compiles network analytics for each endpoint. There are 6 endpoint types:SIP NumberSIP Phone NumberSIP TrunkSIP Trunk as defined in the SIP Trunk TableIP – PortCombination of IP address and transport layer port numberIPIP addressEtherTypeEtherType number indicating protocol (IPv4, IPv6, ARP, etc.)IP TrunkPair of MAC Addresses that have exchanged network traffic (see IP Trunk Table)Active EndpointThe IP-Meter continuously monitors and sorts the most active endpoints of each type. To browse thetop endpoints over the last 500 days, highlight an IP-Meter from the main screen, hit Enter and choosemenu option Active Endpoint:Endpoint TypeRev. 7813
SIP-Trunk and Internet Monitor User GuideEach column lists the top 50 most active endpoints for a single day, starting from the current day, up tothe last 500 days. Use the Left / Right arrow keys to move forward / backward in time, or hit Enter andchoose menu option Select Date. Use the Up / Down arrow keys (or PageUp / PageDown) to accessthe full 50 endpoints or to move to a different endpoint type. The current day list is updated every 15minutes.Daily ViewTo drill down on a single endpoint and view detailed analytics over a 24 hour period, highlight anendpoint in the Active Endpoint screen, hit Enter and choose menu option Day:Call VolumeMax ChannelCall Detail RecordsThe format of the daily view depends on endpoint type. The example above is for SIP trunk endpoints.For all endpoint types, use the Left / Right arrow keys to highlight a different 15-minute interval of theday, hit Enter to access a menu of further options, and hit Esc to return to the Active Endpoint screen.All endpoint types have a menu option Select Date to move to a new day without returning to theActive Endpoint screen.The example below illustrates the format of the daily view for IP endpoints (IP – Port, IP, andIP Trunk). EtherType endpoints do not have a daily view.Rev. 7814
SIP-Trunk and Internet Monitor User GuideBandwidthIP SessionsPeak SpeedMonthly ViewTo view analytics for a network endpoint over a month period, highlight an endpoint in theActive Endpoint screen, hit Enter and choose menu option Month:Days of the monthRev. 7815
SIP-Trunk and Internet Monitor User GuideThe columns appearing in Monthly View depend on endpoint type. The example above is for IPendpoints. For all endpoint types, use the Up / Down arrow keys to highlight a different day of themonth, hit Enter to access a menu of further options, and hit Esc to return to the Active Endpointscreen.All endpoint types have a menu option Day to enter Daily View for the highlighted day, and a menuoption Select Month to move to any month in the last 16 months.Search EndpointSearch Endpoint allows you to quickly access analytics for an endpoint without scanning through theActive Endpoint screen. Furthermore, some endpoints may not appear in the Active Endpoint screenbecause they do not have enough traffic to fall in the top 50 on any day. Such endpoints are onlyaccessible through the Search Endpoint feature.Highlight an IP-Meter from the main screen, hit Enter and choose menu option Search Endpoint:The Endpoint Table is a place to store endpoints for quick access and to assign meaningful names. Toadd an endpoint, highlight the first empty row, hit Enter and choose a type (IP, IP – Port, IP – IP, orSIP Number). In the above example, a single SIP Number endpoint has been added called “BusinessApplication X”.To access analytics for an endpoint, highlight the endpoint in the Endpoint Table, hit Enter and choosemenu option Traffic.Add to Endpoint Table from Active Endpoint ScreenIn addition to manually editing the Endpoint table, you can add endpoints directly from theActive Endpoint screen:Rev. 7816
SIP-Trunk and Internet Monitor User Guide1. Highlight an endpoint, hit Enter and choosemenu option Add to Endpoint Table.2. Enter a meaningful name for the endpoint.3. Endpoint name is updated in theActive Endpoint screen, and any other screenwhere the endpoint is referenced.SIP Group / Route AnalyticsThe IP-Meter will automatically compile analytics for each SIP Number endpoint. In addition, the usercan define SIP groups to track combinations of phone numbers, such as a routes, ACD queues, or otherimportant business applications (see SIP Group Table for details).To view analytics for a SIP Group, highlight then IP-Meter on the main screen, hit Enter and choosemenu option SIP Group. Then highlight the SIP group you wish to analyze, hit Enter and choose menuoption Analytics. The Monthly View and Daily View for SIP Groups share the same format as SIPtrunks.Rev. 7817
SIP-Trunk and Internet Monitor User GuideSIP Group / Route Daily SummaryThe Daily View for SIP groups has one additional feature that allows you to view multiple days ormultiple groups simultaneously.While in Daily View, hit Enter and choose menu option Summary. This will pop out a new windowwhich will remain visible if you exit Daily View to select another group or another day.Multiple SIP group summary windows can be open and arranged on your screen, effectively creating acustom dashboard. Summaries that show the current date will update every 15 minutes. To close asummary, select the window and hit Esc key.Rev. 7818
SIP-Trunk and Internet Monitor User GuideGenerating ReportsAll data for each site can be exported in CSV format, and summary reports can be generated in PDFformat. Highlight an IP-Meter from the main screen, hit Enter and choose menu option Report:Select which date to export.A 1 appears beside each date that has data available.A 0 indicates that no data is available for that date.Browse for a folder to save report files.Once you hit OK and the report process completes,Windows explorer will open to display the files in thefolder that you selected.Up to 7 report files created. Each file name is prefixed by date and IP-Meter number. The format ofthe date prefix is YYMMDD.e.g. “170225-8190-3 sip-report.pdf” for February 25th 2017, IP-Meter number 8190-3.The files created are summarized below:sip-cdr.csvCall Detail Records for each sip call, including MOS information.sip-trunk-records.csv15-minute traffic statistics for each SIP trunk.sip-group-records.csv15-minute traffic statistics for each SIP group / route.ip-cdr.csvConnection Detail Records for each IP session.ip-trunk-records.csv15-minute traffic statistics for each IP Trunk.sip-report.pdfSIP summary PDF report.ip-report.pdfIP summary PDF report.Rev. 7819
SIP-Trunk and Internet Monitor User GuideThe SIP summary PDF report includes inbound / outbound summary, SIP trunk traffic summary andSIP group traffic summary.Below is a sample page showing 15-minute call volume and call blockage summary for SIP trunk #0:The IP summary PDF report tabulates the top 30 IP endpoints (IP – Port, IP, & IP trunk), and includescharts for the top 2 endpoints in each category.Below is a sample page showing 15-min bandwidth and speed for the top 2 IP address endpoints:Rev. 7820
SIP-Trunk and Internet Monitor User GuideAutomatic Daily ReportsIf the PrilinkNM application is running and connected to an IP-Meter, it will automatically generate all7 report files at the end of each day, as well as every 15 minutes for the current day. The files aredeposited in the IP-Meter site directory.Site DirectoryData for each IP-Meter is stored locally on your PC / Server in the directory C:\ip\xxxx\00y, wherexxxx-y is the IP-Meter site number. E.g., the site directory for IP-Meter 8191-1 is C:\ip\8191\001.A complete backup of site data can be achieved simply by backup up this directory.Within the site directory, daily report files are deposited in the csv and report sub-directories as shownbelow:Rev. 7821
SIP-Trunk and Internet Monitor User GuideExport data to Microsoft ExcelMany screens in the PrilinkNM application include the menu option Export. This option exports screendata into a CSV file, which is then normally opened using the default application for CSV files on yoursystem.However, before opening the CSV file, the application first searches for an MS Excel template underC:\ip\export.xltm, and attempts to run this template if it exists. If you wish to make use of thistemplate, simply download export.xltm from http://prilink.com/downloads/ and save the file underyour C:\ip directory. The use of macros must be permitted for the template to function.Below is an example from created from SIP trunk Daily View by choosing menu option Export CDR.Rev. 7822
SIP-Trunk and Internet Monitor User GuideTroubleshooting with Deep Packet InspectionAnalyzing raw network packets is sometimes necessary to troubleshoot problems and gain insight intoapplication operation. All of the network endpoints that are automatically scanned by Prilink can beused as filters for packet capture, alleviating the need to use complex filter syntax. Capture files aresaved to the user's PC in Wireshark-compatible format for further investigation.There are three ways to initiate packet capture for a particular network endpoint: Highlight an endpoint in the Active Endpoint screen, hit Enter and choose menu optionCapture Packet. Highlight an endpoint in the Endpoint Table, hit Enter and choose menu option Capture Packet. Highlight a SIP trunk in the SIP Trunk Table, hit Enter and choose menu optionCapture SIP trunk message or Capture SIP number message. The latter option filters SIPtraffic by a specific phone number, useful for testing purposes. Both option capture both SIPsignalling and RTP streams for further analysis.A Packet Capture window will open.The Filter field indicates the networkendpoint used to filter packets.The Duration and File size fields areincremented as the capture progresses andmore packets are added to the capturefile.Capture will continue until amaximum file size is reached or until theuser clicks the Stop Capture button.Once complete, the Status field will reach “end” and the File name field will update to indicate the fullpath where the capture file is stored. Two files are created in the process:{site number} {YYMMDD} {HHMMSS}.pcapRaw capture file.{site number} {YYMMDD} {HHMMSS}.txtText file containing all metadata from the PacketCapture window (filter, start time, duration, etc).It is possible to initiate packet capture on multiple sites simultaneously; a separate Packet CaptureRev. 7823
SIP-Trunk and Internet Monitor User Guidewindow will open for each site.Open Capture File in WiresharkOnce a packet capture is completed, the stop capture button will be renamed to Open File. Clickingthe Open File button will attempt to use the default application for opening .pcap files on yoursystem. If you have installed the Wireshark application, the installation process will normally associate.pcap files with Wireshark, so that clicking Open File will trigger Wireshark.Rev. 7824
To edit an existing entry in the SIP Trunk Table, or to create a new entry, highlight a row, hit Enter and choose menu option Edit: SIP Trunk: Number from 0-7 identifying this SIP trunk (up to 8 SIP trunks can be defined). Multiple entries can be combined by using the same SIP Trunk number (for example, if you want to group SIP traffic