Transcription
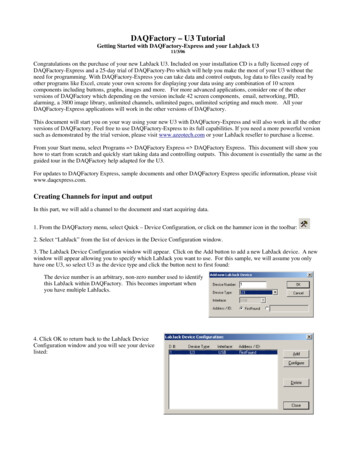
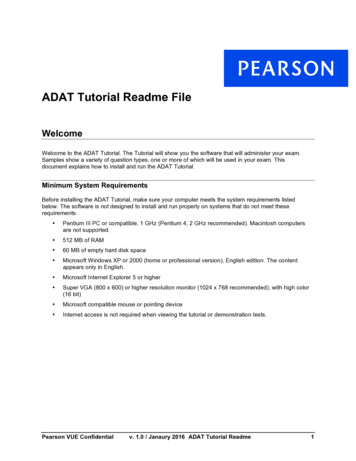
DAQFactory Express – U12 TutorialA step-by-step guide for using your new LabJack with DAQFactory-ExpressCongratulations on the purchase of your new LabJack U12. Included on yourinstallation CD is a fully licensed copy of DAQFactory-Express and a 25-daytrial version of DAQFactory-Pro data acquisition software which will help youmake the most of your LabJack without the need for any programming. Youcan take data and control outputs, log data to files easily read by otherprograms like Excel, create your own screens for displaying your data usingany combination of 40 different screen components including knobs, switches,graphs, images, gauges and more. And if you prefer the flexibility ofprogramming, DAQFactory includes a scripting language for performing justabout any data acquisition task, while still taking advantage of all the rest ofDAQFactory’s features.This detailed guide will walk you through taking data from your LabJack,displaying the data on the screen in various ways, graphing it, controllingoutputs, and logging your data to a file with DAQFactory.Starting DAQFactory Express:Click on the Start button, select Programs, DAQFactory Express thenDAQFactory Express.A splash screen will display and then you will be left with a blank DAQFactorydocument. For this tour, we will mostly be using the workspace, which is the areaalong the left of the screen with an Explorer like tree, and pages, which is currentlythe blank area that occupies most of the screen.Creating Channels:First we will add a channel in DAQFactory and start acquiring data.1.In the workspace (the tree area along the left of the screen), click onCHANNELS:.The workspace provides anorganized presentation of thedifferent configuration screens forsetting up your DAQFactorydocument. Clicking on almostevery item in the tree will bring upa new view related to the itemselected. Clicking on CHANNELS:displays the channel table whereyou can manipulate all the channelsin your document.2.In the Channel Table View that appears, click on the Add button at thetop.This creates a new row where we will enter the information for our first channel.3.In the new row of the table, enter Pressure in the Channel Namecolumn.All channels must have a name. You can assign any name you want to your channelsas long as they are unique, start with a letter and only contain letters, numbers or theunderscore " ". Like just about everything else in DAQFactory, Channel names arecase sensitive.4.In the second column, Device Type, select LabJack U12 from the dropdown list.The device type determines which type of device you wish to communicate with. Thiscan be a specific manufacturer, a specific device, or a generic communications methodsuch as OPC or serial.Copyright 2004, AzeoTech Inc.1
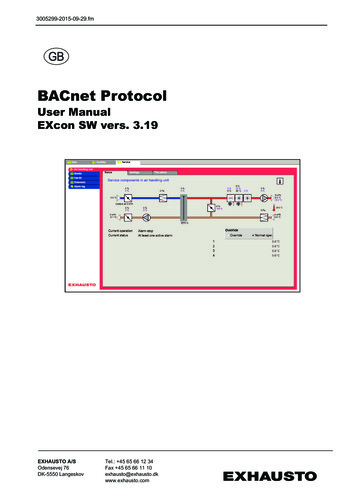
5.In the third column, D #, leave the cell set at 0.The device # is only used by some devices and has different meanings depending onthe device. For the LabJack U12, the device # is either the ID # burned into theLabJack, or 0 which uses the first LabJack found.6.In the fourth column, I/O Type, select A to D (SE 0-7; Diff 8-11).Most devices have several different types of data coming in or going out. The I/O typedetermines which type of data you desire. The LabJack U12 contains A to D, D to A,Digital inputs and outputs and counter channels. The I/O Type determines which ofthese you wish to communicate with for this channel. I/O Types are not fixed typesand different devices will have different choices available.7.In the fifth column, Chn #, enter 0.Most devices have several I/O points per I/O type. The channel number determineswhich I/O point this channel refers to. For the A to D channels of the LabJack, 0through 7 are the single ended inputs, and 8 through 11 reference the differentialinputs.8.Leave the rest of the columns in their default setting.One important item to mention is thesixth column, Timing. For inputchannels this determines how often theinput is read from the device. Theinterval provided here is in seconds. Fornow, we are going to leave it set at 1, orone new reading per second. Becausethe LabJack is a slower device, youshould never set the Timing to a valueless than 0.02, and you may not evenbe able to go that small. For high speedacquisition, use the streaming mode asdescribed in the DAQFactory help.9.Click on the Apply button at the top of the screen.The changes you make are not implemented by DAQFactory until you click Apply. Ifyou do not want to keep your changes, you can click Discard. Once you click Apply,DAQFactory will start taking data from your LabJack device, D#0, I/O Type A to D,Channel #0, and place that data in the "Pressure" channel. This assumes of coursethat you have the LabJack plugged in. If it is working, the LED on the LabJack willblink once a second.10. Click on the sign next to CHANNELS in the workspace.The sign appeared when you hit Apply. Clicking on it displays the channels you'vecreated as separate items in the workspace.11. Click on Pressure listed under CHANNELS in the workspace.This will display the channel view for the channel pressure. The channel view displaysthe configuration information for a single channel. In general, it is quicker to createyour channels in the channel table, but thechannel view provides space for someextra details.12. In the Channel View that appears,click on the Graph tab.The channel view also provides a quickgraph and table to view your incomingdata. This can be used to confirm thatdata is being acquired and that you arereading the correct data. What you willsee in the graph will depend on what you have wired into AI0 of your LabJack. Evenwithout anything wired, you should see a horizontal line at around 1.4 to 1.7 volts.You have just confirmed that you are acquiring data on your pressure channel.Copyright 2004, AzeoTech Inc.2
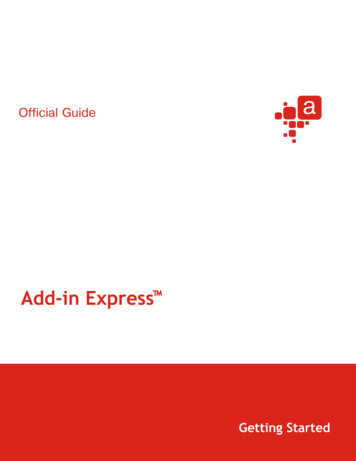
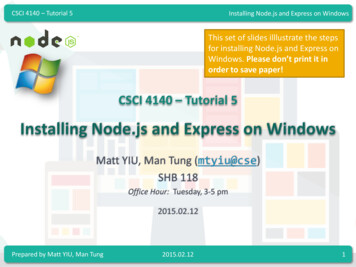
13. If you'd like to see the table, click on the Table tab.You are now taking data. In the next section we'll display it on our owncustom screens.Conversions:Conversions provide a way to quickly convert your voltage values read fromthe U12 into more useful units, such as Celsius, psi, etc. Another convenientuse for a conversion is to quickly convert uncalibrated readings into moreuseful calibrated quantities through a derived equation. For example, you mayhave calculated a slope and offset to apply to each voltage data point to adjustthe calibration. A Conversion can be used to quickly do this for each data point.1. To create a Conversion click on CONVERSION: in the Workspace. This willbring up the Conversion table. Click on the Add button to add your firstconversion equation. Give your conversion a name in the Conversion Namefield and then type a formula for the conversion in the Formula field. Thegraphic shows an example of a conversion table with several thermocoupleconversions.2. An example of a simple conversionwould be to offset each data pointby 100. The formula for this wouldbe written as: Value 100. WhereValue is used wherever you want tosubstitute the raw channel value inthe formula.3. After you have completed yourconversion select the Apply button.4.Next, go to the channel table byclicking on CHANNELS: in theWorkspace. The eighth column fromthe left is labeled Conversion. Clickin the appropriate row for thechannel you wish to apply theconversion to and a drop downmenu will appear. Select yourconversion from the drop downmenu and select the Apply button.Now each raw channel value will beautomatically converted into a moreuseful format for your application.Displaying the Data:The channel view certainly provides a quick look at your data, but is not themost convenient or flexible way to display your data, especially once you havemore than one channel. In this section we'll add some different components toa page that will display data from the pressure channel.1.Click on Page 0 in the workspace under PAGES.This will display a blank white page. When DAQFactory-Express starts, 2 blank pagesare generated automatically with default names. With DAQFactory-Express you arelimited to these 2 pages. With other versions of DAQFactory as seen under the trialversion you can create as many pages as you want.Copyright 2004, AzeoTech Inc.3
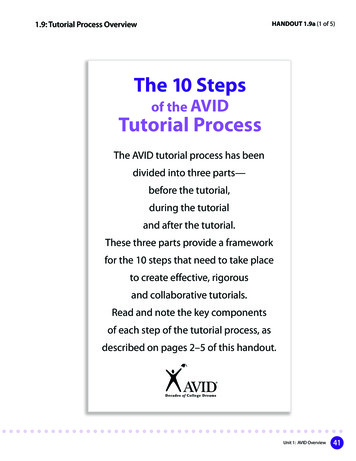
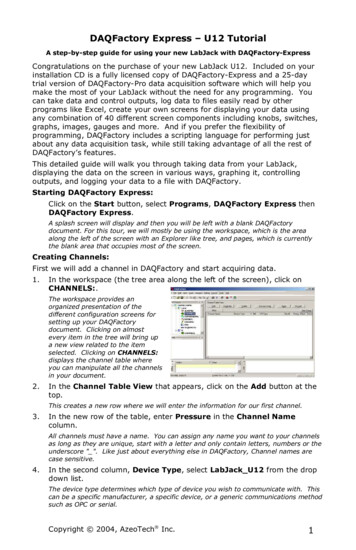
2.Right-click somewhere in the middle ofthe blank area and select DisplaysVariable Value.This will place a new page component on thescreen. There are many differentcomponents available that allow you tocreate custom screens. This particularcomponent simply displays a changing valuein text form.3.Right click on the new component and select Properties.All of the screen components have different properties windows for configuring thelook of the component and telling the component what data to display.4.Next to Caption:, enter Pressure.The caption is what is displayed in front ofyour value. A colon is automatically addedwhen displayed.5.Next to Expression:, enter Pressure[0].Expressions are actually formulas that youcan enter to display calculated data. In thiscase, the formula simply requests the mostrecent data point of the channel pressure.The [0] indicates the most recent data point.6.Click on OK.Now the screen should display Pressure: 1.412 V. The value will depend on whatyou have wired into AI0. This is the current value in the pressure channel we createdearlier. Feel free to open the properties window again and play with the units, fontand other settings.7.While holding the Control key, click onyour Variable Value component.This will select the component, as indicated bythe shaded rectangle surrounding it.8.While holding the Control key, click anddrag the Variable Value component to anew location on the screen.This allows you to move the component aroundthe screen.You now know how to display your data using the Variable Value component.Next we will learn how to use the graph to display historical data.In the mean time, feel free to play with other similar components if you'd like.When done, you can delete them by selecting the component (Control - Click)and then right clicking and selecting Delete Component.Graphing / Trending the data:Displaying scalar values in text or gauge form is certainly useful, but nothing isbetter than a graph to give you a handle on what is happening with yoursystem. DAQFactory offers many advanced graphing capabilities to help youbetter understand your system. In this section we will make a simple Y vstime or trend graph. The screen shots show a sine wave which is generated bythe Test device. Your screens will look different depending on what you havewired into AI0.Copyright 2004, AzeoTech Inc.4
1.If you are still displaying the page with the gauge on it, hit the 1 key toswitch to Page 1. If you are in a different view, click on Page 1 in theworkspace.The workspace is only one way to switch among pages. Another is using speed keyswhich can be assigned to a page. By default, the initial 2 pages are assigned the keys0 and 1.2.Right click somewhere on the blank page and select Graphs - 2D Graph.Move and resize the graph so it takes up most of the screen (see Displaythe Data if you forgot how to dothis). Next, open the propertieswindow for the graph.3. Next to Y Expression: typePressure.The Y expression is an expression just likethe others we have seen so far. Thedifference is that a graph expects a list (orarray) of values to plot, where in theprevious components we have only wantedthe most recent value. By simply namingthe channel in the Y expression and notputting a [0] after it, we are telling thegraph we want the entire history of values stored in memory for the channel. Thehistory length, which determines how many values are kept in memory and thereforehow far back in time we can plot is one of the parameters of each channel that we leftin its default setting of 3600.4.Leave all the rest in their default settings and click OK.Depending on what signal you have wired intoAI0, you may see a trace displayed in thegraph. To display the entire trace, we need tochange the Y axis scaling.5.Double click on the left axis of the graph.Unlike other components, you can double clickon different areas of the graph to open theproperties window for the graph to differentpages. Double clicking on the left axis bringsup the axis page with the left axis selected.6.Next to Scale From enter -5, next to Scale To enter 5, then click OK.This will scale the graph from -5 to 5. Depending on what you have connected to AI0,you may want to select a different range.7.Now we'll try another method to scale the graph. Open the graphproperties box again and go to the Traces page. Change the Y Expressionto Pressure * 10 and hit OK.Like the other screen components, theexpressions in graphs can be calculations aswell as simple channels. In this case, we aremultiplying each of the values of Pressure'shistory by 10 and plotting them. This shouldtake our Pressure value out of the current graphrange.8.Deselect the graph by clicking on the page outside of the graph. Theshaded rectangle should disappear. Next, right click on the graph andselect AutoScale - Y AxisThe graph component has two different right click popup menus. When selected, itdisplays the same popup menu as the rest of the components. When it is unselected,it displays a completely different popup for manipulating the special features of thegraph.Copyright 2004, AzeoTech Inc.5
After autoscaling, you should see the graphproperly scaled to view the entire range ofAI0. Notice the rectangle around the graph.The left and right sides are green, while thetop and bottom are purple. The purple linesindicate that the Y axis of the graph is"frozen". A frozen axis ignores the scalingparameters set in the properties window (likewe did in step 6 above) and uses the scalingfrom an autoscale, pan, or zoom.9.To "thaw" the frozen axis, right click on the graph and selectFreeze/Thaw - Thaw Y AxisOnce thawed, the graph will revert to the -5 to 5 scaling indicated in the propertiesbox and the box surrounding the graph will be drawn entirely in green.10. Double click on the bottom axis to open the properties to the axis pagewith the bottom axis selected. Next to Time Width:, enter 120 and hitOK.If the double click method does not work, youcan always open the properties window for thegraph using normal methods, select the Axespage and click on Bottom Axis.In a vs. time graph, the bottom axis does nothave a fixed scale. It changes as new datacomes in so that the new data always appearsat the very right of the graph. The time widthparameter determines how far back in timefrom the most recent data point is displayed. By changing it from the default 60 to120 we have told the graph to plot the last 2 minutes of data.Once again, if you zoom, autoscale, or pan the graph along the x axis, it will freezethe x axis and the graph will no longer update with newly acquired values. You mustthen thaw the axis to have the graph display a marching trace as normal.Controlling an outputIn addition to taking data, most systems also control outputs. DAQFactoryoffers many advanced automated control features such as PID loop control andsequences, but for now we will just create an output channel and control itmanually from a page component.1.Click on CHANNELS: in the workspace to go to the channel table.2.Click on Add to create a new row in thetable.3.In the new row, name the channelOut,with a Device Type ofLabJack U12, Device # of 0, an I/Otype of Dig Out (IO 0-3; D 4-19) and aChannel # of 0. Leave the rest in theirdefaults.4.Click on Apply to save your changes.The output channel has been created, but it hasn't been set to anything.5.Click on one of your pages such as Page 1.6.Right-click and select Displays-Variable Value to create another variablevalue component.7.Right click on the new component and select Properties. to open theproperties window.8.For the expression, enter Out[0].Copyright 2004, AzeoTech Inc.6
Feel free to set the caption as well. Like before,this will simply display the most recent value ofthe out channel.9.Click on Action tab.This tab exists on several different componentsincluding the static ones and works the same waywith all of them.10. From the Action drop down, select Set To.There are many different options for the Actiondescribed later in the manual. The Set To action will prompt the user for a new valuewhen the component is clicked.11. Next go to Action Channel: type Out.12. Leave the Range blank and click OK.The range allows you to constrain the inputs to particular values. By leaving theseproperties blank, we are indicating that we do not want a range limitation. The pagewill now display your caption and 0 with a big red X through it. This indicates that outdoes not have a valid value yet. This is because we haven't set it to anything.13. Click on the component. A new window will appear requesting a newvalue. Enter any number and hit OK.Out will now be set to the value you entered. The component will now display yournew value without the big red X.You now know how to set an output to value using several different screencomponents. Next we will log the incoming data to disk.Logging DataSo far we have seen how to take data and display it on the screen. Next wewill learn how to store this data to disk so that it can be opened with anotherprogram for analysis. In this example we willcreate a simple comma delimited file with ourpressure data.1.Click on LOGGING: in the workspace.This will display the logging set summary view.Here you can see all your logging sets displayedand their running status. A logging set is agroup of data values being logged in a particularway to a particular file. You can have as manylogging sets as you need, and they can runconcurrently.2.Click on the Add button in the logging set and when prompted for the newname, type in Log and click OK.Like channels and all other DAQFactory names, the logging set name must start with aletter and only contain letters, numbers or the underscore. Once you click OK, thelogging set view will be displayed for the new logging set. You can also get to thisview by clicking on the logging set name listed under LOGGING: in the workspace.You may have to click on the sign next to LOGGING to see your logging sets listedin the workspace.3.Next to logging method, select ASCII DelimitedASCII Delimited is probably the most common method for data logging as it can beread by most other programs such as Excel. Unfortunately, it is not as space efficientor fast as the binary methods. But unless you have strict space constraints or you arelogging more than about 10,000 points per second (depending also on yourcomputer / hard drive speed), we suggest ASCII.4.Next to File Name enter c:\mylogfile.csvCopyright 2004, AzeoTech Inc.7
It is usually best to fully specify the path to your file, otherwise the data will be storedin your DAQFactory directory. The .csv is a windows standard designation for commadelimited values.5.In the Channels Available table, clickon the row with Pressure, then click onthe button to move it to the channelsto log table.Each logging set can log any combination ofchannels. In this case, we will just log the inputchannel.6.Click on Apply to save the changes.7.To start logging, click on the next toLOGGING to display the new logging set, then right click on the loggingset Log and select Begin Logging Set.Once started, the icon next to Log will change and the red stop sign will be removedto indicate that this logging set is running.8.Wait at least 10 or 15 seconds to log some data and then right click on thelogging set again and select End Logging Set to stop logging.There are other ways to start and stop logging sets, including the action page of somecomponents such as the variable value component that we used earlier.9.Now start Excel or Notepad and open the file c:\mylogfile.csv. The file isstill open for logging in DAQFactory, so you may have to quit DAQFactoryfirst.You will see two columns, time and data. By default the time is given in Excel /Access format which is decimal days since 1900. You can also have DAQFactory log inits standard format of seconds since 1970. If you are using Excel and logging the timein Excel format, you can format the first column as date / time and the numbersdisplayed will be properly displayed as date and time.Hint: if you cannot find the mylogfile.csv file, check to make sure that you selectedPressure to log and not Out. Since Out is an output channel, it only gets new valuesto log when you actually set it to something.You have now acquired, displayed and logged your data.Included in the installation are four files that were created to work with yourLabJack U12 and DAQFactory-Express. To view these files, open DAQFactoryExpress and select File Open from the main menu. Look underC:\DAQFactoryExpress\Samples\LabJackU12\. In particular the fileStreamingAnalog.ctl will get you started with streaming data from your U12For simpler applications, it is simply a matter of repeating most of these stepsfor additional channels. But even for simpler applications there are manytweaks available for fine tuning your application to work the way you want.These, along with many more examples are provided in the appropriatesections of the DAQFactory help file. At this point, we suggest playing withDAQFactory a bit, jumping to the appropriate sections of the help file for moredetail on the areas of DAQFactory you may be interested in utilizing. Also inthe help is more detail on using other features of the LabJack withinDAQFactory.Copyright 2004, AzeoTech Inc.8
included in the installation are four files that were created to work with yourlabjack u12 and daqfactory-express. to view these files, open daqfactory-express and select file open from the main menu. look underc:\daqfactoryexpress\samples\labjacku12\. in particular the filestreaminganalog.ctl will get you started with streaming data from your