Transcription
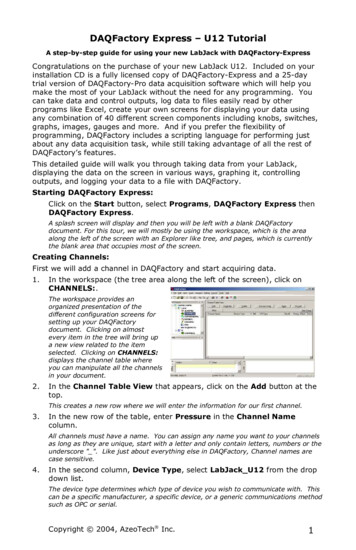
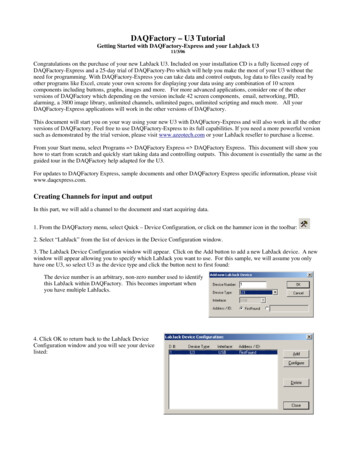
DAQFactory – U3 TutorialGetting Started with DAQFactory-Express and your LabJack U311/3/06Congratulations on the purchase of your new LabJack U3. Included on your installation CD is a fully licensed copy ofDAQFactory-Express and a 25-day trial of DAQFactory-Pro which will help you make the most of your U3 without theneed for programming. With DAQFactory-Express you can take data and control outputs, log data to files easily read byother programs like Excel, create your own screens for displaying your data using any combination of 10 screencomponents including buttons, graphs, images and more. For more advanced applications, consider one of the otherversions of DAQFactory which depending on the version include 42 screen components, email, networking, PID,alarming, a 3800 image library, unlimited channels, unlimited pages, unlimited scripting and much more. All yourDAQFactory-Express applications will work in the other versions of DAQFactory.This document will start you on your way using your new U3 with DAQFactory-Express and will also work in all the otherversions of DAQFactory. Feel free to use DAQFactory-Express to its full capabilities. If you need a more powerful versionsuch as demonstrated by the trial version, please visit www.azeotech.com or your LabJack reseller to purchase a license.From your Start menu, select Programs DAQFactory Express DAQFactory Express. This document will show youhow to start from scratch and quickly start taking data and controlling outputs. This document is essentially the same as theguided tour in the DAQFactory help adapted for the U3.For updates to DAQFactory Express, sample documents and other DAQFactory Express specific information, please visitwww.daqexpress.com.Creating Channels for input and outputIn this part, we will add a channel to the document and start acquiring data.1. From the DAQFactory menu, select Quick – Device Configuration, or click on the hammer icon in the toolbar:2. Select “LabJack” from the list of devices in the Device Configuration window.3. The LabJack Device Configuration window will appear. Click on the Add button to add a new LabJack device. A newwindow will appear allowing you to specify which LabJack you want to use. For this sample, we will assume you onlyhave one U3, so select U3 as the device type and click the button next to first found:The device number is an arbitrary, non-zero number used to identifythis LabJack within DAQFactory. This becomes important whenyou have multiple LabJacks.4. Click OK to return back to the LabJack DeviceConfiguration window and you will see your devicelisted:
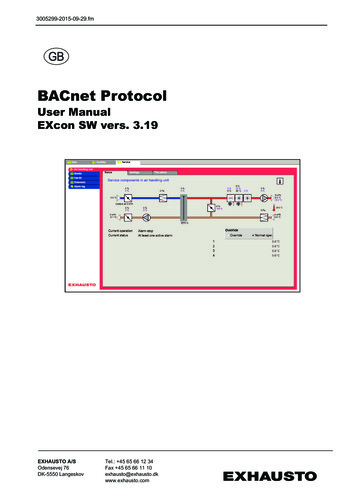
Click on your device to highlight it, then click on theConfigure button. This will open up the U3configuration window.From here you can specify all the settings of the U3.In order to read analog inputs, change the Flexible I/Otype of the first two pins to Analog Input as shownabove. There are a number of other settings here youcan play with as you get more familiar with the U3and DAQFactory. When done, click OK and thenClose to close down all the windows and return to themain DAQFactory window.5. In the workspace (the tree area along the leftof the screen), click on CHANNELS:.The workspace provides an organizedpresentation of the different configurationscreens for setting up your DAQFactorydocument. Clicking on almost every itemin the tree will bring up a new view relatedto the item selected. Clicking onCHANNELS: displays the channel tablewhere you can manipulate all the channelsin your document.6. In the Channel Table View that appears, click on the Add button at the top.This creates a new row where we will enter the information for our first channel.7. In the new row of the table, enter Pressure in the Channel Name column.All channels must have a name. You can assign any name you want to your channels as long as they are unique, startwith a letter and only contain letters, numbers or the underscore " ".8. In the second column, Device Type, select LabJack from the drop down list.The device type determines which type of device you wish to communicate with. In Express, only LabJack andLabJack U12 are available. In the other versions of DAQFactory you can communicate with a wide variety ofdevices from other manufacturers. The LabJack U12 device type applies to the U12 only. The LabJack device appliesto all other LabJack devices (including the U3 and UE9)9. In the third column, D #, set the cell to 1.For the LabJack driver, the device # is that unique number you assigned the device in step 3 above. We left it at thedefault of 1.
10. In the fourth column, I/O Type, select A to D.The I/O type determines which type of data you desire. The U3 has A to D (analog input), D to A, Digital In and Out,Counter and Timer. These are all the fundamental data types of this device. I/O Types are not fixed types anddifferent devices will have different choices available.11. In the fifth column, Chn #, enter 0.The channel number determines which I/Opoint this channel refers to with your device.For the U3, this is the IO pin #. FIO pins arenumbered 0 to 7 (AIN0-AIN7), EIO from 8 to15 (AIN8-AIN15), and CIO from 16-19(digital only for CIO). For DAC, counter andtimers, this can be 0 or 1.FIO0 (AIN0)0EIO0 (AIN8)8CIO016FIO1 (AIN1)1EIO1 (AIN9)9CIO117FIO2 (AIN2)2EIO2 (AIN10)10CIO218FIO3 (AIN3)3EIO3 (AIN11)11CIO319FIO4 (AIN4)4EIO4 (AIN12)12FIO5 (AIN5)5EIO5 (AIN13)13FIO6 (AIN6)6EIO6 (AIN14)14FIO7 (AIN7)7EIO7 (AIN15)1512. Leave the rest of the columns in their default setting.One important item to mention is the sixth column, Timing. For input channels this determines how often the input isread from the device. The interval provided here is in seconds. For now, we are going to leave it set at 1, or one newreading per second. In general you will never want to make this number smaller than 0.01 as Windows needs a littletime to redraw the screen and move the mouse. To acquire data at faster speeds requires hardware paced acquisitionwhich is currently not supported by the U3.Also, with the U3, to read a differential channel, put the negative channel number in the Quick Note / Special / OPCcolumn. For the special 0-3.6 volt range, put channel number 32 in the Quick Note / Special / OPC column.13. Click on the Apply button at the top of the screen.The changes you make are not implemented by DAQFactory until you click Apply. If you do not want to keep yourchanges, you can click Discard. Once you click Apply, DAQFactory will start taking data from the test device, D#0,I/O Type A to D, Channel #0, and place that data in the "Pressure" channel.14. Click on the sign next to CHANNELS in the workspace.The sign appeared when you hit Apply. Clicking on it displays the channels you've created as separate items in theworkspace.15. Click on Pressure listed under CHANNELS in the workspace.This will display the channel view for the channel Pressure. The channel view displays the configuration informationfor a single channel. In general, it is quicker to create your channels in the channel table, but the channel viewprovides space for some extra details.16. In the Channel View that appears, click on the Table tab.The channel view also provides a quick table to view your incoming data. This can be used to confirm that data isbeing acquired and that you are reading the correct data. You should see numbers appearing in the table thatcorrespond to the voltage on FIO0/AIN0. You have just confirmed that you are acquiring data on your pressurechannel.Displaying the DataThe Channel View certainly provides a quick look at your data, but is not the most convenient or flexible way to displayyour data, especially once you have more than one channel. In this section we'll add a component to a page that willdisplay data from the Pressure channel.
1. Click on Page 0 in the workspace under PAGES.This will display a blank white page. When DAQFactory Express starts, 2 blank pages are generated automaticallywith default names. With Express you are limited to 2 pages, but with all the other versions of DAQFactory you cancreate as many pages as you want.2. Right-click somewhere in the middle of the blank area and select Displays-Variable Value.This will place a new page component on the screen. There are many different components available that allow you tocreate custom screens. This particular component simply displays a changing value in text form.3. Right click on the new component and select Properties.All of the screen components have differentproperties windows for configuring the lookof the component and telling the componentwhat data to display.4. Next to Caption:, enter Pressure.The caption is what is displayed in front ofyour value. A colon is automatically addedwhen displayed.5. Next to Expression:, enter Pressure[0].Expressions are actually formulas that youcan enter to display calculated data. In thiscase, the formula simply requests the mostrecent data point of the channel pressure. The[0] indicates the most recent data point. If,for example, we wanted to convert the pressure voltage into actually pressure units, we could put something likePressure[0] / 5 * 500. You can also use Conversions, as discussed in the help file, to convert the input into pressureunits right at the channel and avoid voltages all together.6. Click on OK.Now the screen should display Pressure: 0.324 V with a changing number. This is the current value in the pressurechannel we created earlier. Feel free to open the properties window again and play with the units, font and othersettings.Feel free to play with other similar components if you'd like. When done, you can delete them by selecting the component(Control - Click) and then right clicking and selecting Delete Component. To move a component, hold the Control key andclick and drag the component. All component manipulation uses the Control key, as a regular click will activate an action,such as a button press.Graphing / Trending the dataDisplaying scalar values in text form is certainly useful, but nothing is better than a graph to give you a handle on what ishappening with your system. DAQFactory offers many advanced graphing capabilities to help you better understand yoursystem. In this section we will make a simple Y vs time or trend graph.1. If you are still displaying the page with the value on it, hit the 1 key to switch to Page 1. If you are in a different view,click on Page 1 in the workspace.The workspace is only one way to switch among pages. Another is using speed keys which can be assigned to a page.2. Right click somewhere on the blank page and select Graphs - 2D Graph. Move and resize the graph so it takes up mostof the screen by holding down the control key and dragging the component. Drag the black square boxes around theselected graph to resize. Next, open the properties window for the graph.
3. Next to Y Expression: type Pressure.The Y expression is an expression just like the others we have seen so far. The difference is that a graph expects a list(or array) of values to plot, where in the previous components we have only wanted the most recent value. By simplynaming the channel in the Y expression and not putting a [0] after it, we are telling the graph we want the entire historyof values stored in memory for the channel. The history length, which determines how many values are kept inmemory and therefore how far back in time we can plot is one of the parameters of each channel that we left in itsdefault setting of 3600.4. Leave all the rest in their default settings and click OK.You should now see your data displayed in the graph. The data will move from right to left as more data is acquiredfor the pressure channel. To better display the data, we need to change the Y axis scaling.5. Double click on the left axis of the graph.Unlike other components, you can double click on different areas of the graph to open the properties window for thegraph to different pages. Double clicking on the left axis brings up the axis page with the left axis selected.6. Next to Scale From enter 0, next to Scale To enter 2.5, then click OK.This will scale the graph from 0 to 2.5 which will should show the full range of the input. You may want to adjustthese numbers to your particular signal.
Now we'll try another method to scale the graph.7. Open the graph properties box again and go to the Traces page. Change the Y Expression to Pressure * 10 and hit OK.Like the other screen components, the expressions in graphs can be calculations as well as simple channels. In thiscase, we are multiplying each of the values of Pressure's history by 10 and plotting them.8. Deselect the graph by clicking on the page outside of the graph. The shaded rectangle should disappear. Next, rightclick on the graph and select AutoScale - Y AxisThe graph component has two different right click popup menus. When selected, it displays the same popup menu asthe rest of the components. When it is unselected, it displays a completely different popup for manipulating the specialfeatures of the graph.After autoscaling, you should see the graph properly scaled to display your signal zoomed in. Notice the rectanglearound the graph. The left and right sides are green, while the top and bottom are purple. The purple lines indicate thatthe Y axis of the graph is "frozen". A frozen axis ignores the scaling parameters set in the properties window (like wedid in step 6 above) and uses the scaling from an autoscale, pan, or zoom.9. To "thaw" the frozen axis, right click on the graph and select Freeze/Thaw - Thaw Y AxisOnce thawed, the graph will revert to the 0 to 2.5 scaling indicated in the properties box and the box surrounding thegraph will be drawn entirely in green.10. Double click on the bottom axis to open the properties to the axis page with the bottom axis selected. Next to TimeWidth:, enter 120 and hit OK.If the double click method does not work, you can always open the properties window for the graph using normalmethods, select the Axes page and click on Bottom Axis.In a vs. time graph, the bottom axis does not have a fixed scale. It changes as new data comes in so that the new dataalways appears at the very right of the graph. The time width parameter determines how far back in time from the mostrecent data point is displayed. By changing it from the default 60 to 120 we have told the graph to plot the last 2 minutes ofdata.Once again, if you zoom, autoscale, or pan the graph along the x axis, it will freeze the x axis and the graph will no longerupdate with newly acquired values. You must then thaw the axis to have the graph display a marching trace as normal.Controlling an outputIn addition to taking data, most systems also control outputs. Here we will create an output channel and control it manuallyfrom a page component.1. Click on CHANNELS: in the workspace to go to the channel table.2. Click on Add to create a new row in the table.3. In the new row, name the channel Out, Device Type LabJack of course, D# of 1, I/O type of D to A, and a Channel # of0. Leave the rest in their defaults.4. Click on Apply to save your changes.The output channel has been created, but it hasn't been set to anything.5. Click on Page 0 to go to our first page.6. Right-click and select Displays-Variable Value to create another variable value component.7. Right click on the new component and select Properties. to open the properties window.
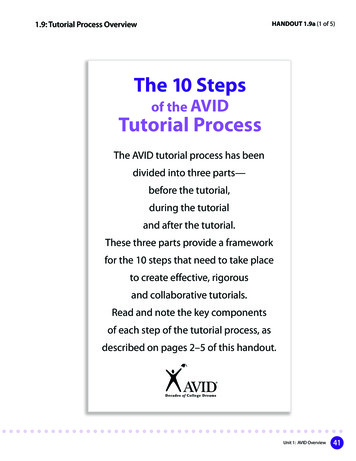
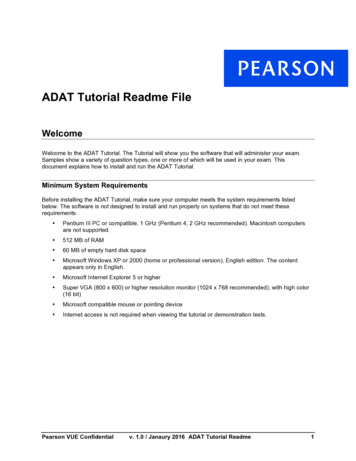
8. For the expression, enter Out[0].Feel free to set the caption as well. Like before, this will simply display the most recent value of the out channel.9. Click on Action tab.This tab exists on several different components including the static ones and works the same way with all of them.10. From the Action drop down, select Set To.There are many different options for the Actiondescribed in the DAQFactory help. The Set To actionwill prompt the user for a new value when thecomponent is clicked.11. Next go to Action Channel: type Out.12. Leave the Range blank and click OK.The range allows you to constrain the inputs toparticular values. By leaving these properties blank,we are indicating that we do not want a rangelimitation. The page will now display your captionand 0 with a big red X through it. This indicates thatout does not have a valid value yet. This is because wehaven't set it to anything.13. Click on the component. A new window will appear requesting a new value. Enter a voltage value within the DACrange, such as 2, and hit OK.Out will now be set to the value you entered. The component will now display your new value without the big red X.If you tie a wire between DAC0 and FIO0 you will see the Pressure reading track with the DAC output. Note, if you’dlike to be able to enter an output value in units other then volts, you need to create a Conversion and apply it to youroutput channel. This is described in the online help.Logging DataNext we will learn how to store this data to disk sothat it can be opened with another program foranalysis. In this example we will create a simplecomma delimited file with our pressure data.1. Click on LOGGING: in the workspace.This will display the logging set summaryview. Here you can see all your logging setsdisplayed and their running status. A loggingset is a group of data values being logged in aparticular way to a particular file. You canhave as many logging sets as you need, andthey can run concurrently.2. Click on the Add button in the logging set andwhen prompted for the new name, type in Log andclick OK.Like channels and all other DAQFactory names, the logging set name must start with a letter and only contain letters,numbers or the underscore. Once you click OK, the logging set view will be displayed for the new logging set. Youcan also get to this view by clicking on the logging set name listed under LOGGING: in the workspace. You may haveto click on the sign next to LOGGING to see your logging sets listed in the workspace.
3. Next to Logging Method, select ASCII DelimitedASCII Delimited is probably the most common method for data logging as it can be read by most other programs suchas Excel. Unfortunately, it is not as space efficient or fast as the binary methods. But unless you have strict spaceconstraints or you are logging more than about 50,000 points per second (depending also on your computer / harddrivespeed), we suggest ASCII.4. Next to File Name enter c:\mylogfile.csvIt is usually best to fully specify the path to yourfile, otherwise the data will be stored in yourDAQFactory directory. The .csv is a windowsstandard designation for comma delimited values.5. In the Channels Available table, click on the rowwith Pressure, then click on the button to move itto the Channels to Log table.Each logging set can log any combination ofchannels. In this case, we will just log the inputchannel.6. Click on Apply to save the changes.7. To start logging, click on the next to LOGGING to display the new logging set, then right click on the logging set Logand select Begin Logging Set.Once started, the icon next to Log will change and the red stop sign will be removed to indicate that this logging set isrunning.8. Wait at least 10 or 15 seconds to log some data and then right click on the logging set again and select End Logging Setto stop logging.There are other ways to start and stop logging sets, including the action page of some components such as the variablevalue component that we used earlier.9. Now start Excel or Notepad and open the file c:\mylogfile.csv.You will see two columns, time and data. By default the time is given in Excel / Access format which is decimal dayssince 1900. You can also have DAQFactory log in its standard format of seconds since 1970. If you are using Exceland logging the time in Excel format, you can format the first column as date / time and the numbers displayed will beproperly displayed as date and time.Hint: if you cannot find the mylogfile.csv file, check to make sure that you selected Pressure to log and not Out. Since Outis an output channel, it only gets new values to log when you actually set it to something.You have now acquired, displayed and logged your data.For basic applications, it is simply a matter of repeating most of these steps for additional channels. But even for the mostbasic applications DAQFactory offers many adjustments for fine tuning your application to work the way you want. These,along with many more walk-throughs and examples are provided in the appropriate sections of the DAQFactory help. Atthis point we suggest playing with DAQFactory a bit, jumping to the appropriate sections of the manual for more detail onthe areas of DAQFactory you may be interested in utilizing, and checking out the samples installed with DAQFactory.
From your Start menu, select Programs DAQFactory Express DAQFactory Express. This document will show you how to start from scratch and quickly start taking data and controlling outputs. This document is essentially the same as the guided tour in the DAQFactory help adapted for the U3.