Transcription
ANNUITIES ALM – APRACTICAL APPROACH(Understanding risk and volatility in the real worldof credit crises)Chris Seddon FIA FIAAKelvin Mo FIAA
AGENDA1)2)3)4)5)Introduction – the credit crisisSetting the sceneAttribution modelTricks for the beginnerConclusion
INTRODUCTION –THE CREDIT CRISIS
The credit crisis The recent credit crisis has had a significant impacton fixed interest assets through:– Credit spread margin changes– Credit rating downgrades (limited)– Credit defaults (very limited) Credit spreads over government bonds increased by:– 133bp for AAA, 171bp for AA (Mar 07 – Mar 08) Credit spreads over swap yields increased by:– 56bp for AAA, 96bp for AA (Mar 07 – Mar 08)
Impact of credit spread margins - exampleCharacteristicAnnuity PortfolioAverage Duration (matched)3 YearsFUM 1 billionCredit Rating of AssetsExpected Profitability50% AAA, 50% AA0.1% of FUMImpact of Credit Spread ChangesRisk Free RateExpected Profit ( million)Capital Loss ( million)GovernmentBond YieldsSwap Yields 1.0 1.0( 45.60)( 22.80)
Other impacts The investment profit of an annuity portfolio duringthe credit crisis would also have been impacted by:– Losses from credit rating migrations– Losses from credit defaults– Yield curve changes (if not cash flow matched) In practice it is generally difficult to understand theinvestment profit due to the number of possiblefactors impacting it. Investment profit can be multiples (several) of theexpected profit margin. Conclusion - need a systematic methodology forattributing investment returns
SETTING THE SCENE
Context - ALM defined Understanding and managing theinteraction between asset-related riskdrivers and liability-related risk drivers Objective: align the risks of the assetportfolio and liabilities within the riskobjectives and appetite of the business
ALM NOT MatchingALM includes but is not limited to matching“Our portfolio is well matched”What does that mean? Duration matching Cash flow matching Bucket hedging
Assumptions Business drivers have been defined:Eg minimising capital, target ROC, target profit andprofit volatility Investment strategy has been developedaccording to the nature of the liabilities, takinginto account:– Expectations of policyholders - return, security– Expectations of shareholders - return, volatility,availability and amount of capital
Analysis of profits It is assumed that a full analysis is beingperformed:– Profit margins, loss reversal for lifetime annuities,model changes– Investments– Mortality, expenses, commission etc This presentation focuses on the question:what caused the investment profits? The actions to be taken as a result areoutside the scope of this presentation
Investment profit volatility Caused by:– IFRS – valuing liabilities using risk-freediscount rates and assets at market yields– Changes to yield curves– Changes to credit spreads¾Need to understand: how much of theinvestment profit/loss is attributable towhich of these reasons (and others )
ATTRIBUTION MODEL
Attribution analysis Objective is to break down theinvestment profit/loss into:– Income factors: unwinding of discount– Market value factors: changes in market yieldsand discount rates Forms part of the overall analysis ofprofit for an annuity portfolio
Income factors Unwinding of yield/discount Market yield can be broken down furtherinto:– the risk-free rate– the credit spread Residual component, due to shape ofthe yield curve (“calendar” income)
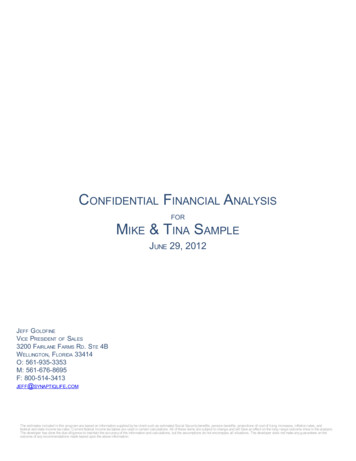
Market value factors Changes due in risk-free yield curve:– Parallel movements (“shift” return)– Non-parallel movements (“twist” return) Changes in credit characteristics:– Credit migration– Movements in credit spreads Changes in inflation assumptions
Main factorsYield curve tw istYield curve shiftYieldYield curve shiftTermBeginning of periodEnd of periodParallel shift
How to do it More than one way to do it Prerequisite: cash flow projections forassets and liabilities Performed at a security (ideal) orportfolio level
How to do it Separate asset market yields into riskfree plus credit spread Income factors:(MV Weighted cash flows) Yield Market value factors– Value assets and liabilities using risk-free ratesand credit spreads at the start of the period– Change these one at a time until they reach theones applying at the end of the period
How to do it Profit/loss associated with the factor is:Change in assets Change in liabilities Example: Profit due to parallel yieldcurve movements– Value assets and liabilities using risk-free yieldcurve at the beginning of period– Revalue them using risk-free yield curve shifted upor down by a defined amount (e.g. at portfolioduration)
Simple example How different matching approachesdeliver different profit and lossoutcomes How attribution analysis can be used toexplain these outcomes to management
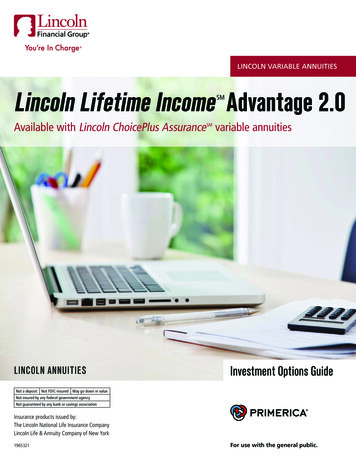
Portfolio 1: Cash flow matched1501005001234567-50-100-150Asset AAAsfLiabilities8910
Portfolio 2: Duration matched2 assets withdifferent t AAAsfAsset AALiabilities201918171615141312111098765432-2010
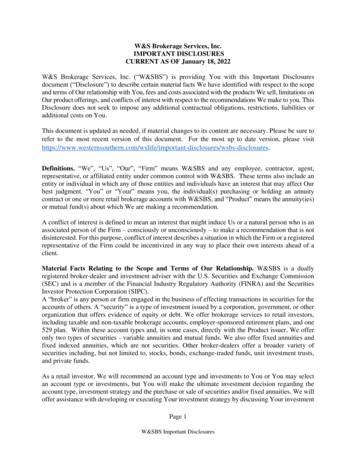
Yield curve movementsUpwards shift of51bps at period 89.0%8.5%8.0%7.5%7.0%6.5%6.0%0510Start15End20
Spread movements807060bps50403020100AAAsfAAStartEnd
Results: Portfolio 1ItemRisk free incomeCredit incomeCalendar incomeShift returnTwist returnSpread 0.8Liabilities6.30.00.1-2.8-0.40.0-0.13.0Numbers may not add up due to rounding.Profit-0.10.10.00.00.0-2.30.0-2.2No impact from yieldcurve movements but credit spreadscan still providesignificant impactP&L impact can besignificant whencompared against anasset value of about80
Results: Portfolio 2ItemRisk free incomeCredit incomeCalendar incomeShift returnTwist returnSpread 1.4Liabilities6.30.00.1-2.8-0.40.0-0.13.0Numbers may not add up due to n matchingprovides someprotection againstparallel shifts of yieldcurve (51 bps) but not nonparallel twists, plus additionalimpact from creditspreads
Findings Almost all investment income can bebroken down to a number of factors Duration matching may not provideprotection during significant volatility ininterest rate markets
Stress testing The same process can be used to testthe portfolio, using stressed yield curveand credit spread scenarios
TRICKS FOR THEBEGINNER
Practical issuesAlignment with management reporting– Ensure asset values in attribution modelagree with values in investments assetregistry system and in general ledger– Ensure investment income being analysedagrees with investment income in ledger– Ensure liability values in attribution modelagree with actuarial valuation
Swap curve Need continuous swap curve to deriveappropriate discount rates but swaprates are only available at certain points Consider interpolation methods Consider how to set assumptions forlong term liabilities (eg beyond 20years) where swap curve data is poor
Inflation Potential mismatch between quantum ofindexed-linked assets and CPI-linkedliabilities Mismatch of cash flows of indexed assets andliabilities Differences among:– Inflation assumed in current market value ofindexed-linked assets– Future inflation assumption for cash flows ofindexed-linked assets– Future inflation assumption for CPI-linked liabilities
Transactions and cash flows Analysis typically based on end ofmonth data Adjustment required for new businessduring the period under review Adjustment required for assettransactions during the period
Frequency of analysis Monthly results more accurate as assumptionchanges and residual items of the attributionhave less impact Assumptions on cash flows are less accurateif analysis is over longer period Monthly analysis is more labour intensivethan producing results on a YTD basis
CONCLUSION For annuities the investment profit can bevery large, relative to other experience items. Attribution model provides insight into causesof investment profit/loss This enhances management’s understandingof drivers of business Leads to review of risk appetite, investmentstrategy
ANNUITIES ALM - A PRACTICAL APPROACH (Understanding risk and volatility in the real world of credit crises) . 50% AAA, 50% AA: Expected Profitability. 0.1% of FUM: Impact of Credit Spread Changes. Risk Free Rate. Government . Bond Yields. Swap Yields. Expected Profit ( million) 1.0.