Transcription
Community FlexFlexibility and energy efficiency catalogue
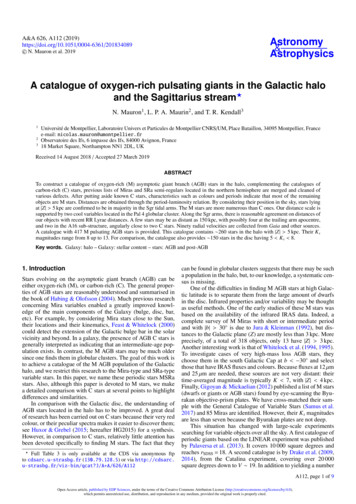
TECHNOLOGY BROCHURECOMMUNITY FLEXAbout this brochureOur use of electricity to light and heat homes, and power our cars is increasing. This can be partly offset bythe continuously improving energy efficiency of appliances. This creates a challenge for network operatorslike Scottish & Southern Electricity Networks (SSEN) that are responsible for distributing electricity to theircustomers. Instead of simply reinforcing the power grid, network operators are increasingly looking forenergy efficiency and flexibility as cost-effective alternatives to guarantee the delivery of power, now andin the future. This brochure provides an overview of measures that businesses and communities can take tosupport this, and remuneration that is available from SSEN and other sources. that are responsible fordistributing electricity to their customers. Instead of simply reinforcing the power grid, network operatorsare increasingly looking for energy efficiency and flexibility as cost-effective alternatives to guarantee thedelivery of power, now and in the future. This brochure provides an overview of measures that businessesand communities can take to support this, and remuneration that is available from SSEN and other sources.Our energy system is changingOur energy system is undergoing monumental changes, primarily as a result of the need to strongly reduceemissions to limit climate change, which is already being felt around the globe, and to curb air pollution. Asmost renewable energy is generated in the form of electricity, the decarbonisation of the energy system isto a large extent electrification. The advent of electric vehicles (EVs) is one of the more visible indicators ofthis. Also, all new-build properties are planned to be fitted with heat pumps (instead of gas boilers) within afew years. The increasing demand for electricity has strong implications for the electricity distribution grid.Historically, the electricity distribution network operator (DNO) has applied a predict-and-provide strategyfor users – providing secure supply, whatever consumers demand, at whatever time. The cost of this isincreasing, due to the large number of infrastructure upgrades required to cover peak loads, while networkcapacity is under-utilised for the rest of the day. Ofgem suggest that reducing peak electricity load by 10%would save between 550 million and 1.2 billion per year on national infrastructure costs. Factoring in theincrease in electric vehicle and heat pump deployment, and the distributed generation outputs of domesticPV and batteries - the benefits are likely to be much higher. An approach that focuses on energy efficiencyand savings, and exploits flexibility in the system by rewarding behaviour change, is expected to be a morecost-effective approach that benefits customers and the climate, and that SSEN is keen to explore.Constraint Management and Community FlexSome parts of the local electricity network may approach maximum capacity when there is high (andincreasing) electricity demand or supply. This may be due to an increase in numbers of homes, businesses,electrical heating, electric vehicle charging or renewable generation. The times of peak events where thereis high demand are traditionally on winter evenings between around 16:00 and 19:00 hours, while eventsfrom over-supply of solar generation are more likely to occur at midday in summer. The times of events willvary across the network, being influenced by the level of local industry, housing and renewable generation.The graph below illustrates the problem where demand is forecast to exceed the network’s design limits.Page 2
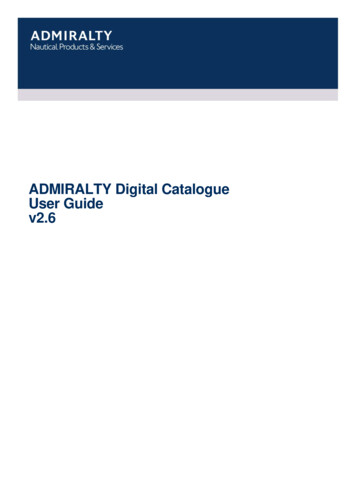
TECHNOLOGY BROCHURECOMMUNITY FLEXSSEN constantly monitors its network, and where the electricity network in an area is projected to becomeoverloaded, that area may be designated a Constraint Managed Zone (CMZ). Here contracts are negotiatedwith commercial organisations to lower demand or provide on-site generation – known as “flexibility” – attimes of peak demand, or constraint, in a local area.Social Constraint Managed Zones (SCMZs) aim to unlock Community Flex by providing financial rewards tolocal community organisation and businesses to encourage them to develop community-based projectsthat provide flexibility and energy saving. These projects thereby help address the network issues whilstbenefitting those communities. Benefits extend beyond financial rewards as many projects also improvebuilding quality and living comfort.SSEN welcome proposals for any project which would lower demand at peak periods of electricity demand/ consumption in an area. There are many examples of projects which may do this, and this brochure aimsto highlight a few of these methods, but projects may be a mixture of approaches. The charts which followillustrate 3 different approaches to reducing peak demand in a community, and their effects on energy use.Peak reduction reduces energy use (or generates electricity locally) at the peak time. Load-shifting doesnot reduce total electricity use but moves it to a non-peak time when the network can better meet thedemand, whereas load reduction improves efficiency, reducing consumption over the daily profile. This isillustrated in the figure below.Examples of load reduction (left panel) through energy saving and load shifting (right panel) thoughdemand response. Without community flex the load would temporary exceed the network limits. Theexpected load without any measures (blue lines) is adjusted using Community Flex to stay within thenetwork limits (green lines).It is hoped that this brochure will assist prospective community partners to develop ideas for projects. Theexamples included are not an exhaustive list - other ideas, to help reduce consumption or move electricityuse out of peak times, are also welcomed.Page 3
TECHNOLOGY BROCHURECOMMUNITY FLEXContracts & PaymentSSEN can predict the level of flexibility needed and the times when it might be required for an area of theelectricity distribution network under consideration, up to 24 months ahead of time. Projects and locationsfor Community Flex will be sourced based on this estimated need for load reduction.For example, in the Drayton zone, up to 5MW of flexibility needs to be available on weekdays in Novemberbetween 16:30 and 18:10. There are a few days per year when this flexibility will be utilised. The networkoperator can predict these in advance and notify flexibility providers about when they will be required –this can be through smart technology, or by emails or text messages. Usually constraint events would be onweekdays, so all assessments in this brochure have been made based on weekdays only. Flexibility need,timings and payments will vary between constraint zones and exact values would be calculated by SSEN .and payments will vary between constraint zones and exact values would be calculated by SSEN.Contracts for Community Flex are currently for 4 years1, and are covered by 3 different contract types:1. Utilisation only: The provider is paid on a per-event basis when the flexibility is required and provided. This type of contract may be best suited to projects where energy demand is reduced, orenergy generation turned on, in response to a signal from the electricity network operator.2. Availability only: Payments are made for flexibility during the tendered time-window (whether or not aspecific network constraint event occurs). This is best suited to efficiency projects which permanently reduce electricity use,including through the constraint time-period.3. Traditional mix – both Availability and Utilisation: Here payments are made both during the specific network overload / constraint event(utilisation), AND for the periods when flexibility is normally required. This could be suited to traditional electricity generation projects (which includes batteries)which generate & reduce capacity network constraints during the critical hours on anongoing basis.The table below shows payment levels for contracts for 2 example Community Flex zones. Payment levelsmay be quite different between zones so the amounts below serve as an indication only. It is necessary toconsult the payment levels for the zone in question when estimating levels of payment for your project.Type of contractUtilisation OnlyAvailability Only1Page 4Payment levels for Drayton zone 868/MWh for 1.6h events 33 per kW availablePayment levels for Coxmoor Wood 638/MWh for 4.5h events 69 per kW availableContract values and durations may vary significantly across CMZ sites
TECHNOLOGY BROCHURETraditional MixUtilisation: 4963/MWhAvailability: 150/MW/hCOMMUNITY FLEXUtilisation: 140/MWhAvailability: 38/MW/hHow to participateSSEN welcomes proposals for lowering peak demand from interested parties. It should be noted thoughthat all projects and Community Flex areas are quite different. SSEN’s engineers will evaluate and costevery proposal on its individual merits, factoring in the electrical load saving required, the times of day andthe number of times per year that the reductions are forecast to be required, compared to the cost ofupgrade works which would be required if SSEN replaced the equipment in the traditional way now. Thiswill allow partners to see anticipated funding available to community organisations to develop a project.Those wishing to offer flexibility services need to complete a Pre-qualification Questionnaire (InitialProcurement document) followed by the Invitation to Tender (Full procurement document). Applicantsmust register on a procurement system called Achilles. This only needs to be done at Supplier RegistrationSystem (SRS) level (no fee), and allows SSEN to set flexibility providers up on their Emptoris tenderingsystem. The tenders will be assessed based on a number of technical, economic and social criteria.SSEN must be sure that the project will deliver the electricity savings or flexibility required, and that theycan be relied upon for several years. The examples in this brochure give organisations an introduction ofwhat may be considered, how payments may be calculated, and possible funding levels.How to use the brochureThis brochure includes a series of example measures or interventions which could provide flexibility. It isintended this should be used to provide guidelines to SME and community-based groups to build a virtual‘shopping cart’ of initiative’s they may wish to consider under a community flex scheme. This can then beused to estimate initial kW and kWh load-reductions and resultant community flex payments to aid in initialbusiness case development and the commercial benefits of participating in a community flex programme.Types of measuresThe types of measures can be energy efficiency, indirect demand response or direct demand response. Energy savings & energy efficiency measures aim at reducing the energy consumption ofparticipants by either upgrading appliances to more energy efficient ones.Indirect demand response provides time-dependent incentives to customers, encouraging them toshift electricity consumption in general to periods of lower demand.With direct demand response, the network operator rewards customers for agreeing to respond tospecific requests (perhaps via email, SMS, or an app) to adjust their load or generation profile tomanage potential constraint situations.Attractiveness to network and customer benefitsEach measure is scored between 1 and 3 on its attractiveness to the network. This has been assessed bytaking into account the amount of savings or flexibility that the measure might provide, the security of thesupply of the flexibility, the expected longevity of the impact and the maturity of the technology.The consumer benefits are also assessed with a score of between 1 and 3. This is based on the cost of themeasure or intervention, the convenience of operation, the personal benefits provided by the measure(e.g. thermal comfort) and the impact on the climate.Page 5
TECHNOLOGY BROCHURECOMMUNITY FLEXSavings potential and example paymentsThere is a description of the measure and a discussion of its savings potential which includes a graph.Savings in kilowatts (kW) from the measures shown in the graph can be used to estimate the paymentsfrom Community Flex using the contract payment levels.For example, in the Drayton zone, the availability window for constraint events occurs during lateafternoons in November. The payment for an availability-only contract is 33 per kW over the duration ofthe contract. Information in the measures section (below) shows that a saving of approximately 95kWcould be achieved by replacing 1000 sodium streetlights with LED equivalents. This means the paymentover the contract is 33/kW x 95kW 3,135.Value stacking and sources of fundingOne Community Flex project can provide services, and thus value, to multiple parties in the energy system.This is called value stacking. Value stacking should always be considered for measures during the projectplanning stages, where the measure provides multiple incomes, to improve the return on investment. Forexample, a battery could provide power grid support services to National Grid much of the time andoccasionally also be used to support an electricity distribution network constraint event. At times ameasure can achieve the aims of several services at the same time.Also discussed are additional sources of funding towards measures. These are likely to be the main sourceof funding towards installing a new measure, with Community Flex contract payments providing anadditional top-up to help improve the business case.Page 6
List of example technologies and measuresDomestic LED lighting . 8LED street lighting. 9Domestic solar PV . 11Loft insulation . 12Cavity wall insulation . 13Solid wall insulation . 14New heating controls or peak-rate heaters . 15Replacing peak-rate electric heaters with storage heaters. 16Replacing electric showers . 17Replacing peak rate electric heaters with a heat pump . 18Large domestic battery on a time-of-use tariff . 19Community Battery . 20EV charging – delaying charge time. 21Smart Apps for behaviour change . 22Energy Advice . 23Page 7
MEASURESLED LIGHTINGDomestic LED lightingType of measure:Energy SavingAttractiveness to network: Customer benefits:Type of contract:Availability onlyReplacing incandescent or halogen bulbs with LED bulbs can typically reduce consumption by between 80and 90%. This can include B22 bayonet bulbs consuming 40 to 100W or GU10 or GU5.3 downlights, rated at50W or 35W. A halogen bulb may have a lifespan of up to 2,000 hours, whereas an LED is expected to last25,000 hours.Savings potentialIf a 50W Halogen bulb is replaced by a 4W LED, the saving per bulb would be 46W. Therefore if 1000 bulbswere replaced and they were all running, the saving would be 46kW. In practice not all the bulbs would berunning at the same time, so taking this into account, the saving is projected to be 6.9kW during peak hours(4-8pm) and 4.6kW after 8pm. An assessment of the savings expected at different times of year is shownbelow, taking into account the changing time of sunset.kW reduction for 1000 LED -6pm6-8pm8-10pmExample paymentFor illustration purposes, an estimate of the payments for an example contract is shown. Note that theconstraint times and contract values will differ considerably between different Community Flex zones.Example calculations for other measures are provided in the Appendix. Payments will vary betweenconstraint zones and exact values would be calculated by SSEN.Events at the Coxmoor Wood zone occur in winter between 3.50pm and 8.20pm. It is possible to estimatethe average kW reduction from installing 1000 LED bulbs to replace old incandescent or halogen ones byaveraging the reduction in winter for the time periods 4-6pm and 6-8pm. Page 8Average kW saving during event 0.5 x (6.5 6.9) 6.7kWPayment (total) over 4-year contract at Coxmoor Wood 6.7kW x 69/kW 462
MEASURESLED LIGHTINGLED street lightingType of measure:Energy EfficiencyAttractiveness to network: Customer benefits:Type of contract:Availability onlyThe power consumption from street lighting may be from 35W to 400W per unit. Savings can be made byupgrading lighting, including replacing old sodium street lighting units with LED, and reducing excesslighting so that only town centres and main roads have the highest lighting intensity, whilst reducing lightpollution. There is also potential for further financial savings by dimming, timer control, selective switchingor presence detection to be used, though these solutions are usually only used outside peak hours so not attimes when they would attract Community Flex payments.Savings potentialThis example considers replacing old 90W SOX sodium street lighting with modern 35W LED units. Onaverage, due to the power consumption of the control and ballast equipment for the light, 90W unitsactually consume around 130W2. This results in a saving of 95W per unit. In addition, LED lamps have anestimated lifetime of 10 years, compared to a 3 to 4-year lifetime for sodium bulbs.kW reduction for 1000 streetlightsThe savings from replacing 1000 SOX sodium streetlights is therefore 95kW during operation. The variationof these savings with time of year is shown below, as sunset time changes.Sources of terSalix Finance Ltd3 provides interest-freeGovernment funding to the public sectorto improve energy efficiency and reducecarbon emissions. Street lighting is oneof the measures which are eligible. Forlocal authorities, the loan is usuallyrepaid from energy savings within a 5year period.12-2pm 2-4pm 4-6pm 6-8pm 8-10pmExample paymentFor Coxmoor Wood zone, peak events occur in winter between 3.50pm and 8.20pm. An estimate of theaverage kW reduction from 1000 LED streetlight installations is made by averaging the reduction in winterfor the time periods 4-6pm and 6-8pm: Average kW saving during event 0.5 x (35 95) 65kWThe total payment over a 4-year contract would therefore be approx. 65kW x 69/kW 4,485. Contractsand payment levels for Community Flex will vary between different constraint zones. Payments will varybetween constraint zones and exact values would be calculated by SSEN.2Street Lighting Load Research Report, elexon.co.uk/wpcontent/uploads/2012/03/Street Lighting Load Research SOX SON 2012.pdf, [Accessed 5/9/2019]3 Salix Finance Ltd /local-authorities [Accessed 31 Oct 2019]Page 9
MEASURESLED LIGHTINGOffice / commercial LED lightingType of measure:Energy EfficiencyAttractiveness to network: Customer benefits:Type of contract:Availability onlyOffice lighting is often used consistently during the day, and savings can be made by replacing fluorescenttubes with LED panel lights. LEDs have an estimated lifespan of around 10 years, compared to under 6 yearsfor fluorescent tubes. Other benefits are that the new LED fittings use “daylight” wavelength (less blue thanoriginal LEDs), reported to be a healthier light wavelength for an office or commercial space. Additionalsavings can be achieved by zoning circuits to enable lights to be turned off in areas which are not beingused, and use of passive infrared sensors (PIR sensors), which can work as occupancy detectors.Savings potentialMany offices have recessed lighting fittings in the ceiling which contain 3 x T8 fluorescent tubes and thesecan be replaced by LED panels. The savings per light fitting are about 30W and so replacing 3000 T8 tubeswith 1000 LED fittings could save 30kW.ScenarioBaselineEnergy efficientBulb typeFluorescent T8 tubes (2 foot)LED panel replacementSaving per lighting unitkW reduction for 1000 office 4pm4-6pm6-8pm8-10pmDemand3 x 25W 75W45W30WIn practice, not all lights will beused during the whole day: it isassumed that 90% of lights areused during office hours (9am4pm), 70% are used as staffenter and leave the office (8am9am and 4pm-6pm) while only5% are used from 6pm-7pmwhen staff rarely use the office.The lights are used throughoutthe year and so this leads to avariation with time and monthas shown.Value stacking and sources of fundingAgain, Salix Finance could be a suitable source of interest-free funding for an installation in the publicsector. Eligible public sector buildings include council offices, libraries, sports centres, museums, schools,colleges and hospitals.Example paymentThe payment level for replacing 1000 office light fittings with LEDs was estimated to be 693 for theDrayton zone and 752 for Coxmoor Wood. These calculations are shown in the Appendix. Payments willvary between constraint zones and exact values would be calculated by SSEN.Page 10
TECHNOLOGY BROCHURESOLAR PVDomestic solar PVType of measure:Energy EfficiencyAttractiveness to network: Customer benefits:Type of contract:Availability onlySolar photovoltaic (PV) panels generateelectricity which can be used in the home (or business) or exported to the electricity grid. As well aspowering domestic appliances, it can be used with a solar immersion device to heat water, or to charge abattery or electric vehicle. When adopted at scale, there can be issues due to significant levels of PV exportunless the systems have been coupled with local storage.The generation from a PV system is influenced by the: system size, location, tilt, orientation and shading. APV system will generate less electricity in winter when the days are shorter, and the sun is lower in the sky.Higher levels of generation occur between March and October.Savings potential7.0kW generated from10kW of solar PVSimulations of the average hourly PV6.0output were made for 10kW of solar PV5.0Springfacing south at an angle of 35 degrees.4.0SummerThe graph shows how the average power3.0output of a PV system varies with time ofAutumn2.0day and season. There is little or no PVWinter1.0generation in the late afternoon / early0.0evening in winter. For many areas where12-2pm 2-4pm 4-6pm 6-8pm 8-10pmthe electricity network is constrained,maximum demand occurs on winterevenings between about 4pm and 8pm. A solar PV system on its own would therefore be of little benefit inreducing electricity demand on a winter evening and is therefore only likely to be encouraged in aCommunity Flex scheme where a constraint issue occurred at a non-standard time of day e.g. due toindustrial use.However, if a battery were also installed, this might be charged up earlier in the day, to power the home orbusiness later in the afternoon / evening when constraint events are more likely to occur. Such a scenario iscalculated later in this catalogue.Value stacking and sources of fundingThe feed-in tariff (FiT) scheme for solar PV closed for new installations in March 2019. Installations that donot receive the FiT are eligible for the Smart Export Guarantee (SEG) from 2020. ECO3 can also providefunding towards solar PV in electrically heated homes for eligible households. Battery storage combineswell with solar PV, maximising self-consumption and potentially offering grid services.Example paymentNo payment is likely to be achieved for installing solar panels in a Community Flex zone where theconstraint period occurs on winter evenings, as a negligible solar generation is seen at this time. Paymentswould only be received by installation - as value stacking - in conjunction with a battery.Page 11
TECHNOLOGY BROCHUREINSULATIONLoft insulationType of measure:Energy EfficiencyAttractiveness to network: Customer benefits:Type of contract:Availability onlyInsulating a loft reduces the energy consumed to heat a house. If the house is heated by peak-rate electricheaters, this will lead to a reduction in electricity consumption. Although insulating properties heated byother fuels will save energy, it will not save electricity at the critical times.Most lofts are insulated by laying mineral wool along the joists as this is the cheapest solution, and thecurrent standard thickness is at least 270mm. More expensive alternatives are fitting insulation board orusing spray foam insulation at rafter level (ventilation of rafters via the eaves is still required). This has theadvantage of allowing use of the loft space for storage.Savings potentialThe annual savings due to loft insulation is estimated to be 450kWh for a home heated by peak-rateelectric heaters. This is an average across all property types. Using degree day data to assess heating need,and assuming that heaters run for 9 hours per day during the week and 16 hours per day during at theweekend, the below estimates of kW saving in electricity consumption were made.Expected savings from loft insulationper 10 households m4-6pm6-8pm8-10pmSources of fundingThe latest round of the Energy Company Obligation, ECO3 runs until 31 March 2022. Loft insulation can befunded for low income and vulnerable households who meet certain criteria or those who live in socialhousing with Energy Performance Certificates of band E or below. There may be other local sources offunding available in a locality – check with the local council for any schemes in the area.Example paymentThe total payment level for the 4-year contract of insulating the lofts of 10 households was estimated to be 152 for the Coxmoor Wood zone using a saving of 2.2kW in winter (see the Appendix). Payments will varybetween constraint zones and exact values would be calculated by SSEN.Page 12
TECHNOLOGY BROCHUREINSULATIONCavity wall insulationType of measure:Energy EfficiencyAttractiveness to network: Customer benefits:Type of contract:Availability onlyHomes built after the 1920s typically have a cavity between the innerand outer wall, which was originally aimed to reduce water penetration.The brick pattern for cavity walls has rows of bricks laid with their lengthexposed. Some properties with a cavity wall may however have arendered outer surface.After a tightening of Building Regulations in 1985, it became normal practice to fit insulation in the cavityfor new-build homes. Older properties with uninsulated cavities can have insulation retrofitted. Thisinvolves drilling regular holes in the external wall and injecting insulating material such as fibre, cellulose,polystyrene beads or polyurethane foam.Although cavity wall insulation will have limited impact on the electricity consumption of gas-heatedhomes, those which use peak-rate electric heaters will see an impact.Savings potentialThe annual electricity savings due to loft insulation is estimated to be 900kWh for a home heated by peakrate electric heaters. Using degree day data and assuming the heaters run for 9 hours per day during theweek and 16 hours per day during at the weekend, the below estimates of kW saving in electricityconsumption were made. These are shown for weekdays for each month.Sources of fundingExpected savings from cavity wallinsulation per 10 households 2-2pm2-4pm4-6pm6-8pmUnder ECO3, which runs until 31March 2022, cavity wall insulationcan be funded for households,owner-occupiers or those who areprivately renting who are inreceipt of qualifying benefits.Funding is also available for cavitywall insulation for social housingproperties with EPC ratings of E, For G.8-10pmExample paymentThe total payment level over the 4-year contract for insulating the cavity walls of 10 households wasestimated to be 304 for the Coxmoor Wood zone using a saving of 4.4kW in winter (see the Appendix).Payments will vary between constraint zones and exact values would be calculated by SSEN.Page 13
TECHNOLOGY BROCHUREINSULATIONSolid wall insulationType of measure:Energy EfficiencyAttractiveness to network: Customer benefits:Type of contract:Availability onlyBrick walls of properties before the 1920-30s typically did nothave cavities, so are described as “solid”. Ends of bricks can beseen in the brick pattern, which go straight through the thicknessof the wall. These walls can be insulated by external or internalwall insulation.Savings potentialExpected savings from solid
System (SRS) level (no fee), and allows SSEN to set flexibility providers up on their Emptoris tendering system. The tenders will be assessed based on a number of technical, economic and social criteria. SSEN must be sure that the project will deliver the electricity savings or flexibility required, and that they can be relied upon for several .