Transcription
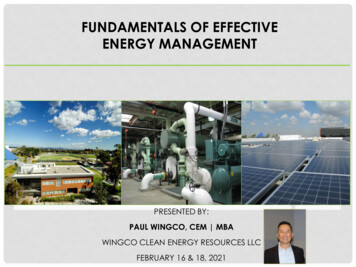
FUNDAMENTALS OF EFFECTIVEENERGY MANAGEMENTPRESENTED BY:PAUL WINGCO, CEM MBAWINGCO CLEAN ENERGY RESOURCES LLCFEBRUARY 16 & 18, 2021
EM & EE Workshop SeriesFundamentalsof mentStrategiesSmart O & Mfor HighPerformanceBuildingsIntermediateSmart BuildingTechnologiesfor EnergyEfficiencyAdvanced
Fundamentals of Effective Energy ManagementAgendaPart 1 Tue 2/16/21 Energy Fundamentals The Energy Management Process Intro to Energy Benchmarking Intro to Energy Audit Energy Efficiency Best PracticesPart 2 Thu 2/18/21 Portfolio Manager Benchmarking Tool Financing Energy Efficiency Measures Utility Incentives Energy Action Plan
DISCLOSURE STATEMENTAll information presented as part of this workshop is for the sole purpose ofsharing energy efficient best practices.Any opinion shared as part of this presentation are based on my professionalexperience and do not necessarily reflect the opinion of San Diego Gas andElectric. Any incidental mention of specific product names or brands is forillustrative purpose only and is not intended to endorse or promote anyspecific products or services.4
FUNDAMENTALS OF EFFECTIVE ENERGY MANAGEMENTTRIVIA 1Which major economic sector consumesthe most energy in the US?Answer: BuildingsBuildings consume 40%US Dept of Energy, Energy.Gov5
FUNDAMENTALS OF EFFECTIVE ENERGY MANAGEMENT6
FUNDAMENTALS OF EFFECTIVE ENERGY MANAGEMENTTRIVIA #2From a levelized cost perspective, which isthe most cost-effective electricity resourcein the US?Answer: Energy EfficiencySource: Rocky Mountain institute7
Source: /researchreports/u1402.pdf8
FUNDAMENTALS OF EFFECTIVE ENERGY MANAGEMENTTRIVIA #3What is the estimated total cost savingsattributed to energy efficiency in the US since1980?Answer: 800 BillionEnergy expenditures would have been 40%higher in 2017 without these investmentsSource: s/9
- 18%Source: American Council for an Energy Efficient Economy Energy Efficiency Impact Report
BUILDING SOLUTIONSCHANGING THE FUTURE OF ENERGYTHE ROCKY MOUNTAIN INSTITUTESource; https://www.youtube.com/watch?v yIi4aDCDrO811
FUNDAMENTALS OF EFFECTIVE ENERGYMANAGEMENTSource; Rocky Mountain Institute12
THE OPPORTUNITY WITHIN ENERGY EFFICIENT BUILDINGSSource: https://www.youtube.com/watch?v yIi4aDCDrO813
BARRIERS TO ENERGY MANAGEMENT Not my responsibilityNot our core businessEnergy is a fixed costRates are what they areNot much can be doneNo funding availableNo one cares
BARRIERS TO ENERGY EFFICIENCY Upfront capital costAssociated risksLack of informationMisaligned financial incentivesLegal or structural challengesUndervaluing energy efficiencyInertiaLack of mature funding mechanismsSource: The Carbon War Room: How to Create Climate Wealth Through Efficient Buildings15
CLASS OBJECTIVES Understand Energy FundamentalsLearn the Energy Management ProcessUnderstand the Concept of BenchmarkingUnderstand the Concept of an Energy AuditExamples of Energy Efficiency Measures (EEMs)Principles of Benchmarking ES Portfolio ManagerLearn Financial Analysis of Energy Efficiency MeasuresUnderstand Utility Incentives and How to Find ThemDevelop a Basic Energy Action Plan
ENERGY FUNDAMENTALS Energy Sources Energy Units The Utility Bill Basic Energy Accounting
ENERGY SOURCESElectricityStandard Billing Unit kWh (Kilowatt-hour)measures total electric energy consumptionequal toAmount of electrical energy used by a 100watt light bulb in 10 hours1 kWh 3412 BTUs
ENERGY SOURCESElectricityDemand (KW) Standard billing unit is the KilowattMeasures the instantaneous rate of Power used orgenerated1 KW 1,000 WattsInstantaneous energy demand equivalent to 10, 100watt light bulbs
ENERGY FUNDAMENTALS Energy Consumption kWh Odometer Energy Demand kW Speedometer
ENERGY CONSUMPTION VS DEMANDWhich will cost you more?Turning on a 1000 watt lamp for one hourTurning on a 100 watt lamp for 10 hoursBoth use the same amount of total energy 1 KWHBUTThe first scenario had the higher demand (X10)SOThe first scenario will pay more!
ENERGY SOURCESElectrical CostConsumption (KWH) Demand (KW) Total Energy Charge
ENERGY SOURCESElectrical CostEnergy Chargeplus Transmission/DistributionPlus Other Charges (Fees, Public Purpose charge,Taxes etc.) Total Electrical Bill
ENERGY SOURCESNatural GasStandard Billing Unit ThermBTU British Thermal Unit1 Therm 100,000 BTU1 BTU is the amount of energy required toraise 1 pound of water 1 deg F
BREAKING DOWN THE UTILITY BILL
BREAKING DOWN THE UTILITY BILL
TIME OF USE SCHEDULESource: siness
ENERGY FUNDAMENTALSThe BTUBritish Thermal Unit The basic unit forheat energyEquivalent to the amount of energyrequired to heat 1 lb of water 1 deg. F
ENERGY FUNDAMENTALSNatural Gas : Therm 100,000 BTUSource: http://theelectricenergy.com
THE ENERGY USE INDEXEUIThe building Energy Use Index (EUI) is an energybenchmarking metric used to measure theenergy intensity of a building relative to its size.The Standard Unit of measure for the EUI is:KBTU per Square Feet per Year*The lower the EUI the better the energyperformance*
THE ENERGY USE INDEXEUISource https://youtu.be/u3wbcxhHdHk
SAMPLE CALCULATION OF EUIAnnual Electricity 25,000 kWHAnnual Natural Gas 1800 ThermsFacility Type – Office BuildingGSF 8,3001. 25,000 X 3412 Btu/kWh 85,300,000 BTUS2. 1,800 x 100,000 BTUS/Therm 180,000,000 BTUS3. (Line 1 Line 2)/1000 265,300 KBTUS4. Divide Line 3 by 8,300 GSF 32 KBTU/GSF5. Building Site EUI 32 KBTU/GSF/Yr
US ENERGY USE INTENSITY BY PROPERTY TYPESource: nce/US%20National%20Median%20Table.pdf
SAMPLE CALCULATION OF EUIOur Building EUI 32 KBTU/SF/YrAverage EUI for Office 88 KBTU/SF/YrComparing our Building vs Average1. 88 KBTU/SF/Yr – 32 KBTU/SF/Yr 56 KBTU/SF/Yr2. 56 KBTU/SF divide by 88 KBTU/SF 64%Our building is performing 64% better thanthe national average office building
CSULB HISTORICAL EUISource: CSULB Clean Energy Master Plan 201835
SIMPLE ENERGY ACCOUNTINGYOU CANNOT MANAGE WHAT YOU DONOT MEASUREENERGY ACCOUNTINGIS KEY TO MANAGING ENERGYCONSUMPTION AND COST
SIMPLE ENERGY ACCOUNTING
SIMPLE ENERGY ACCOUNTINGNatural Gas Consumption Data3002502002017 Therms1502018 Therms100500JANFEBMARAPRMAYJUNJULAUGSEPOCTNOVDEC
SIMPLE ENERGY ACCOUNTINGNatural Gas Cost Tracking 180 160 140 120 100 80 60 40 20 JANFEBMARAPRMAYJUNCost 2017JULCost 2018AUGSEPOCTNOVDEC
SIMPLE ENERGY ACCOUNTINGNatural Gas Consumption and Cost Tracking2017300 180 160250 140200 120 100150 80100 60 4050 200 JANFEBMARAPRMAYJUNJULConsumption ThermsAUGSEPGas CostOCTNOVDEC
SIMPLE ENERGY ACCOUNTINGNatural Gas Usage and Heating Degree 150100505000JANFEBMARAPRMAYJUNJULAUGSEPOCTNOVDEC
SIMPLE ENERGY ACCOUNTING25000Electricity Consumption Tracking2000015000KWH 2017KWH 20181000050000JANFEBMARAPRMAYJUNJULAUGSEPOCTNOVDEC
SIMPLE ENERGY ACCOUNTINGElectricity Cost Tracking 6,000 5,000 4,000 3,000Cost 2017Cost 2018 2,000 1,000 JANFEBMARAPRMAYJUNJULAUGSEPOCTNOVDEC
SIMPLE ENERGY ACCOUNTINGElectric Demand300250200KW 2017150KW 2018100500JANFEBMARAPRMAYJUNJULAUGSEPOCTNOVDEC
SIMPLE ENERGY ACCOUNTINGElectricity Average Cost per Unit 0.30 0.25 0.20 /KWH 0.15 /KWH 0.10 0.05 JANFEBMARAPRMAYJUNJULAUGSEPOCTNOVDEC
THE ENERGY MANAGEMENT PROCESSThe Energy Star ModelMake a CommitmentBenchmark &Set GoalsRecognizeAchievementsMeasureProgressSource: Energy Star Guidelines for Energy ManagementCreate anAction PlanImplementthe Plan46
THE EM PROCESS1. Benchmark Energy StarPortfolio Manager ASHRAE BuildingEQ IndustryBenchmarks Set Baseline/Goals2. Energy Audit ASHRAE Level 1,2or 3 Rate Analysis Energy Modeling Recommendations3. Action Plan Energy EfficiencyMeasures Incentives Financing Project Plans Project Delivery
THE EM PROCESS4. ImplementAction PlanProject Portfolio Lighting HVAC Plug Loads Retro-Cx Envelope EMS Upgrade CapitalEquipment5. Verify Results Measure PostProject EnergyUse Compare toBaseline EvaluateEffectiveness Adjust/modify6. CommunicateResults Report Savings Case Study LessonsLearned Share YourSuccess Repeat
WHY BENCHMARK? Everyone needs a reference starting point:The Baseline Compare performance with others Encourages continuous improvement In some states, mandated by Law i.e. AB 802CA Benchmarking Program
ENERGY STAR PORTFOLIO MANAGER Free Online Tool Nationally Recognized Tool for CA AB802 Energy Disclosure Can lead to Energy Star designation
THE ENERGY AUDITWhat is an Energy Audit?Reference: ASHRAE ProceduresforCommercial Building EnergyAudits54
TYPES OF ENERGY AUDITS(ASHRAE GUIDELINES)LEVEL 1 – Walk Thru AuditLEVEL 2 – Energy Survey and AnalysisLEVEL 3 – Detailed Engineering, FinancialAnalysis, or Energy ModelingReference: ASHRAE Procedures for Commercial Building Energy Audits55
ENERGY AUDIT - INPUT Existing operations Energy sources, use, and cost Energy Using Equipment schedule Utility Metering Building Physical Data Weather Data56
ENERGY AUDIT – OUTPUTDELIVERABLES LEVEL 1 – Existing operations, buildingenergy utilization, no cost/low cost ECMs LEVEL 2 – Detailed energy analysis andbreakdown of energy use, savings and costanalysis of more capital intensive ECMS LEVEL 3 – Investment grade analysis formajor capital projects/ energy modelingReference: ASHRAE ProceduresforCommercial Building EnergyAudits57
FUNDAMENTALS OF EFFECTIVEENERGY MANAGEMENTPRESENTED BY:PAUL WINGCO, CEM MBAWINGCO CLEAN ENERGY RESOURCES LLCFEBRUARY 16 & 18, 2021
QUICK RECAP OF DAY 1 Energy Fundamentals The Energy Management Process Intro to Benchmarking Intro to Energy Audits
DAY 1 AGENDA Energy Efficiency/Conservation Measures Portfolio Manager 101 Financing Energy Efficiency Energy Incentives Energy Action Plan
WHAT ARE EEMS OR ECMS?EEM Energy Efficiency MeasuresECM Energy Conservation Measures
BUILDING ENERGY END USE BREAKDOWN63
ENERGY EFFICIENCY MEASURESLighting Best Practice Conduct a Lighting Audit Eliminate Fluorescent and HID Lighting Adopt an all LED Based Lighting System Select Sources 120 Lumens/Watt Install occupancy sensors and controls Use natural lightingStrategyReduce lighting power density, turn off when not in use,provide appropriate illumination level
LIGHTING POWER DENSITYThe connected lighting load measured in watts in relationto the area in square feet served by the lighting systemLPD METRIC : Watts/SFExample for General OfficeLighting LPD:Good 1.0 Watts/SFBetter 0.5 Watts/SFBest 0.3 Watts/SF(T24 2019 LPA 0.6 for open offices)Source: CA Title 24 Part 6 Building Efficiency Standards 2019
BI-LEVEL LED STAIRWELLLIGHTINGE X I S TI N G F I XTU R E WAT TS : 6 8N E W F I X TU R E WATTS : F U L L 3 5 / S TAN D B Y 1 2S AVI N G S 5 0 % / 8 2 %
BI-LEVEL LED STAIRWELLLIGHTING Integrated Controls Long Service Life 150,000 Hrs
HIGH BAY HID TO LED
HIGH BAY HID TO LEDE X I S TI N G F I X TU R E WATTS 2 9 5N E W F I X TUR E WATTS 1 1 0S AV I N G S 6 3 %Source: Acuity Lithonia Lighting
CFL TO LED DOWN LIGHTSE X I S TI N G F I X TU R E WATTS 9 1N E W F I X TUR E WATTS 4 5S AV I N G S 5 0 %
FLUORESCENT TO LED LIGHTINGWITH NEW FIXTURES OR RETROFIT KITAvailable in 2X2, 2X4 or 1X4 versionsSource: Acuity Lithonia LightingE X I S TI N G F I X TU R E WATTS 6 4N E W F I X TUR E WATTS 2 5S AV I N G S 6 0 %
BI-LEVEL LED GARAGEE X I S TI N G F I X TU R E WATTS 1 8 8N E W F I X TUR E WATTS 7 1 / 3 6S AV I N G S 6 2 % / 8 1 %
BI-LEVEL LED AREAE X I S T I N G H I D F I X T U R E W AT T S 1 7 5N E W F I X TUR E WATTS 8 6 / 4 3S AV I N G S 5 0 % / 7 5 %
GYMNASIUM HID TO LEDE X I S TI N G H I D F I X T U R E WAT T S 1 0 7 5N E W F I X TUR E WATTS 4 9 5S AV I N G S 5 4 %
NATURAL GAS EFFICIENCY MEASURESHigh Efficiency Tankless Water Heating High Efficiency (Up to 97%) Programmable Controls/Multi-Stage Reduced Standby Losses Hot Water Reset Rebates/IncentivesStrategyReplace tank type water heaters with tanklesscondensing water heaters
Energy Efficient Water HeatingTankless Modular Water HeatersBeforeSource: NavienAfter
Energy Efficient Water HeatingModular Tankless Water HeatersUp to 97% EfficientSource: CSULB Kinesiology Building Boiler Retrofit
HIGH EFFICIENCY CONDENSINGGAS BOILER25:1 Turn DownRatioUp to 95%EfficiencySource: Lochinvar
HIGH EFFICIENCY CONDENSING GASBOILERSource: Lochinvar
Energy Efficient Water HeatingHybrid Heat Pump Water Heater 4X Efficiency Improvement vs Standard Electric Water Heater
HVAC ENERGY EFFICIENCY MEASURESHVAC Best Practice High SEER AC unit Replacement Variable Speed Drives on Fans and Pumps High Efficiency (COP) Chillers High Efficiency Condensing Boilers Proactive MaintenanceStrategyIncrease equipment efficiency, demand basedcontrol, reduce envelope loss, O&M
High Efficiency Rooftop AC unitsSource: Carrier Air Conditioning84
Advance RTU FeaturesSource: US DOE85
Energy Savings Analysis SEER 8 vs SEER 17 AC UnitSource: Pacific Northwest National Lab: Comparative Cost Calculatorhttps://www.pnnl.gov/uac/86
High Efficiency Rooftop AC UnitsResourcesSource: http://www.advancedrtu.org/87
High Efficiency Whole Building ChillersOil Free CentrifugalCompressor with DC Motorand VFDUp to 50% more efficient
Match Capacity with Load using Variable Speed
WHY DO VFD’S SAVE ENERGYThe Power of the Affinity Law Flow varies proportionately with speed 80% Speed 80% Flow Pressure varies with the square of the speed 80% Speed (.80) ² .65 or 65% The HP varies by the cube of the speed 80% Speed (.80)³ .51 or 51% Reducing fan speed by 20% results in 50%savings in energy
O&M - PROACTIVE MAINTENANCEHVAC Air Filter Change-outs Reduce pressure drop Coil Cleaning (Evaporator/Condenser) Enhanced heat Exchange/reduce pressure drop Drive Belt Changes Reduce runtimes/maximizes capacity Economizer validation Optimize outside air utilization Reduce external loads Check for refrigerant leaks Controls Verification Chiller and Cooling Tower Maintenance Hot Water Boiler Combustion Analysis and Tuneups
ENERGY BENCHMARKING PART 2Energy Star Portfolio Manager 101Basic FunctionalitySource: ources/portfolio manager 101 set properties and meters generate reports
FINANCING ENERGY EFFICIENCY MEASURES Financial Benefit AnalysisPrioritize ProjectsSelect Projects for ImplementationEvaluate Financing OptionsSecure FundingReduce Project Net Cost Through Incentives
REQUEST FOR FUNDING EE PROJECTSKey elements: Project title and summary descriptionJustification statementProject BenefitsEnergy and Cost SavingsGHG Emissions ReductionsProject Cost estimateReturn on Investment (ROI)
COMMON FINANCIAL ANALYSIS FORENERGY PROJECTSThe Simple Payback Total Project CostAnnual SavingsExample: Project Cost 5000 1000 (Savings)Simple Payback 5 Years
COMMON FINANCIAL ANALYSIS FORENERGY PROJECTSRate of Return Annual SavingsProject CostExample: Project Cost 1000 (Savings) 5000 (Cost)ROI 20%
NET PRESENT VALUE ANALYSISNet Present Value (NPV) – is a more sophisticatedfinancial analysis that considers the time value ofmoney and is based on a multi-year cash flow modelNPV Requirements: Project Cost Annual Interest Rate Annual Savings Annual Cost Time Span (Life Cycle of Equipment)97
NET PRESENT VALUE USING EXCELRateInvestmentSavings Year 1Savings Year 2Savings Year 3Savings Year 4Savings Year 5Savings Year 6Savings Year 7Savings Year 8 800Savings Year 1Energy SavingsO&M SavingsO&M ExpenseTotal Savings 1 4,450500(150)4,800Net Present Value 2,165.16 NPV(B1,B2,B3,B4,B5,B6,B7,B8,B9,B10)98
THE CASH FLOW OPPORTUNITY CALCULATOR BY ENERGY t/files/buildings/tools/cfo calculator.xls99
PROJECT FINANCING OPTIONS Internal Operations Funds Capital Renewal Funds Third Party Financing, Energy Bonds Financing via Savings – Energy Performance Contracts On Bill Financing Shared Savings Model Power Purchase Agreement Energy Efficiency as a Service100
PORTFOLIO APPROACH TO ECM/EEMECMT12 to T8 LampsFan VFDExterior LED LightingAC Unit UpgradeTOTALSavings KWHSavingsTherms Lighting 10,57052350 7,329HVAC 5,3506134 859Lighting 8,1759956 1,394HVAC 12,3006200 25,1357420Renewables 75,889 137,419Window Replacement EnvelopeSolar PV CarportMeasureCostType TotalPayback(Yrs)0 - 7,3291.4738 664 1,5233.50 - 1,3945.9868735 662 1,5308.0 1,0391154 1,039 2,07712.134223 4,7910 - 4,79115.8116283 16,2802627 2,364 18,6447.4
PORTFOLIO APPROACH TO ECM/EEMWITH ngs Gas CostCostTherms SavingsSavingsT12 to T8 LampsLighting 10,57052350 7,329Fan VFDHVAC 5,3506134 Exterior LED LightingLighting 8,1759956 1,394AC Unit UpgradeHVAC 12,3006200 25,135Renewable s75,889Window Replacement EnvelopeSolar PV CarportTOTAL 137,4190 738 0 868735 7420 1,039115434223 4,7910116283859 16,2802627-SavingsTotalNetPaybackIncentives Measure(Yrs)Cost 7,329 6,282 4,2880.6664 1,523 1,105 4,2452.8 1,394 1,195 6,9805.0662 1,530 1,112 11,1897.3 1,039 2,077 1,467 23,66811.4 4,791 4,107 71,78215.0-- 2,364 18,644 15,267 122,1526.6
UTILITY ENERGY INCENTIVES Itemized and express rebate Custom rebates Savings by Design for new Construction Special technical assistance programs (Energy Audits/Retro-commissioning Services), Trade Professional Directory Turnkey No Cost Installation Demand Response and Capacity Bidding Programs103
UTILITY PROVIDEDENERGY MANAGEMENT TOOLS & INCENTIVESHow to access SDGE energy saving tools and incentives:1. Go to SDGE.com2. Click on Residential or Commercial3. Click on Savings CenterSource: ls-energy-tips104
THE ENERGY ACTION PLAN Benchmark Your Facility Perform Energy Audit (ASHRAE Level 1,2, or 3) Evaluate Recommendations Take Advantage of Technical and Financial Incentives Secure Financing for EEMs/ECMs – Funding Request Implement EEMs/ECMs Verify Results – Post Project Energy Use Recognition - Document and share your success Story105
THE ENERGY ACTION PLANACTION STEPACTIVITYRESOURCESCOSTBenchmarkPortfolio Manager forBaseline and GoalsIn-house StaffUtility/Engineering0Energy AuditPEA Level 1 and 2Utility/Engineering0 - .50/SFEnergy AuditLevel 3Utility/EngineeringvariesECMs/EEMsProject PortfolioUtility/Engineering0 - variesProject FinancingFunding Proposal/ROI/Financing ment r/EPCvariesVerificationPortfolio ManagerUpdate EU / RecognitionPortfolio ManagerEnergy Star BuildingIn-house Staff0106
ADVANCED ENERGY MANAGEMENTSTRATEGIESSEMINAR HIGHLIGHTS: Introduction to Deep Energy RetrofitsCurrent Trends in EnergyThe Strategic Energy Planning ProcessDeep Energy Retrofit ProjectsRetro-CommissioningOccupant EngagementFinancing Energy ProjectsSAVE THE DATE:May 18 & 20, 2021
SMART O & MFOR HIGH PERFORMANCE BUILDINGSSEMINAR HIGHLIGHTS: Predictive Maintenance for Building Systems Leveraging Technology in Operations andMaintenance Automated Fault Detection Software Monitoring and Diagnostic Equipment for O&M Using KPIs - Key Performance Indicators to Track andImprove Building Energy PerformanceSAVE THE DATE:Oct 19& 21, 2021
SMART BUILDING TECHNOLOGIESFOR ENERGY EFFICIENCYSeminar Highlights: Smart Building Technologies Smart Lighting Systems SAVE THE DATE:Nov 9 & 10, 2021Modern HVAC Control Systems for SmartBuildingsSmart Energy MetersBuilding Energy Dashboards andAnalyticsGrid-interactive Efficient Buildings
TAKE ACTION NOW!THANK YOU!Paul Wingco Email: Paulwingco@gmail.comSearch and connect with LinkedIn110
Energy Fundamentals The Energy Management Process Intro to Energy Benchmarking Intro to Energy Audit Energy Efficiency Best Practices Part 2 Thu 2/18/21 Portfolio Manager Benchmarking Tool Financing Energy Efficiency Measures Utility Incentives Energy Action Plan Fundamentals