Transcription
A&A 626, A112 stronomy&Astrophysicsc N. Mauron et al. 2019A catalogue of oxygen-rich pulsating giants in the Galactic haloand the Sagittarius stream?N. Mauron1 , L. P. A. Maurin2 , and T. R. Kendall3123Université de Montpellier, Laboratoire Univers et Particules de Montpellier CNRS/UM, Place Bataillon, 34095 Montpellier, Francee-mail: nicolas.mauron@umontpellier.frObservatoire des Ifs, 6 impasse des Ifs, 84000 Avignon, France18 Market Square, Northampton NN1 2DL, UKReceived 14 August 2018 / Accepted 27 March 2019ABSTRACTTo construct a catalogue of oxygen-rich (M) asymptotic giant branch (AGB) stars in the halo, complementing the catalogues ofcarbon-rich (C) stars, previous lists of Miras and SRa semi-regulars located in the northern hemisphere are merged and cleaned ofvarious defects. After putting aside known C stars, characteristics such as colours and periods indicate that most of the remainingobjects are M stars. Distances are obtained through the period-luminosity relation. By considering their position in the sky, stars lyingat Z 5 kpc are confirmed to be in majority in the Sgr tidal arms. The M stars are more numerous than C ones. Our distance scale issupported by two cool variables located in the Pal 4 globular cluster. Along the Sgr arms, there is reasonable agreement on distances ofour objects with recent RR Lyrae distances. A few stars may be as distant as 150 kpc, with possibly four at the trailing arm apocentre,and two in the A16 sub-structure, angularly close to two C stars. Ninety radial velocities are collected from Gaia and other sources.A catalogue with 417 M pulsating AGB stars is provided. This catalogue contains 260 stars in the halo with Z 5 kpc. Their K smagnitudes range from 8 up to 13. For comparison, the catalogue also provides 150 stars in the disc having 5 K s 8.Key words. Galaxy: halo – Galaxy: stellar content – stars: AGB and post-AGB1. IntroductionStars evolving on the asymptotic giant branch (AGB) can beeither oxygen-rich (M), or carbon-rich (C). The general properties of AGB stars are reasonably understood and summarised inthe book of Habing & Olofsson (2004). Much previous researchconcerning Mira variables enabled a greatly improved knowledge of the main components of the Galaxy (bulge, disc, bar,etc). For example, by considering Mira stars close to the Sun,their locations and their kinematics, Feast & Whitelock (2000)could detect the extension of the Galactic bulge bar in the solarvicinity and beyond. In a galaxy, the presence of AGB C stars isgenerally interpreted as indicating that an intermediate-age population exists. In contrast, the M AGB stars may be much oldersince one finds them in globular clusters. The goal of this work isto achieve a catalogue of the M AGB population of the Galactichalo, and we restrict this research to the Mira-type and SRa-typevariable stars. In this paper, we name these periodic stars MSRastars. Also, although this paper is devoted to M stars, we makea detailed comparison with C stars at several points to highlightdifferences and similarities.In comparison with the Galactic disc, the understanding ofAGB stars located in the halo has to be improved. A great dealof research has been carried out on C stars because their very redcolour, or their peculiar spectra makes it easier to discover them;see Huxor & Grebel (2015; hereafter HG2015) for a synthesis.However, in comparison to C stars, relatively little attention hasbeen devoted specifically to finding M stars. The fact that they?Full Table 3 is only available at the CDS via anonymous ftpto cdsarc.u-strasbg.fr (130.79.128.5) or via http://cdsarc.u-strasbg.fr/viz-bin/qcat?J/A A/626/A112can be found in globular clusters suggests that there may be sucha population in the halo, but, to our knowledge, a systematic census is missing.One of the difficulties in finding M AGB stars at high Galactic latitude is to separate them from the large amount of dwarfsin the disc. Infrared properties and/or variability may be thoughtas useful methods. One of the early studies of these M stars wasbased on the availability of the infrared IRAS data. Indeed, acomplete survey of M Miras with short or intermediate periodand with b 30 is due to Jura & Kleinman (1992), but distances to the Galactic plane (Z) are mostly less than 3 kpc. Moreprecisely, of a total of 318 objects, only 13 have Z 3 kpc.Another interesting work is that of Whitelock et al. (1994, 1995).To investigate cases of very high-mass loss AGB stars, theychoose them in the south Galactic Cap at b 30 and selectthose that have IRAS fluxes and colours. Because fluxes at 12 µmand 25 µm are needed, these sources are not very distant: theirtime-averaged magnitude is typically K 7, with Z 4 kpc.Finally, Gigoyan & Mickaelian (2012) published a list of M stars(dwarfs or giants or AGB stars) found by eye-scanning the Byurakan objective-prism plates. We have cross-matched their sample with the General Catalogue of Variable Stars (Samus et al.2017) and 85 Miras are identified. However, their K s magnitudesare less than seven because the Byurakan plates are not deep.This situation has changed with large-scale experimentssearching for variable objects over all the sky. A first catalogue ofperiodic giants based on the LINEAR experiment was publishedby Palaversa et al. (2013). It covers 10 000 square degrees andreaches rSDSS 18. A second catalogue is by Drake et al. (2009,2014), from the Catalina experiment, covering over 20 000square degrees down to V 19. In addition to yielding a numberA112, page 1 of 9Open Access article, published by EDP Sciences, under the terms of the Creative Commons Attribution License (http://creativecommons.org/licenses/by/4.0),which permits unrestricted use, distribution, and reproduction in any medium, provided the original work is properly cited.
A&A 626, A112 (2019)of new results on variable objects in general, these databasesdramatically increase the number of known MSRa out of theMilky Way plane. From their Catalina sample of 500 MSRa,Drake et al. (2014) show that some of these trace the Sgr stream.We decided to reanalyse their data for several reasons. First, weintend to build a catalogue of M stars in the halo, as a complement to the HG2015 compilation of C stars. Second, in order todetermine distances and since periods are provided, we use theK-band period-luminosity relation instead of an absolute magnitude Mv 3 adopted by Drake et al. (2014). Third, the Sgrarms have been mapped recently in detail with RR Lyr variables from the PanSTARRS data, providing accurate distances towhich those of MSRa stars can be compared (Sesar et al. 2017;Hernitschek et al. 2017). Finally, we wish to investigate the possible existence of very distant stars, at more than 70 kpc fromthe Sun.In Sect. 2, we construct a preliminary list of MSRa stars fromcatalogues mentioned above, pay attention to a variety of flawsand obtain a sample of 417 stars. In Sect. 3, we focus on theirproperties, in particular those independant of the distances: wehave examined their colours, (peak-to-peak) V-band amplitudes,periods, apparent positions and how to best attribute a pulsationmode through consideration of photometric colours. In Sect. 4,we describe and discuss the results. We also derive distancesand their uncertainties. It is found that the number of M starsin the halo from our sample is richer by a factor of 3 thanthe presently known sample of halo C stars. A few remarkablestars are discussed. Our catalogue of M stars is presented, andincludes 90 radial velocities. Finally, we give our conclusions inSect. 5.2. Building the sampleTo build a preliminary list of MSRas, first we considered thecatalogue of Drake et al. (2014). We note that this catalogue isbased on the Data Release 1 (DR1) of Catalina, and that supplementary monitoring data are provided in the DR2, which isusable on the Catalina web site. We added the MSRa stars contained in the catalogue of Palaversa et al. (2013). We also addedthe C stars, periodic or irregular, compiled by HG2015, as wellas other C stars that are warmer, but may have been missed aspulsators in previous studies. Finally, we examined stars thathad been found as contaminants in our survey for C stars. Afterchecking their light curves on the Catalina DR2 database, thosewhich were periodic were included.Because the LINEAR or Catalina coordinates have an accuracy of 300 , we cross-correlated our list with the 2MASS catalogue with a search radius of 500 . Objects lacking a 2MASScounterpart were rejected. In rare cases, it may be that morethan one 2MASS source is found. Generally, there is one brightsource and the others are much fainter. In such cases, consideration of magnitudes allows us to identify the true counterpart. However, when the choice is not obvious, the object wasdropped.This first 2MASS cross-matching procedure leads to a listof 894 entries. Further cleaning is necessary for many reasons.Numerous objects are common to Drake’s and Palaversa’s catalogues, and there are 112 duplicates in our preliminary list.These duplicates are, however, interesting as they can informus about differences in amplitudes and periods provided by thetwo databases. There are also objects presented in the LINEARor Catalina catalogues as being periodic variables, but a systematic examination of Catalina light curves shows them to beof poor quality, almost constant, or not clearly periodic. TheseA112, page 2 of 9Table 1. False very-faint 72419225413338299266277314400RX PerSX TauBZ TauXY GemRT HerV477 OphAN PegTU PegRS 0.671.251.541.53Notes. Their (J2000) coordinates are in given degrees. K s is the faint starmagnitude from 2MASS. P1 (in days) is its period from Catalina DR2.The polluting star name is indicated. P2 is its period from the GeneralCatalogue of Variable Stars. ρ is the angular separation in arcminutes.objects were rejected, as well as those that are saturated. We alsorejected objects with K s 5 in the 2MASS catalogue, becausethey are too close to us, but we keep many disc stars with typically K s 5 7, in order to be able to compare halo and discproperties.Occasionally, a periodic light curve displays a significantamplitude variation ( 30%). Although this may happen for AGBstars (see below), another possibility is that the star is a stillunknown, slowly rotating, spotted giant. In the Galactic bulge,the overwhelming majority of these variables have periods lessthan 100 days (Drake 2006). To our knowledge, no similar information exists for the thick disc or halo giant populations. Thislimit of 100 days is smaller than the periods of most of the starsstudied in this work. In these occasional cases we chose not tobe too conservative at this stage, and we kept these rare cases inour list. An additional reason for doing so is that supplementaryobservations could resolve this ambiguity. For example, spectra of red, variable members of 47 Tuc ([Fe/H] 1.5) displaystrong, variable Balmer emission lines that are explained withpulsation shocks (van Loon et al. 2007; their Fig. 21).We also interrogated Simbad at CDS and found thattwo quasars are present in our list: one is at α 26.13977δ 27.08419, and the other at α 116.99665, δ 20.87373,coordinates J2000 in degrees. As a consequence, we systematically looked for matches in the QSO-AGN catalogue ofVéron-Cetty & Véron (2010; 168 940 entries), and the SloanDR7 quasar catalogue (Schneider et al. 2010; 105 783 entries),but no supplementary cases were found.Finally, a more intricate cleaning necessity appeared whenwe focused our attention on very distant stars, possibly locatedat more than 100 kpc. We discovered that many of these faintsources (K s 12 14) with apparent periodic signals were, infact, objects polluted by bright Miras located at less than 20 awayand with identical periods. A thorough search within 50 for allour sources resulted into identifying nine cases, given in Table 1.To conclude, having achieved this cleaning procedure, 417objects remained that are not known as being carbon rich. Werefer to these 417 objects hereafter as our sample.3. AnalysisSince this paper deals with the halo MSRa population, including the Sgr arms, and because we do not have a complete kinematic information for the majority of sources in our sample, we
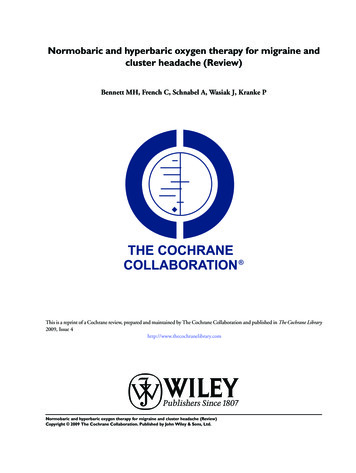
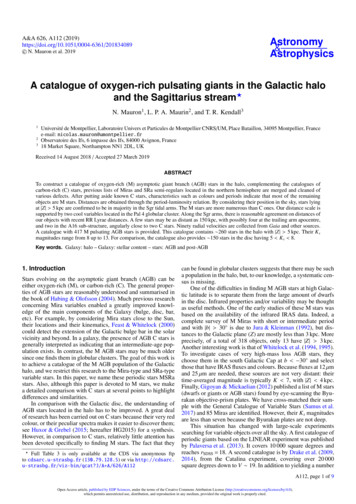
N. Mauron et al.: Oxygen-rich AGB stars in the Galactic halo and the Sgr armsFig. 1. Histogram of (J K)0 of long-period variables. Top panel: halo Cstars. Middle panel: stars in our sample for which the height Z from theGalactic plane is larger than 5 kpc. Lower panel: as middle panel, but Z 5 kpc. We do not include irregular variables, with no well-definedperiodicity (they are ignored in this paper) in any of the panels.needed to consider a quantitative limit separating halo stars andthose of the Sgr arms on one side, and a complementary groupof objects from the disc, on the other side. After some tries, wefound that a separation with the height Z (in kpc) from the Galactic plane works reasonably well, and that Z 5 kpc is a goodcompromise. The quantity Z is derived by assuming all objectsto obey the K s -band period-luminosity relation with Wesenheitindices of Soszyński et al. (2007). A more detailed discussionof the determination of distances is done in Sect. 4.1. TakingZ smaller than 5 kpc (i.e. 2 3 kpc) retains too many disc sourceswhich pollute the halo sub-sample. Adopting a height of 10 kpcis too large because, at least from the model of Law & Majewski(2010), the Sgr arms distance can be as close as 10 kpc from theSun (see also Fig. 15 of HG2015). In the following, we presentresults concerning the colours, amplitudes, periods, and locationin the sky. These are the best-determined characteristics becausethey do not involve distances.3.1. Colours, amplitude and periodsIn Fig. 1, we show three histograms of the (J K s )0 colourindex. Correction for interstellar extinction is achieved withA J 0.87 E(B V) and AK s 0.35 E(B V), from Cardelli et al.(1989), with E(B V) from Schlegel et al. (1998). The upperpanel displays C stars. Stars of our sample with Z 5 kpc and Z 5 kpc are shown in the middle and bottom panels, respectively. It can be seen that C stars are in very large majority redderthan (J K s )0 1.3, while an overwhelming proportion of ourstars at Z 5 kpc are bluer. This strongly suggests that thesebluer stars are mostly oxygen-rich. The histogram ordinates arethe number of objects per bin, and shows that the bluer sampleis considerably richer than the C star sample, by a factor of 3.The (J K s )0 colours in the lowest panel suggest that the starsof our sample with Z 5 kpc are in majority M stars, althougha few C stars may be present.Pulsation amplitudes deserve attention because they areinvolved in the uncertainty on distances. This is because distancedetermination is based on the use of K s , but the phase of thisK s measurement is ignored. Therefore we attempted to estimateFig. 2. Catalina versus LINEAR V-band amplitudes for common MSRavariables. The dotted line is a 1:1 line. The inset shows the histogram ofresiduals. The 1σ scatter is 0.21 mag.the range of variation in K s by scaling optical amplitudes to thenear-infrared. The LINEAR survey took place between 1998and 2009, while the Catalina survey DR1 covers the period2005 2011. Thus, an overlap of four years exists. Consequently,we expect that, in a first approximation, amplitudes given by thetwo experiments should agree. We note that Catalina amplitudesare derived from Fourier fits, while LINEAR amplitudes are therange of values between 5% and 95% in the signal distribution.Figure 2 displays one amplitude versus the other for commonobjects of our initial list. The agreement seems very reasonable,with σ 0.21 mag. This scatter means that some amplitudesmay change over years by at least this amount.In Fig. 1, we saw that the halo sample stars (with Z 5 kpc) are generally bluer than the halo C stars, although thereare exceptions. Here, we have investigated whether a periodamplitude diagram would bring some complementary information. Figure 3, panel a, shows that these halo stars comprise amain population with P 150 175 days, and a small population with low amplitude and longer periods. In contrast, panelb shows that the periods of C stars are more scattered overa 150 300 days interval, and do not include the large-periodlow-amplitude family. Therefore, a periodic AGB halo star withperiod P 170 days is more probably of M type than of C type.This result is supported by an ongoing program of M/C classification of several hundreds of Catalina MSRa in both hemispheres (Gigoyan, priv. comm.). This program shows that, atleast for V 16, only 3% are newly discovered C stars.3.2. Apparent positionsIn Fig. 4 (middle panel), we plot M stars verifying b 20 ,and Z 5 kpc. With these selections, the disc members nearlyvanish. Clearly, a very large number of these stars are locatedclose to the sinusoid fitted on C stars. There are many moreobjects with right ascension (RA) between 0 and 80 , but themost numerous population is in the Sgr leading arm with RAbetween 160 and 250 .3.3. Separating C and C0 pulsating sequencesThe MACHO and OGLE surveys (Alcock et al. 1997;Udalski et al. 1994) monitoring stars in the Large MagellanicA112, page 3 of 9
A&A 626, A112 (2019)Fig. 3. Catalina amplitudes plotted as a function of pulsation periodsfor MSRa in the halo. All stars plotted here have Z 5 kpc. Panel a:our sample stars obeying (J K s )0 1.3. Panel b: carbon stars. We notethe large difference of these two distributions, strongly suggesting thatmost of the stars in the upper panel are not carbon rich. All stars plottedhere have Z 5 kpc.Cloud (LMC) or the Galactic bulge have shown that MSRa starspulsate in different modes. Several period-luminosity sequencesexist, in particular the so-called sequence C for fundamentalpulsation and sequence C0 for first overtone (Wood et al. 1999;Ita et al. 2004). Here, in order to avoid confusion with C(carbon) stars, we name seq-C, seq-C0 , and seq-D the three P-Lsequences considered in this work. In the Magellanic Clouds orthe bulge, the sequence separation was made possible becauseall stars were at the same distance. In the case of stars in thehalo or in the Sgr arms, this distance is unknown and has to bedetermined. For carbon stars, HG2015 based their classificationseq-C or seq-C0 on three diagrams involving the (J K s )0colour index, periods and amplitudes. Although, as they note,the diagram log(P) versus (J K s )0 presents some difficultiesto determine this separation, they reach the conclusion that veryfew (5 of 121) are seq-C0 stars.Concerning our sample stars, none of which are known Cstars, we find that the clearest results are obtained by considering the (I K s )0 colour. We find this colour to be more efficient than (V K s )0 to separate sequences equally well for theLMC and the halo sample. Figure 5 shows the situation of LMCstars, for which sequences are known. Here, I is a time-averagedmagnitude from OGLE and K s is from the single epoch 2MASSsurvey. We draw a boundary between seq-C and seq-C0 populations. Figures 6 and 7 show the same diagrams for the stars ofA112, page 4 of 9our sample, with Z 5 kpc and Z 5 kpc, respectively. TheI-band photometry that we use is derived from the Catalina VCSSmagnitude and the 2MASS J K s colour, as explained in theAppendix.In Figs. 6 and 7, the plotted boundary lines are identical tothose of the LMC. One could object that boundaries separatingsequences might change with population characteristics, such asmetallicity. Here, we have assumed that there is no change ofthese boundaries. The metallicity of many giant stars in the Sgrarms is close to that of the LMC, where [Fe/H] 0.5 on average. More precisely, observations of the metallicity distributionin the Sgr arms can be found in Monaco et al. (2007), Chou et al.(2007), and Carlin et al. (2018), among others. The distributionpeaks at 0.75 and has a lower metallicity component. Therefore, it seemed reasonable to us to keep boundaries unchanged,although we recognise that other factors, such as star formationhistory, could play a role. Certainly, our assumption deservesadditional investigation.In Fig. 6, most of our stars are to the right of the boundary.Six objects are clearly to the left, and we assign them to sequenceC0 . The position of about 20 objects, to the right of a dotted line,suggests that they are not members of sequence C. ComparingFigs. 6 and 7 shows that the main cloud shifts to the red andlonger periods in Fig. 7. Since disc stars dominate the Z 5 kpcpopulation, one interpretation of this shift is that it arises fromthe higher metallicity of the disc as compared to the halo. InFig. 7, we consider that only five stars are separated enough fromthe boundary line to be considered as being on the sequence C0 .Three stars may lie on the D sequence.The fact that so few stars are found in sequence C0 is puzzling, in strong contrast with what is seen in the LMC. We firstnote that exactly the same fact occurs for halo carbon stars, asfound by HG2015. Additionally, the HG2015 method of separating sequences and our method are different, leading howeverto similar conclusions. HG2015 suggested that seq-C0 pulsatorshave amplitudes too small to be included in the Catalina MSRacatalogue of Drake et al. (2014). This may be true, althoughnot entirely convincing because 15% of a total of 1200 LMCseq-C0 stars have a V-band amplitude larger than 0.55 mag inthe OGLE catalogue. Such a large amplitude is relatively welldetected by Catalina, a point that remains unexplained for us.4. Results4.1. DistancesAfter having determined the pulsation sequences for stars of oursample, we can derive their distances. For that purpose, we used,as HG2015 did for C stars, the near infrared Wesenheit magnitudes W JK . We used the P W JK relations given in Table 1of Soszyński et al. (2007) for O-rich sequences labelled CO , C0Oand DO . We adopted m M 18.49 for the LMC distance (e.g.De Grijs et al. 2014).The uncertainty on distances is comprised of: (a) the measurement error of the K s 2MASS magnitude provided in the2MASS catalogue, of order 0.03 mag; (b) the relative uncertainty on the period found to be 2%, from comparing periodsgiven by LINEAR and those of Catalina, implying 0.04 mag onthe absolute magnitude; (c) the scatter of the P-L relation, i.e.σ 0.15 mag; and finally (d) the uncertainty that originates inthe single epoch character of K s . Ideally we should use a timeaveraged K s , but this quantity is lacking. This implies an uncertainty in relation with the K s -band amplitude that we estimate asexplained below.
N. Mauron et al.: Oxygen-rich AGB stars in the Galactic halo and the Sgr armsFig. 4. Apparent positions of pulsating AGB stars in equatorial coordinates. Left panel: all known C stars that are periodic and have Z 5 kpc.The sinusoid is an eye fit to the majority of these C stars. Middle panel: stars of our sample (M type) having Z 5 kpc. Right panel: stars of oursample having Z 5 kpc. Dashed lines indicate b 20 . We note that M stars are more numerous than C stars along the Sgr arms.Fig. 5. (I K s )0 colour index versus period (in days) for oxygen-richMSRa variables of the LMC. The curved line separating sequence Cand C0 is y ax2 b where x log(P) 1.2, a 2.3, b 1.45. Thevertical line corresponds to P 178 days.Fig. 6. (I K s )0 versus period (in days) for our sample stars located atmore than 5 kpc from the Galactic plane. The curved line is the same asfor LMC. Stars with an overplotted cross are attributed to sequence C0 .Stars to the right of dotted line are considered to belong to sequence D.For C stars, HG2015 exploit a correlation between the K samplitude and the (J K s )0 colour, established for dusty Miraswith that colour lying between 1.5 and 5. They use an extrapolation to the bluer colour for many C stars. Our stars are M type,and almost none are as red as that. We adopted another approachbased scaling the observed V-band amplitude V. We comparethis quantity with the difference between K s from 2MASS andK s from the DENIS survey (Epchtein et al. 1999). These surveysprovide independent data taken at two different dates. DENISand 2MASS have very similar K-band photometries: accordingto Carpenter (2001), K s (DENIS) is smaller than K s (2MASS), by 0.02 mag for the range of (J K s )0 of our stars. Therefore, weexpect that, for a given V, the K s difference can reach the K samplitude (all along this work, amplitudes mean peak-to-peakamplitudes).By cross-matching our sample with the DENIS catalogueand requesting K s 5 to avoid saturation results in 136 stars.Figure 8 shows this approach to work reasonably well. The average shift between the two photometries was found to be 0.05mag. In Fig. 8, the error bars drawn in ordinates are derivedfrom summing in quadrature the 2MASS and DENIS catalogue errors. On abcissa, the following errors, which we believereasonable, were adopted: 0.15 mag when V 2.5 mag downto 0.05 mag if V 0.3. This plot shows that K s 0.40 V.For example, when V 2 mag, Fig. 8 shows that the absolutevalue between the two K s values can reach 0.8 mag.After including the 0.2 mag error discussed in Sect. 3.1, thelast uncertainty term (called d above) can reach 0.5 (0.4( V 0.2)) mag. Typically, K s 0.1 mag for V 0.3, and K s 0.4 mag for V 2. The two last uncertainties (named c andd above) dominate, and distances are derived to within 20% orbetter.The derived distance can be large, up to 150 kpc. In Fig. 9, weplot the distances as a function of the longitude Λ̃ in the planeof the Sgr orbit. Coordinates in this plane Λ̃ and B̃ are derivedfrom Appendix A of Belokurov et al. (2014). Here, we have considered objects that have B̃ 13 . The continuous line tracesthe mean locus of RR Lyr stars as given by Hernitschek et al.(2017). The 1σ depth of the RR Lyrae location is about 4 kpcand 6 kpc for the leading and trailing arm, respectively. For theleading arm, there is reasonable agreement between RR Lyraeand M stars. For example, near Λ̃ 50 and 90 , agreement isvery good. However, for Λ̃ 60 70 , many of our M stars areslightly farther away from us. Concerning the trailing arm, theA112, page 5 of 9
A&A 626, A112 (2019)Table 2. Coordinates (J2000) from 2MASS, de-redenned 2MASS K smagnitudes, and periods (from Catalina) for MMK stars cited in -101MMK-114MMK-153MMK-154RA (deg)Dec .47729120.07031132.35449172.30163172.31129 1.53182 .0613.59142160127109224134297150130Fig. 7. Same as Fig. 6 for stars of our sample that are closer than 5 kpcfrom the Galactic plane.Fig. 8. Difference between KDENIS and K2MASS as a function of theCatalina amplitude for 136 stars of our sample obeying K2MASS 5.This diagram suggests the K-band amplitude to be around 0.4 the Vband Catalina amplitude, as indicated by dotted lines.distances are in agreement for 70% of the stars, but are larger(by up to 40%) for 30% of them. MMK-101 is at a distance suggesting it is member of a Sgr arm extension called “feature 2” inSesar et al. (2017).At Λ̃ 120 , we indicate two stars, MMK-153 andMMK-154, at distances 92 18 kpc and 98 13 kpc, respectively. Coordinates and some photometric information of starsdiscussed in the text are provided in Table 2. MMK-153 andMMK-154 belong to the globular cluster Pal 4 and were alreadyknown. According to Harris (1996, 2010 edition), this clusteris at 108 kpc, with a metallicity Fe/H 1.41. At distances of100 kpc, they represent excellent examples on which other starscan be compared. In particular, obtaining the Pal 4 distancewithin uncertainties for these two stars supports our method fordistance determinations.In the upper right corner of Fig. 9, we have labelled MMK003 and MMK-007, because they are among the most distantstars in our sample. They are angularly separated by only 5.7 .Interestingly, they are also close to two carbon stars, renamedHG3 and HG5 by HG2015. The former is at 2.6 from MMK003, and the latter is at 6.5 from MMK-007. HG2015 attributedHG3 to the A16 halo sub-structure, while this was less surefor HG5. Given uncertainties, the distances of our M stars,145 20 kpc, are in remarkable agreement with those of theA112, page 6 of 9Fig. 9. Heliocentric distance as a function of the Sgr longitude. Onlystars within 13 of the Sgr orbit plane are plotted. The continuous lineis the average position of RR Lyr variables of the Sgr arms given byHernitschek et al. (2017). The 1σ scatter of this RR Lyrae position is 5 kpc. The globular cluster Pal 4 is indicated by a triangle. Two carbonstars, HG5 and HG3, are plotted with asterisks.carbon stars, 114 15 and 140 22 kpc. The light curves of theeight more distant stars shown in Fig. 9 are given in Fig. 10. Periods are those given by the Catalina DR2 database. The two lightcurves plotted at bottom of Fig. 10 are MMK-153 and MMK154, members of Pal 4.4.2. A peculiar clumpWhen one looks at Fig. 4, middle panel, one can see that, south ofthis line, there exists a group of stars at RA 160 . This part ofthe sky is magnified in Fig. 11, where we plot M stars (circles),known C stars (filled circles), together with the two stars of pair6 of Starkenburg et al. (2009). Crosses indicate those objects
A catalogue with 417 M pulsating AGB stars is provided. This catalogue contains 260 stars in the halo with jZj 5kpc. Their K s magnitudes range from 8 up to 13. For comparison, the catalogue also provides 150 stars in the disc having 5 K s 8. Key words. Galaxy: halo - Galaxy: stellar content - stars: AGB and post-AGB 1. Introduction