Transcription
Reverb: Speculative Debugging for Web ApplicationsRavi NetravaliUCLAABSTRACTBugs are common in web pages. Unfortunately, traditional debugging primitives like breakpoints are crude tools for understanding theasynchronous, wide-area data flows that bind client-side JavaScriptcode and server-side application logic. In this paper, we describeReverb, a powerful new debugger that makes data flows explicitand queryable. Reverb provides three novel features. First, Reverbtracks precise value provenance, allowing a developer to quicklyidentify the reads and writes to JavaScript state that affected a particular variable’s value. Second, Reverb enables speculative bugfix analysis. A developer can replay a program to a certain point,change code or data in the program, and then resume the replay; Reverb uses the remaining log of nondeterministic events to influencethe post-edit replay, allowing the developer to investigate whetherthe hypothesized bug fix would have helped the original executionrun. Third, Reverb supports wide-area debugging for applicationswhose server-side components use event-driven architectures. Bytracking the data flows between clients and servers, Reverb enablesspeculative replaying of the distributed application.KEYWORDSrecord-and-replay debugging, systems debuggingACM Reference Format:Ravi Netravali and James Mickens. 2019. Reverb: Speculative Debuggingfor Web Applications. In SoCC ’19: ACM Symposium of Cloud Computingconference, Nov 20–23, 2019, Santa Cruz, CA. ACM, New York, NY, USA,16 pages. ONDebugging the client-side of a web application is hard. The DOMinterface [40], which specifies how JavaScript code interacts with therest of the browser, is sprawling and constantly accumulating newfeatures [27, 35]. Furthermore, the DOM interface is pervasivelyasynchronous and event-driven, making it challenging for developers to track causality across event handlers [26, 36, 49, 72]. As aresult, JavaScript bugs are endemic, even on popular sites that aremaintained by professional developers [57, 59].Commodity browsers include JavaScript debuggers that supportbreakpoints and watchpoints. However, fixing bugs is still hard.Breakpoints and watchpoints let developers inspect program statePermission to make digital or hard copies of all or part of this work for personal orclassroom use is granted without fee provided that copies are not made or distributedfor profit or commercial advantage and that copies bear this notice and the full citationon the first page. Copyrights for components of this work owned by others than theauthor(s) must be honored. Abstracting with credit is permitted. To copy otherwise, orrepublish, to post on servers or to redistribute to lists, requires prior specific permissionand/or a fee. Request permissions from permissions@acm.org.SoCC ’19, November 20-23, Santa Cruz, CA 2019 Copyright held by the owner/author(s). Publication rights licensed to ACM.ACM ISBN 978-1-4503-6973-2/19/11. . . 15.00https://doi.org/10.1145/3357223.3362733James MickensHarvard Universityat a moment in time; however, in an event-driven program with extensive network and GUI interactions, bug diagnosis often requirescomplex temporal reasoning to reconstruct a buggy value’s provenance across multiple asynchronous code paths. This provenancedata is not exposed by more advanced tools for replay debugging orprogram slicing (§2).In this paper, we introduce Reverb, a new debugger for webapplications. Reverb has three features which enable a fundamentallymore powerful debugging experience. First, Reverb tracks precisevalue provenance, i.e., the exact set of reads and writes (and theassociated source code lines) that produce each program value. Likea traditional replay debugger [13, 36, 62], Reverb records all ofthe nondeterministic events from a program’s execution, allowingReverb to replay a buggy execution with perfect fidelity. Unlike atraditional replay debugger, Reverb also records the deterministicvalues that are manipulated by reads and writes of page state. Usingthis extra information at replay time, Reverb enables developers toquery fine-grained data flow logs and quickly answer questions like“Did variable x influence variable y?” or “Was variable z’s valueaffected by a control flow that traversed function f()?” Reverb’slogging of both nondeterministic and deterministic events is fastenough to run in production: for the median web page in our 300page test corpus, Reverb increases page load time by only 5.5%,while producing logs that are only 45.4 KB in size.Reverb’s second unique feature is support for speculative bug fixanalysis. At replay time, Reverb allows a developer to pause theapplication being debugged, edit the code or data of the application,and then resume the replay. Post-edit, Reverb replays the remainingnondeterministic events in the log, using carefully-defined semantics (§3.3) to determine how those events should be replayed in thecontext of the edited program execution. Once the altered execution has finished replaying, Reverb identifies the control flows anddata flows which differ in the edited and original executions. Theseanalyses help developers to determine whether a hypothesized bugfix would have helped the original program execution. Speculativeedit-and-replay is unsound, in the sense that a post-edit program canmisbehave in arbitrary ways, e.g., by attempting to read an undefinedvariable. However, even without Reverb, the process of testing bugfixes is unsound. A developer typically lacks a priori knowledgeabout whether a hypothesized fix will work. The developer implements the hypothesized fix, and then runs tests and tries to determinewhether the fix actually worked; even if all of the tests pass, there isno guarantee that the fix is completely correct, since the tests maymiss corner cases. However, Reverb provides the developer with animportant new weapon: the ability to compare the data flows and thecontrol flows in the original execution and the ostensibly bug-freeexecution. As we demonstrate through case studies (§5.3), the abilityto diff program executions is a powerful debugging tool.Reverb’s third novel feature is to support wide-area debugging for applications whose server-side components use singlethreaded, event-driven architectures like Node [56], Redis [60], or
NGINX [53]. For these components, the event loop interface provides a narrow, semantically-well-defined abstraction layer at whichto log and replay the components. Thus, Reverb can use vectorclocks and a small assortment of additional tricks (§3.4) to trackwide-area causality. Reverb provides two levels of support for serverside components: Node components execute JavaScript code. Thus, Reverb can apply its client-side framework to the server-side, and track variablelevel data flows and control flows between multiple browsers andmultiple server-side Node instances. Reverb treats an event-driven (but non-JavaScript) componentlike Redis as a black box. Reverb logs and replays the componentat the level of the component’s externally-visible event interface,tracking data flows emanating from, and terminating at, serverside events.Reverb supports speculative bug fix analysis for data stores andJavaScript state on either side of the wide area. For example, adeveloper can edit the value that server-side code receives from aRedis database, and then explore how the edited value impacts theremainder of the replaying application’s execution.In summary, our contribution is the first distributed replay debugger that provides fine-grained data flow tracking and speculativebug fix analysis. Supporting this entire set of debugging capabilitieswas previously intractable, because prior debuggers operated at thewrong semantic level; Reverb’s insight is that web services usingmanaged runtimes and event-driven cross-server RPCs should be analyzed at these levels of abstraction, instead of at the level of systemcalls or hardware-level instruction traces. However, to fully leveragethis new insight, we must provide new debugging infrastructure thatprior work lacks. In particular, we introduce a new logic for reasoning about post-edit replays; this logic describes how editing anapplication component mid-replay should affect the post-edit replayof that component (§3.3) and remote ones which may see alteredoutput from the mutated component (§3.4). We also introduce newdiagnostic techniques for helping developers understand how editedreplays diverge from a program’s original executions. These techniques, which explain divergences using diffs of data flow graphsand control flow graphs (§3.2), allow Reverb to diagnose complexbugs in real web applications (§5.3). A user study confirms thatReverb is more helpful than traditional in-browser debuggers (§5.6).2BACKGROUNDHaving used the debuggers in commodity browsers [18, 21, 39], andhaving built several state-of-the-art debuggers ourselves [34, 36],we often found ourselves wanting fine-grained data flow trackingand speculative bug fix analysis. In this section, we explain whyprior debugging techniques are insufficient to realize the vision ofFigure 1.2.1 Traditional debuggersStandard debuggers focus on the abstraction of breakpoints [18, 21,39]. Debuggers like Visual Studio [37] and Eclipse [14] also allowdevelopers to edit some types of program values at a breakpoint, andthen resume the program’s live execution. Breakpoints are undoubtedly useful, but they force a human developer to guess which sourcecode locations are buggy.DOM12341111JavaScript code heapJavaScript code heapJavaScript code heapBrowserNodeBrowserClient 1DOMClient 2RedisServerFigure 1: EtherCalc [63] is a web-based, collaborative spreadsheet. Multiple users can simultaneously issue edits to the samespreadsheet, with a Node server broadcasting edits to all users,and storing the spreadsheet data in Redis. Bug #314 in EtherCalc’s issue tracker involves a GUI-based edit from client 1 thatis not reflected to client 2’s DOM. Ideally, a debugging framework could efficiently answer two questions. First, how is therelevant DOM state and JavaScript heap state from client 1being transmitted through the server-side components to theDOM and JavaScript heap of client 2? Second, given recordedstate from a buggy execution run, as well as a hypothesized bugfix that modifies code and/or data on clients or servers, wouldthe hypothesized fix remove the problematic behavior in therecorded execution?Some debuggers support watchpoints, which pause an applicationwhen a specific memory location is read or written. Watchpointseliminate the need for a developer to guess when and where a particular buggy assignment will occur. However, watchpoints do notcapture temporal data flows throughout a program. So, developersstill have to manually reconstruct reverse temporal flows to determine how the value in a buggy write was generated. Our case studies(§5.3) demonstrate that automated construction of value provenanceeliminates human-driven guess work about how program state iscreated.2.2Deterministic replayTraditional debuggers pause and inspect the state of live programs.In contrast, replay debuggers [4, 13, 15, 19, 20, 29, 31, 36, 62] firstlog the nondeterministic events in a live execution run, and thenreplay the program in a controlled environment, using the log tocarefully recreate the original order and content of nondeterministicevents. Replaying the nondeterministic events is sufficient to inducethe remaining, deterministic program behavior, so there is no needto log the values that are manipulated by deterministic reads andwrites.The ability to reliably recreate a buggy execution makes iteasier to test fault hypotheses. Replay debugging is particularlyuseful for studying heisenbugs that rarely occur and involve specific event orderings. Some replay debuggers support backwardsstepping [15, 19, 31, 62], such that a developer can set a breakpointor a watchpoint, and then move execution forwards or backwardsin time. However, even backwards-stepping debuggers force humandevelopers to manually track value provenance. Thus, root causeanalysis is still difficult.
2.3 Program slicingA program slice is a subset of program statementsthat may have influenced the values that are accessedby a specific line of source code [66, 69]. The tuple sourceCodeLine,variablesOfInterest is calledthe slicing criterion. Given a slicing criterion, a static slice isderived purely from analysis of source code [10, 12, 16, 24, 55];in contrast, a dynamic slice assumes a set of concrete values (e.g.,at the slicing criterion) to narrow the set of potentially relevantprogram statements [1, 2, 23, 30, 66].Slicing algorithms lack a complete, concrete log of the reads andwrites made during a real execution; thus, slicing algorithms areoften imprecise, particularly for complex programs. Imprecisionhurts the use of slices for bug diagnosis, since developers mustconsider source code lines that may not be causally related to the bug.Imprecision compounds itself if slices are used to reconstruct widearea execution behavior. In contrast, Reverb provides guaranteedprecise, provenance-annotated execution traces (§3.2). Similar toan instruction trace, a Reverb trace provides a temporal log of thesource code statements that a program executed; however, the tracesalso describe the values that the executed statements manipulated,and the provenance of those values. For additional discussion ofprogram slicing, the interested reader can peruse Section A.4 in thetechnical report [5].2.4 Data ProvenanceProvenance-aware file systems [48, 61] allow users to determinewhich input files were read by a process during the production ofoutput files. Reverb deals with the provenance of application stateat the granularity of individual program variables that reside onclients and servers. Thus, Reverb tracks how storage data spreadsthroughout an application, but does so at the level of fine-grained,variable-level flows.Provenance-aware network platforms let operators discover theroute that a packet took [74], or the reason why network switcheshave certain NDlog rules [70, 71, 73]. Reverb is agnostic aboutnetwork-level configuration state, but is compatible with systemsthat track it.2.5 Speculative edit-and-continueDora [67] is a single-machine replay debugger that records the OSlevel interactions that belong to a group of processes. Dora allows forlimited types of edits to occur during replay. If an edit causes a replayto diverge, Dora explores multiple execution paths that are rooted atthis initial divergence. Dora executes each post-divergence path on alive machine, recording the subsequent (and nondeterministic) OSlevel interactions. Like Reverb, Dora defines policies for handlingnew calls to timekeeping functions or socket interfaces. After Dorahas explored several potential futures of the divergent replay, Doraidentifies the most plausible divergent execution using a metric akinto string edit distance, comparing the system calls of each exploredpath to those of the original execution.Dora’s speculative power is highly restricted by two factors. First,Dora’s vantage point is at the OS layer. In contrast, Reverb’s vantagepoint is within the managed runtime of a JavaScript engine, or at theevent loop interface of a single-threaded program like Redis. Thisdifference is fundamental, and represents a key insight of Reverb: byJavaScript codeWeb pageHTMLCSSJavaScriptcodeLog of deterministicreads and writesReverbJavaScriptengineNode serverJavaScriptengineLog ofnondeterministiceventsRequests responses vector clocksHTTP response vector clockReverbLog ofnondeterministiceventsHTTP request vector clockLog of deterministicreads and writesReverbWeb browserRequests responses vector clocksEventloopLog ofnondeterministiceventsBlack boxserver componentFigure 2: An overview of Reverb’s architecture. Grey components are added by Reverb.introspecting on program execution at a higher level of abstraction,Reverb can handle a wider variety of speculative edits, because theside effects of an edit can be reasoned about with respect to a constrained set of events, instead of the much wider and messier POSIXinterface. For example, Dora cannot handle edits which modifythread scheduling, e.g., to cause fewer threads to run, because Doracannot enumerate and model the ensuing avalanche of side effectsupon low-level POSIX state like pthread locks and shared memorypages. In contrast, Reverb can handle a schedule-altering edit thatchanges the number of client-side frames (the JavaScript equivalent of processes). Reverb can tractably reason about such changesbecause frames cannot share raw memory, are internally singlethreaded, and only communicate via pass-by-value postMessageevents. Thus, the only way that a newly created frame can impactanother frame is via the generation of new postMessage events.Dora’s second restriction is that it does not track individual readsand writes to raw memory, because doing so would be too expensive [50]. Thus, Dora cannot provide variable-level value provenance; another consequence is that Dora may incorrectly replaypost-edit memory accesses if the edit changes which memory pagecontains an object. In contrast, Reverb introspects at the JavaScriptlevel, allowing Reverb to efficiently track all reads and writes toapplication-visible state. This difference is fundamental. Logging allreads and writes enables wide-area causality tracking, and is criticalfor explaining divergences between a logged program run and aspeculatively-edited replay (§3.3).3 DESIGNFigure 2 provides an overview of Reverb’s design. A web application has multiple clients and servers. Clients are assumed to bestandard web browsers which execute JavaScript. Both server-sideand client-side components are assumed to be single-threaded andevent-driven. Each component records its nondeterministic events;if a component uses a JavaScript engine, then the component alsorecords its deterministic reads and writes to JavaScript state and theDOM (§3.2). Distributed causality between hosts, e.g., via HTTP requests, is tracked using vector clocks (§3.4). At debug time, Reverbuses the global event log to replay each client or server in isolation,or together as a single logical application (§3.3 and §3.4).
3.1 Overview of the JavaScript Execution ModelExecution environment: JavaScript exposes a single threaded,event-driven programming interface. A JavaScript file defines initialization code that runs once, at the time that the file is parsed by theJavaScript engine. The initialization code registers event handlersthat the JavaScript engine will fire in response to GUI interactions,timer expirations, network activity, and so on. Once a browser hasevaluated all of the JavaScript files in a page’s HTML, the subsequent execution of the page is driven solely by the reception ofasynchronous events.An event handler often calls other functions. Thus, firing a handlercan initiate a call chain that is rooted by the handler. A programcan register multiple handlers for a single event type. Thus, the callchain for an event is the union of the call chains for the associatedevent handlers. In the rest of this paper, the unadorned term “callchain” refers to the aggregate call chain for a particular event.Sources of Nondeterminism: In a JavaScript program, the primarysource of nondeterminism is the order in which events arrive (andthe content of those events) [36]. JavaScript code may also invoke a small number of nondeterministic functions. For example,Math.random() returns a random number. Date() returns thecurrent time with millisecond granularity.By default, a JavaScript program consists of a single event loop.However, a web page can incorporate multiple frames [42] or webworkers [25]; each one represents a new event loop that runs inparallel with the others [38]. Concurrent execution contexts canonly interact with each other via the asynchronous, pass-by-valuepostMessage() interface [44]. The browser delivers those messages by firing an event in the recipient’s execution context. Thus,from the perspective of the recipient, handling message nondeterminism is no different than handling other event-driven nondeterminismlike GUI interactions.Externalizing Output: A JavaScript program can externalize threetypes of output: The DOM interface [40] lets a program update the visual contentthat users see. The DOM interface defines methods for dynamically manipulating a page’s HTML structure, e.g., by adding newHTML tags, or by changing the CSS styles of preexisting tags. A JavaScript program can also write to local storage. Cookies [41]can store up to 4 KB of data, whereas IndexedDB [43] and thelocalStorage interface [45] can hold MBs of information. To send network data, a program uses theXMLHttpRequest [47] and WebSocket [46] interfaces.XMLHttpRequest is an older interface which only supportsrequest/response interactions. WebSocket supports full-duplexstreams.In this paper, we ignore multimedia objects like video streams,since we focus on the debugging of pure HTML, CSS, and JavaScriptstate.3.2 Analyzing Value ProvenanceTo track data flows, Reverb first logs nondeterministic and deterministic events. After reconstructing data flows, Reverb uses themto support flow queries, and express state divergences caused byspeculative edit-and-continue.Logging Nondeterminism: Prior work has explored various waysto deterministically replay client-side JavaScript code [8, 36]. OurReverb prototype rewrites JavaScript source code to interpose onnondeterministic sources (§4), but Reverb’s design makes no deepassumptions about how nondeterminism is logged or replayed.A Reverb log has an entry for each nondeterministic event; eachlog entry contains event-specific data that is sufficient for recreating that event. For example, the log entry for a timer firing contains a reference to the timer callback. The log entry for a call toMath.random() contains the return value of the function. Thelog entry for a mouse click stores which mouse button was clicked,the x and y coordinates for the click, and so on.At the beginning of logging, Reverb takes a snapshot of theclient’s local storage (e.g., cookies). Reverb also registers its ownhandlers for GUI events like mouse clicks. So, if the logged application only installs handlers for (say) keypress, but not keydownor keyup, Reverb will still log when the latter two kinds of eventsoccur. This information is useful for handling speculative edits whichadd new GUI handlers (§3.3).Logging Deterministic Reads and Writes: In JavaScript, each object is essentially a mutable dictionary, with string keys (i.e., propertynames) mapping to property values. The global namespace is reifiedvia the special window object, such that references to a global variable x are implicitly translated to window.x. Abstractly speaking,Reverb logs reads and writes to the JavaScript heap by shimmingthe getters and setters for each object dictionary (including the onethat belongs to window). Our Reverb prototype uses JavaScriptrewriting to inject this shim code (§4).Reconstructing Data Flows: Using the log of deterministic readsand writes, Reverb can reconstruct the provenance of all JavaScriptvariable values at any moment in a program’s execution. Given aslicing criterion which mentions variable x at time t, Reverb findsthe prior write for which x was the left-hand side. For the variableson the right-hand side, Reverb finds the prior write which assignedto those variables. Reverb continues this recursive process untilreaching the beginning of the program; the traced path representsthe provenance for the slicing criterion. Note that the path may be atree, not a line, because a single assignment may involve multipleright-hand sides (e.g., x y z). The path may also cross the eventhandlers that belong to multiple high-level events like key presses orthe arrival of network data.Reverb’s log associates each deterministic read or write with asource code line. Thus, Reverb can also generate source-code-levelexecution traces which provide a serial history of each source codeline that a program ran. The core visualization tool that Reverbprovides to developers is an execution trace that is overlaid withprovenance information: each variable mentioned in each sourcecode line is associated with the prior source code line which generated the variable’s value. Figure 7 depicts an example of such a trace,and the extended technical report [5] (§A.3) describes some of thepruning techniques which improve the comprehensibility of traces.For now, we merely explain a developer-guided pruning approachthat is simple, and important in practice: targeted dynamic tracing.A targeted dynamic trace lets a developer drill down on the executedsource code lines (and associated data flows) that affected a specificvariable. As the developer explores the initial trace, the developer can
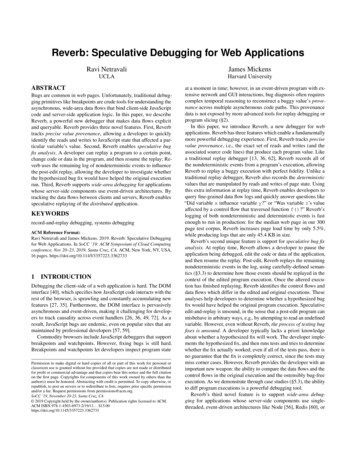
var(x( ({count:(0};(var(y( (x;(y.count ;(OBJ 0 x {count:(0}({count:(0}({count:(1}({count:(1}(y y.count {count:(0}(0({count:(1}(1(Figure 3: To capture aliasing relationships, Reverb distinguishes between an underlying object and its multiple names.Writes to an aliased object create horizontal arrows in dataflow diagrams, since time flows downward and the aliases areupdated simultaneously.add or remove target variables, expanding or shrinking the targetedtrace. Our case studies (§5.3) show that targeted dynamic traces arefast to generate, and provide helpful diagnostic information.Reverb uses Scout-style dependency analysis [51] to track dataflows between the JavaScript heap and the DOM. For example, theDOM tree is a data structure which mirrors a page’s dynamic HTMLtree; each HTML tag has an associated DOM node that is exposed toJavaScript code. Reverb understands the semantics of DOM methodslike Node.appendChild(newChild). Thus, Reverb can trackhow JavaScript values flow to DOM nodes, and how DOM valuesare assigned to JavaScript variables.Reverb’s logs capture a variety of additional behavior. For example, Reverb explicitly tracks aliasing relationships, as shown inFigure 3. Also, for each executed branch, Reverb records the associated source code line, and the values consumed by the branchtest. This information allows Reverb to apply classical algorithmsfor building dynamic control flow dependencies [30]. Reverb easilyhandles the special case of execution flows that span try/catchblocks, since Reverb records both the exception-throwing line, andthe catching line.3.3 Speculative Edit-and-Continue DebuggingSpeculative edit-and-continue debugging has five phases: logging the events in a baseline execution run; replaying the execution up to a specified point; changing the program’s state in some way; resuming execution, with nondeterminism from the original run“influencing” the post-edit execution; and comparing the behavior of the original and altered runs to understand the effects of the speculative fix.The nondeterministic input vectors for a JavaScript program arewell-known and (compared to POSIX) very small in number [36].However, defining post-edit replay semantics was previously an unsolved problem. Below, we define those semantics, describing howto execute post-edit code under the guidance of a log whose nondeterministic values may not cleanly apply to the post-edit execution.These post-edit replay semantics are an important contribution ofthe paper.Inside the call chain that contains the edit: Once we have replayed execution to the edit point and modified the necessary state,we resume the call chain’s execution. Post-edit, the chain may explore different branches than were visited in the original run. Thus,the chain may issue fewer or additional calls to nondeterministicfunctions like Date(). If the post-edit code makes fewer calls to a nondeterministicfunction f , we simply extract return values for f from the log,replaying the same nondeterminism that the original run experienced. Once the call chain finishes, and we must replay the nextevent’s call chain, we replay f ’s values from the log, startingwith the value that was first seen by the original execution of thecall chain for the new event. For example, suppose that, duringthe original program execution, two events fired; the first callchain consumed random numbers r 0 . . . r 4 , and the second chainconsumed r 5 . . . r 9 . Suppose that the first call chain is edited, suchthat it only makes two calls to Math.random(). When the second call chain executes in the post-edit run, Math.random()will return r 5 , then r 6 , and so on, since these are the randomnumbers that the second call chain saw during its original run. If the post-edit code generates more calls to a nondeterministicfunction than seen at logging time, we use a function-specificextrapolation technique to generate additional values once the callchain has exhausted the values that are associated with it in thelog. For Math.random(), we simply generate new randomnumbers. For time-related functions like Date(), we returnmonotonically increasing time values that are smaller than thenext logged time value. Once the call chain finishes and wetrigger the call chain for a new event, we return to using the logto provide values for nondeterministic functions.Post-edit code may also generate new externalized output. For example, an edited value may be written to local storage, or sent over thenetwork via the query string of an XMLHttpRequest. Post-editcode may also modify event handler state in ways that cause feweror additional events to fire in the future. For example, post-edit codemay register timers that were never created in the original run; postedit code may also deregister timers that fired in the original run.Post-edit code may also generate entirely new network requests, orregister/deregister handlers for GUI events. Below, we discuss howto incorporate
enough to run in production: for the median web page in our 300 page test corpus, Reverb increases page load time by only 5.5%, while producing logs that are only 45.4 KB in size. Reverb's second unique feature is support for speculative bug fix analysis. At replay time, Reverb allows a developer to pause the