Transcription
Software Delivery Performance KPIsin AutomotivebyRainer Dammers, ETASSergej Weber, Kugler Maag Ciewww.etas.com
Page 2 of 8IntroductionMeasuring performance in software delivery is difficult. This isin parts because, unlike manufacturing, inventory is invisible andsoftware development produces unique artifacts [1]. Also, insoftware engineering, the sequence of work does not follow thesame linearity as that of a production line: design and deliveryactivities – especially in Agile software development – happensimultaneously.Essentially, these four adapted KPIs [5] suggest a link betweenorganizational performance and software delivery performancein the embedded industry:To steer the delivery process in the right direction, businessesselling software products collect a growing number of metrics –the more the merrier. Metrics are so called lagging indicatorswhich measure outcomes and results [2]. While metrics appearinformative, they may not matter intrinsically. Their purpose isto support Key Performance Indicators (KPIs). KPIs in turn support the overall business strategic goals and objectives [3]. KPIsare useful only if they are designed to answer business questions, such as »How efficient does my organization operate?«,»Will we deliver to our commitment?« or »How quickly/flexiblecan my organization adapt to changing market demand and/orsatisfy customer needs?« After all, Peter Drucker taught us that»The most serious mistakes are not being made as a result ofwrong answers. The truly dangerous thing is asking the wrongques-tions.«– Change Fail Rate (CFR)The problem is, organizations can measure almost anything, butthey cannot pay attention to everything. Thus, modern softwareorganizations will focus on KPIs that support their specific business goals the best, allowing them to use those performanceindicators as an effective tool for continuous learning and improvement. The goal should be to gather feedback continuouslyto adapt to an everchanging market as quickly as possible. Forthis, an efficient delivery pipeline is a prerequisite [4].As soon as organizations have defined their software deliveryperformance in a measurable way, they can make evidence–based decisions about how to improve the performance of thedelivery process of their software-based products and services.Furthermore, they can compare and benchmark teams againstthe larger organizations and against the industry as a whole.So, the big question: Which KPIs are most suitable for measuringsoftware delivery performance?While a review of the literature of the recent years reveals aplethora of different KPIs quantify and qualify software deliveryperformance, in this whitepaper we focus on the KPIs proveneffective in a multi-year research published in the seminal book»Accelerate« by Forsgren et al. and apply them to embeddeddevelopment.– Overall Lead Time– Deployment Frequency / Delivery Frequency– Mean Time To Recover / Mean Time To Repair (MTTR)After a quick note about KPIs, we will discuss the three highleveltypes of product classes and the four adapted Software DeliveryKPIs, provide guidance on how to work with these KPIs and endthis whitepaper reviewing a use case from ETAS, a German company and subsidiary of the Bosch Group which designs solutionsand tools for the development of embedded systems for automotive and other sectors of the embedded industry.A Quick Note About KPIsSoftware development efficiency or productivity can be definedas the ratio between the value of the software produced andthe effort required to develop it. The measurement of softwaredevelopment productivity or efficiency to date is a story of failureand unintended consequences. While a plethora of technical metrics are collected and presented on a regular basis, very oftenthey measure output rather than outcome [1]:– Counting lines of code incentives bloat in the software delivered instead of measuring actual productivity or efficiency; thismetric is largely discarded as it punishes simplification, refactoring, and reduction of technical debt.– Capturing developer utilization incentivizes looking busy overmaximizing value, actively damages innovation potential andprevents Flow as it causes bottlenecks in the overall value chain.– Measuring and comparing Story Points misused a powerfulplanning tool for a metric which then incentivizes inflationof estimates, dilutes planning, and eliminates the value of itsintention.A KPI is a metric, but not every metric is automatically a KPI.While metrics provide raw information about outcomes and results without any context, KPIs are selected to indicate a trendrelated to a particular concern and can be considered as leadingindicators, which originated in economics, where they are definedas a measurable factor that changes before the economy followsa trend. While leading indicators suggest that conditions are favorable for a particular outcome, there is no guarantee [2].
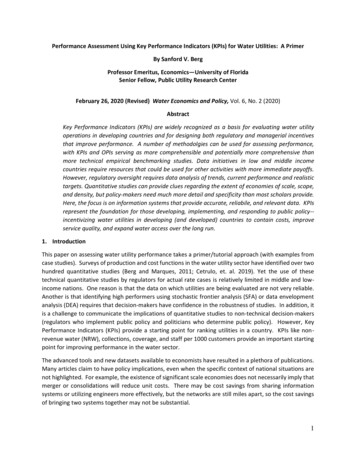
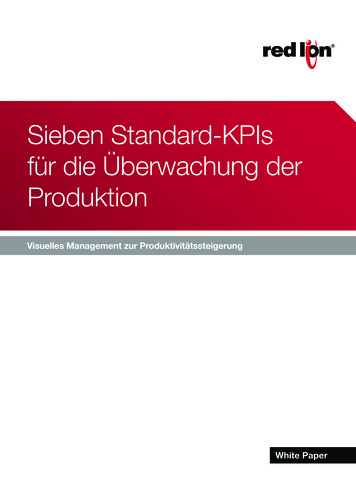
Page 3 of 8Product Classes and Software Delivery KPIsSoftware can be delivered in different ways depending on itsbusiness model and the way the software solution is consumedby users. Here, we differentiate between three high-level typesof product classes:1. Off-the-shelf (OTS) products are brought to customersprepacked and operated by themselves. A common exampleof an OTS product would be Microsoft Office, where the enduser receives the software preinstalled on a new PersonalComputer (PC) and/or installs software versions from a data carrier or download image and is solely responsible for configurationand operation of the product. Since almost all devices are connected to the internet nowadays, this product class includesalso embedded software which initially is delivered as onepackage with any device or Electronic Control Unit (ECU) butcan now be updated over-the-air (OTA) or by local service asrequired with new and enhanced version(s) of the software.2. Off-the-shelf with customization (OTS custom software)products are products which require customer-specific additionsor modifications to provide any value to a customer. A typicalexample for this kind or product would be SAP which is highlycustomized in every installation.3. Software as a Service (SaaS) is a delivery model of IT utility where customers obtain the subscription for a softwareservice without any form of physical delivery. In this case, thefull control and responsibility of the operations stay with theSaaS provider. Typical examples of this model are Salesforce,Microsoft Azure, and Amazon Web Services (AWS).As depicted in Fig. 1, Overall Lead Time is the sum of the leadtimes of the exploration phase, the execution/implementationphase, and the delivery/deployment phase. Those phases againare comprised of multiple process steps with their own leadtimes. For instance, the implementation phase includes featuredevelopment and feature completion.Overall Lead TimeExplorationExecution / ImplementationDelivery / DeploymentFeaturecapturedin e.g. an eploymentFeature foractive use @customerOrganizational boundariesdependent on product classOTSLead Time measurable within organizational boundsOTS Custom SWwith integration supportSaaSEnd point depends on product classFig. 1: Overall Lead Time variationsAs software development produces unique artifacts, the OverallLead Time will always vary. In fact, a lead time is not a discretenumber, it is a probability distribution. Providing a median regarding delivery performance is not enough. At least two valuesare important to communicate: the median lead time and a highpercentile value. As illustrated in the fictional example in Fig. 2, ittakes 20 days for a work item to be delivered on average. Here,the probability to deliver within 18 days is 85%, the probabilityto deliver within 27 days is 98%. The median value is a deliveryof 12 days.100100The following KPIs are adapted to the embedded industry toreflect the efficiency of the entire end-to-end value chain of aproduct, solution or other artifact that generates revenue.9090Median80807070Lead Time expectation of18 days with 85% probability6060Average5050Overall Lead TimeIn general terms, lead time is defined as the time it takes fromthe end of a previous step of any process until the current processstep is completed: Lead Time Delay Time from Last Step Process/Cycle Time of the current step. Therefore, Overall LeadTime can be calculated by adding up the lead times for the process steps of which it is comprised.Overall Lead Time is defined by the time it takes for an elementthat provides business value to a customer, e.g., a feature tomove through the value chain – from the earliest point of capturing the business hypothesis or market requirement to the pointof being:– delivered to a repository or download server from which itcan be released to a customer in the case of an OTS softwareproduct,– deployed directly to production environment in case of a SaaSsolution.4040Lead Time expectation of27 days with 98% probability3030202010100010 11 12 13 14 15 16 17 18 19 20 21 22 23 24 25 26 27 28 29 30 31 32 33 34 35 36 37 38 39 40 41 42 43 44 45 46 47 48 49 5011 22 33 44 55 66 77 88 99 35363738394041424344454647484950Lead Time [in days]Fig. 2: Lead Time as probability distribution (fictional example)Deployment Frequency / Delivery FrequencySince value is only tangible for the end users when they get touse the item of value, releasing that value at the right point intime is business critical. Deciding when and what to release is acritical economic factor that must be carefully considered. Moretypically for SaaS solutions, new functionality can be released assoon as it reaches a certain product maturity. More often, releasing is a decoupled, on-demand activity that occurs for specificusers at the time they need the functionality or when it makesthe most economic sense for the organization.
Page 4 of 8Deployment Frequency and Delivery Frequency are very relatedconcepts and generally describe the frequency of how often anitem provides business value to the customer. For instance, afeature completes the full value chain (as shown in Fig. 1) when:– Delivery Frequency describes how often an item of value ismade available on a delivery system, such as a repository ordownload server, from which it can be released anytime basedon a business decision.– Deployment Frequency describes how often an item of value isprovisioned into the production environment.High delivery frequency enables companies to respond to market opportunities with the highest-value solutions within theshortest sustainable lead times, thereby outperforming directcompetition. In addition, receiving feedback quickly on small,incremental value deliveries enables continuous validation ofbusiness hypotheses and the transparency to pivot quickly if achange in direction is required, saving time and costs.To support release-on-demand capabilities of a business, features must be developed, verified, and stored in a productionready state ready for the organization to release them to thecustomers. Early, built-in quality measures avoid late, costlydelays caused by problem resolution or late refactoring.Mean Time To Recover / Mean Time To Repair(MTTR)To gather meaningful metrics for the MTTR of Off-The-Shelfproducts, the two dimensions of recover and repair not only needto be considered individually but also combined as necessary:– Time To Recover is the time it takes to recover a defective product or service for the customer without modifying the productor service.– Example SaaS: Infrastructure failure fixed; workaround found– Example OTS: Workaround found and verified by customer– Example OTS: Customer supported successfully with anintegration question– Time To Repair is the time it takes to fix a broken product orservice with a new delivery after a defect was found. Essentially, Time to Repair is identical to Overall Lead Time with aspecific filter for critical issues only. Different cases apply:– A recovery needs to be followed up with a proper fix (recoveracceptable temporarily)– A recovery can only be provided with a (defect) fixThe difference between Time To Recover and Time To Repair isthat in the latter case, a delivered item of value must be pulledback into the feature development stage of the pipeline and anew delivery has to be made to fix the problem.In embedded software, Time To Repair is far more common assoftware fixes/updates are required to resolve issues. Thesesoftware updates are often delivered via an update during aservice interval or via over-the-air (OTA).Change Fail Rate (CFR)Some changes to production or releases to end users result indegradation of the product or service and subsequently requireremediation i.e., a hotfix, rollback, fix forward, or patch. TheChange Fail Rate is a metric that relates the number of failedchanges to the total number of changes:CFR Number of failed changes / Number of changesThe focus of the metric is to cover critical defects that impactthe end user e.g., product not usable, bad end-user rating, or lessturnover. However, the metric does not apply to cosmetic issueswith little customer disturbance.An issue classification model could be used to categorize theseverity of issues as only severe issues are considered valid.There may also be severe issues that are raised by the customerbut are not valid, e.g., use of an incorrect configuration or simplymisuse of the software. The product responsible has to sort outissues that are not valid based on the business model.As described further above, SaaS software is typically deployed,whereas OTS is typically delivered. Therefore, we propose a refinement for the aforementioned formula below:Software as a Service (SaaS)In a SaaS context, the number of failed changes equals thenumber of incidents related to a change in a given period of timethat either result in degraded service or subsequently requireremediation e.g., lead to service impairment or outage, require ahotfix, a rollback, a fix-forward, or a patch. Changes on the otherhand are modifications to production including e.g., softwareeleases, and infrastructure configuration changes.One possible approximation to a Change Fail Rate in SaaS context is:CFR Number of failed changes / Number of deploymentsWhereas the number of deployments refers to DeploymentFrequency.Off-the-shelf (OTS)In OTS software development, a failed delivery is a softwareversion that has a major impact on the end user e.g., the software is not usable. Here, the Change Fail is determined as:CFR Number of failed deliveries / number of deliveriesWhereas the number of deliveries refers to Delivery Frequency.If a change is a failure or fail is highly dependent on the projectcontext and needs to be defined by the product responsible.
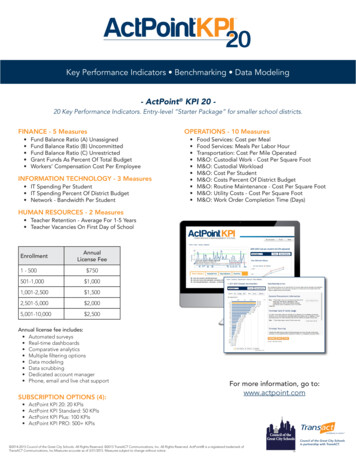
Page 5 of 8Examples for failures or fails (depends on the concrete project)are:– Recall campaign– Infrastructure dependency missed– Product not useable by customerGuidelines For Working with Software DeliveryKPIsPrinciples [6] to promote transparency and continuous improvement of the end-to-end value chain are:– Link KPIs to business goals: When developing business goals,management must involve teams in setting those goals andselect KPIs that align with and measure progress toward thosegoals. Focus on outcomes, not outputs.– Track trends, not numbers: A single data point is not significant, the trend is. Trends show how process changes affectprogress toward business goals. Make sure teams are notpitted against each other by comparing team metrics.– Establish shorter measurement periods: By breaking measurement periods into smaller time periods, teams can review KPIsand trend lines to determine how well they are progressing andidentify opportunities for improvement.– Stop using KPIs that do not drive change: Management andteams need to work on KPIs that drive progress toward businessgoals and provide verifiable, consistent indicators of progress.If a KPI does not provide a valid indicator, there is only wasteand no value in pursuing it further.How to improve KPI trendsUsually, software organizations have delivery pipelines. Thosepipelines often contain manually performed, slow process stepswith significant delays (e.g., handoffs between teams), and require lengthy and error-prone human intervention. This in turn,leads to delaying deliveries, therein increasing their size andscope to avoid integration pain. This approach is the oppositeof Lean, which promotes limiting work in progress (WIP) andreducing batch size to optimize Flow and increase the deliveryfrequency.identify opportunities for improvement, such as eliminating delays or reducing rework. When systems are first mapped, it iscommon to not have clear metrics for all steps immediately.Filling in those gaps is already a valuable finding and improvement. The second step is to continuously monitor this mappingthrough appropriate metrics.Four granular metrics are used for providing transparency on KPIsalong the mapped value flow:1. Lead time for each process is the sum of Delay Time from thecompletion of the previous step and Process Time of the currentstep. The lead time of each step in the pipeline adds up to theOverall Lead Time of value flowing through the delivery pipeline.2. Process Time is the time required to complete the work in onestep of the delivery pipeline. Very long Process Time(s) can bean indicator for work not broken out modularly enough, i.e., sufficiently small work items. If this is the case, a correlation withpoor Percent Complete and Accurate (%C&A) and overall poorDelivery Frequency is likely as work may be planned too monolithically.3. Delay Time is the time when no work is taking place. An example of this is when work to be accepted by the Product Manageris significantly delayed because he/she is a bottleneck or notavailable. Understanding and eliminating unnecessary delays iscritical to improving value flow.4. Percent Complete and Accurate (%C&A) represents the percentage of work that the next step can process without rework.One can think of it as the reverse of Fail Rate for a particularprocess step. Often, delays are caused by poor quality in upstream steps. The %C&A metric helps identify the steps wherepoor quality occurs and causes longer lead times, resulting indelays in value delivery and in the cases of defects a longer Timeto Repair. Improving the %C&A metric is also essential to improving value flow and therefore Overall Lead Time or Time to Repair.Fail Rate25%BacklogProcess Time/Delay TimeDesign60 days1 day40%BacklogWhile KPIs provide transparency of the overall flow of value anddelivery performance, they do not always have clear-cut answersor actionable tips that will seal an organization‘s success. Toimprove their performance, teams need more granular metrics.These metrics should enable deriving concrete actions to improve value flow and drive the overarching paradigm of frequentdeliveries or deployments at high quality.In best case, those granular metrics continuously monitor thestate of the delivery pipeline. The first step in improving valueflow is to map the current pipeline [7] to understand delays and10 days1 day10 days3 days20%Test1 day2 days0%20%System testing8 days20%CodeRelease20 days1 day2 daysOverallProcess Time: 10 daysOverall Lead Time: 119 daysIncluding rework: 138 daysFig. 3: Effect on Overall Lead Time in case of not accurate-and-complete overmultiple steps on the process pipeline (fictional example)Taken together, these granular metrics provide a detailed breakdown for velocity and quality at each step in the delivery pipeline.Detailed monitoring of the value flow shows which measuresare best used to reduce the Overall Lead Time and Mean TimeTo Repair (MTTR), as well as to increase Deployment Frequency/ Delivery Frequency. Often, the most important factor is Delay
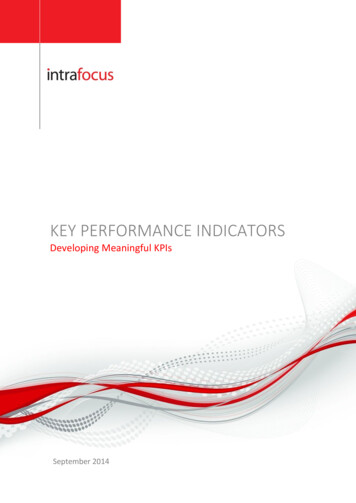
Page 6 of 8ETAS Use CaseThe engineering organization of ETAS thrives to be among theleaders in the industry with regards to development and automation practices. ETAS operates in an agile culture following theScaled Agile Framework (SAFe) and applies a continuous improvement mentality [8].Software engineering occurs organized in Agile Release Trainsand is planned in quarterly Program Increments. In preparationof the Program Increment planning sessions, Product Managers& Product Owners prioritize and refine the Solution Backlog.Since adopting Scrum almost a decade ago, the ETAS development teams have continuously improved their delivery pipelineto be able to deliver incremental value weekly or daily dependingon the product. Based on market demand and the ability of ourcustomers to consume releases, ETAS releases new versions tothe market on a fixed cadence of 3 months for most products.For ETAS’ Off-the-Shelf (OTS) software products, this is typicallythe step when the binaries are placed in an artifact repository oronto a download server. For complex systems including hardware,some long running and expensive final validation steps are performed on demand only whenever a release is planned. Technically, validation steps have to be performed before the productcan be delivered. As some long-running and expensive final validation steps are more closely linked to the release decision, theyare excluded from the measurement of Overall Lead Time.As can be seen in the example in Fig. 4, measurement of OverallLead Time is comprised of the lead times of the process stepsinvolved has made transparent that in many cases the timeconsumed in the exploration or preparation phases of any newfeature is significantly higher than the time required for implementation and verification. Such insight has helped to shift thefocus to the appropriate steps in the value chain to analyzepotential for efficiency gains leading to a steady reduction inthe Overall Lead Time.200Median of »In Verification«150Median of »Implemented«DurationTime. Reducing Delay Time is usually the most effective way toreduce Overall Lead Time and/or increase Delivery Frequency.Another high-priority area for improvement is any step with low%C&A metrics, as reducing rework allows teams to focus onadding value to the product or service. Subsequent improvementopportunities typically focus on reducing batch size to improvefrequency of delivery / deployment. Over time, teams continuously work to improve the efficiency of each step and monitorthe impact of these improvements based on the trend shown inthe software delivery performance KPIs, i.e. Overall Lead Time,Delivery Frequency, Mean Time to Repair, Change Fail Rate.Median of »Implementing«100Median of »Committed«Median of »Refined«50Median of »Refining«Median of »Analyzed«Median of »Analyzing«0Q1Q2Q3Q4Q1TimelineFig. 4: Example of Overall Lead Time distribution per process step for an OTSsoftware productCurrently, Overall Lead Time in ETAS is measured starting fromthe point in time when a Program Manager pulls an unqualifieditem from a pool of ideas to the backlog. The measurement endsat the point in time when all engineering tasks are completedand verified leaving only release specific – mostly business andlegal related – activities to be done.By measuring Mean Time to Repair, a distinction has been madetransparent between the time engineering needs to develop afix and the total time needed until the defect is resolved at thecustomer site.200150DurationFollowing the publication of the book »Accelerate« by NicoleForsgren, Jez Humble, and Gene Kim in 2018, ETAS decided toimplement the KPIs Overall Lead Time, Delivery Frequency, andMean Time to Restore/Repair (MTTR). To drive this to completion, a dedicated DevOps champion was hired to the engineeringorganization in late 2018 and a dedicated CI/CD Chapter wasestablished to develop patterns on how to measure and leverage these KPIs as well as expedite the implementation of CI/CDmethodology in the various product development organizations.Despite initial skepticism, the CI/CD Chapter succeeded in convincing the development teams of the benefits of transparencyon these three KPIs. The fourth KPI discussed in the book, ChangeFail Rate, was put on the backlog to be applied to future Software as a Service (SaaS) solutions because it is often difficult toidentify the point in time of the injection of a problem for Offthe-Shelf products. In many cases, defects are found years laterby changing usage patterns by customers.100500Juli 2019Oct. 2019Jan. 2020April 2020Juli 2020Oct. 2020April 2021Fix dateFig. 5: Evolving Mean Time to Repair trend for an OTS software productDue to the fact that ETAS does not have a channel to directlydeploy a software change into a customer installation, any fix isbundled up with the next scheduled quarterly release. This resultsin a time window where every fix waits for the next release. Thisinsight has stimulated a lively discussion to address the tensionthat ETAS’ customers simultaneously want fixes delivered asquickly as possible on the one hand and often cannot consumea higher Delivery Frequency on the other.Through investments in the automation of testing and artifact& document creation, some ETAS teams were able to increasedelivery frequency from 2-3 deliveries per week in 2019 to
Page 7 of 8greater than 1 delivery per day by Q1 2021. This investmentsignificantly reduces the transaction cost of process stepsduring the end phase of the delivery pipeline and enables theteams to support a growing market with increasing demand forvariations. Based on the success observed the team plans tofurther increase delivery frequency in 2021.SummaryIn an increasingly volatile environment, the time it takes to validate a business hypothesis or fulfill a customer requirement,combined with the ability to deliver at optimal frequency is becoming increasingly business critical. Building and maintaining adelivery pipeline gives an organization the ability to continuouslydeliver new high-quality features to customers faster and farmore frequently.In this sense, this whitepaper refers to the four KPIs identifiedby Forsgren et al. (2018), which are causally related to improvedbusiness performance [1] and proposes that for businessesselling software products such as Off-the-shelf (OTS) and Software-as-a-Service (SaaS), an adapted set of KPIs is used. In thiscontext, we conclude that Overall Lead Time, Delivery respective Deployment Frequency, Mean Time To Restore/Repair, andChange Fail Rate have proven useful as KPIs.These four KPIs provide software organizations with an effectivetool for continuous learning and improvement and allow teamsand organizations to compare and benchmark against other teamswithin the organization or against the industry as a whole.Although measurables do not always have clear-cut answersor actionable tips that will seal business success, the benefitof well-chosen KPIs is that they foster regular discussions andnourish a culture of continuous improvement.About ETASAbout Kugler Maag CieETAS‘ portfolio includes vehicle basic software, middleware,and development tools for the realization of softwaredefined vehicles. Our product solutions and services enablevehicle manufacturers and suppliers to develop and operatethem with increased efficiency. Holistic cybersecurity solutions in the auto motive sector are offered via the ESCRYPTbrand.In everyday business, it all boils down to success. By ensuring the corporate strategy is implemented methodicallyand professionally, we help foster front-line innovation.With our consultation, your R&D successfully puts yourideas and innovations on the road. As the leading consulting firm in automotive electronics development, KuglerMaag Cie [10] provides both management consulting andprocess excellence. We design your process-oriented R&Dorganization adaptively to market- needs in a dynamic business environment. Our experts pioneered the deploymentof Agile development methods in Automotive development.The automotive industry is undergoing fundamentalchange. New, energy-efficient vehicle powertrains, (partially) autonomous driving, digitalization, connectivity, andcybersecurity – the list of innovations has never been solong. At the same time, new systems must be brought tomarket faster. Key technologies are electronics and software, which is exactly where ETAS’ strengths lie. ETASsolutions are used at all stages of embedded softwaredevelopment.Since 2010, we have helped launch many Agile Transformation at many corporations on all organizational levelsand promoted the genesis of an Agile mindset. Of course,your projects and processes will be consistently fused andsupported with such industry standards as AutomotiveSPICE and Functional Safety (ISO 26262). Our AutomotiveSecurity experts foster awareness within your organizationof comprehensive, end-to-end safeguards. Looking for consultancy on Automotive electronics development? With us,you’ll find it a lot easier.
Page 8 of 8References[1] Forsgren, Nicole; Humble, Jez; Kim, Gene (2018): Accelerate: The Science of Lean Software and Devops: Building and ScalingHigh Performing Technology Organizations.[2] Marr, Bernard (2020): What’s The Difference Between Lagging And Leading Indicator?Link: 23/whats-the-differencebetween- lagging-and-leading-indicator[3] Hatheway, Richard (2016): The Real Difference Between Metrics and KPIs.Link: ween-metrics-kpis-richard-hatheway[4] Weber, Sergej; Tengler, Steve (2020): Five Ways Agile in Automotive Will Pivot in 2020.Link: s-agile-automotive-will-pivot-2020[5] Thoughtworks (2018): Four Key Metrics.Link: -key-metrics[6] Altvater, Alexandra (2017): What Are Software Metrics and How Can You Track Them?Link: https://stackify.com/tr
software development produces unique artifacts [1]. Also, in software engineering, the sequence of work does not follow the same linearity as that of a production line: design and delivery activities - especially in Agile software development - happen simultaneously. To steer the delivery process in the right direction, businesses