Transcription
KEY PERFORMANCE INDICATORSFOR SMART GRIDSMaster Thesis on Performance Measurement for Smart GridsVattenfall AB - R&D - Power TechnologyAuthor:W.J. HarderSupervisors:R.A.M.G. JoostenB. RoordaY. HeUniversity of TwenteUniversity of TwenteVattenfallA thesis submitted in fulfilment of the requirements for the degree ofMaster of Science in the field of:Financial Engineering and Management17/07/2017
SummaryThe purpose of this report is to present a method which facilitates the use of Key Performance Indicators in Smart Grids. The aspects that are covered are the related projects andprocesses as well as the company level perspective. This method is the result of a masterthesis assignment on what Smart Grids are and which benefits are associated with them. Awide range of benefits such as more reliable energy distribution and generation as well ascost savings have been found. Some of these benefits would mostly be enjoyed by society ingeneral, whilst the investments to acquire these benefits have to be made by the DistributionSystem Operators. The author expects that the asymmetric distribution of knowledge on thegoals of the projects could be made more symmetrical by using the KPI method. This can berealised by the cooperation of management with project members in deciding which KPIs willbe used in the project and setting their target levels. Conversations with several colleaguesat Vattenfall Research and Development and with some colleagues at Vattenfall Distributionhave greatly contributed to forming these chapters. After setting the framework for this studyand stating which methods will be used, a description of the KPIs that have been found ispresented. The full list can be found in Appendix I – Existing KPIs. The main sources wereEuropean Commission publications, regulatory documents published by regulators in Europe, documents from energy utilities and DSOs. It is worth to specifically mention the use ofthe EU Discern project for providing a comprehensive source of information.An approach to quantifying Smart Grids benefits with Key Performance Indicators and howthey relate to regulations and incentives is presented. It has been found that many KPIs aredirectly incentivised by the regulatory agency. However, the current scheme (ending 2019)promotes capital intensive solutions, as it operates on a cost-plus basis. This conclusion isnot only valid for Sweden, but for several other countries in Europe. Since Smart Grids bringbenefits in many different areas, the recommended KPIs are presented per focus area in theSmart Grid Roadmap, together with a guide on how to implement KPIs and how to use themduring and after implementation. This implementation guide is the main deliverable towardsVattenfall. An important aspect of the implementation of KPIs is the cooperation between thedifferent layers of management and the employees. Making sure everyone is working towards the same goals is difficult if the information asymmetry is large, therefore this methodaims to make the distribution of information more symmetrical. Chapter 7 also contains theguide which was developed as part of this thesis on how KPIs can be applied in the Vattenfall Smart Grid Roadmap.ii
AcknowledgementsThe moment is finally here, writing these acknowledgements is the last touch on my thesis. Ihad a very rewarding time in Sweden in general, and at Vattenfall in specific. At the Research and Development department I was surrounded by people who are experts in theirrespective fields and were always willing to provide support and guide me in the right direction. I would especially like to thank Ying He, who was always willing to provide feedback in avery clear manner whilst still allowing for constructive discussion: exactly how I like it. I mightnot have always listened when she told me to go home because it was past five o’clock already, but luckily, she did allow me to join the organisational team of the Vattenfall InnovationCompetition, also known as The Unicorns, in the after-work hours. This group of people havemade my time at Vattenfall even better, being able to organise and join so many workshopsand inspirational lectures was truly rewarding and I thank each and every one of the teammembers.Writing my thesis abroad was quite an undertaking and I would like to thank Reinoud Joostenfor motivating and supporting me in pursuing this endeavour, even before actually being myofficial supervisor. The many discussions we had on Smart Grids in general but also on theirgame-theoretical aspects have helped me to develop a deeper understanding of the manyfactors that are at play. I have appreciated the detailed feedback on previous versions verymuch. I also thank Berend Roorda for his feedback in the later stages of my project and hisguidance during my entire master.Many people who were not directly involved in my thesis have given me the motivation andeven though I was far away, provided a sense of familiarity. I would like to thank all the students with whom I have cooperated in projects and courses, they have made my years as amaster student very pleasant.Last but not least I thank my parents and sister for their support during my entire studies.Their contribution has come in many ways and I could not have done it without them.iii
Table of contentsTABLE OF CONTENTSIVLIST OF ACRONYMSVI1.INTRODUCTION11.1.Company Description11.2.Operation of a State-Owned Commercial Company11.3.Vattenfall Research and Development Department21.4.Key Performance Indicators21.5.Problem Description31.6.Research Questions41.7.Scope42.CURRENT SITUATION52.1.KPI Framework Developed by EU-Funded URE STUDY83.1.Smart Grids83.2.KPIs in General93.3.KPIs in R&D104.METHODOLOGY104.1.Finding KPIs104.2.Study of Smart Grid Workings and Advantages114.3.Setting up a Method for Applying KPIs114.4.Selecting KPIs for Recommendation125.EXISTING KPIS135.1.KPIs Used by Regulators for DSOs136.MONETISING SMART GRID KPIS146.1.Revenue Cap146.2.Incentives15iv
6.3.Revenue Increase206.4.Cost Savings216.5.General Method for Monetising KPIs227.RECOMMENDED KPIS AND THEIR USAGE237.1.Recommended KPIs237.2.Usage of KPIs237.3.KPIs in the Smart Grid Roadmap258.CONCLUSION269.DISCUSSION AND FUTURE WORK2710.BIBLIOGRAPHY2811.APPENDIX I – EXISTING KPIS3211.1.KPIs from Academic Literature3211.2.KPIs from EU projects3411.3.KPIs from other sources3912.APPENDIX II – RECOMMENDED KPIS4112.1.Project level KPIs4112.2.Process level KPIs6112.3.Company level KPIs76v
List of AcronymsAcronymMeaningACAlternating CurrentADIAverage Duration of InterruptionAIAvailability IndexAMIAdvanced Metering InfrastructureAMRAutomated Meter ReadingBABusiness AreaBaUBusiness as UsualCAIDICustomer Average Interruption Duration IndexCAPEXCapital ExpenseCBACost Benefit AnalysisCBMCondition Based MaintenanceCEMICustomers Experiencing Multiple InterruptionsCEMI12Customers Experiencing Multiple Interruptions –twelve or moreDCDirect CurrentDGDistributed GenerationDLRDynamic Line RatingDRDemand ResponseDSODistribution System OperatorEIEnergimarknadsinspektionenENSEnergy Not SuppliedEUEuropean UnionEVElectric VehicleFLIRFault Location, Isolation and RestaurationGHGGreenhouse GasGRI G4Global Reporting Initiative, Sustainability ReportingGuidelines, Fourth RevisionGWhGigawatt hourHVHigh VoltageKPIKey Performance IndicatorkWhKilowatt hourLFLoad FactorLTIFLost Time Injury Frequencyvi
MTonnesMillion TonneMWMegawattMWhMegawatt hourNPSNet Promotor ScoreNPVNet Present ValueOPEXOperational ExpensePNSPower Not SuppliedPPVPresent Purchase ValuePVPhotovoltaicPWAPrioritised Work AreaR&DResearch and DevelopmentROCEReturn On Capital EmployedROIReturn on InvestmentRTPReal Time PricingSAIDISystem Average Interruption Duration IndexSAIFISystem Average Interruption Frequency IndexSCADASupervisory Control and Data AcquisitionSGRSmart Grid RoadmapTSOTransmission System OperatorVF ENV R&DVattenfall Environmental Research & DevelopmentWACCWeighted Average Cost of Capitalvii
1. Introduction1.1. Company DescriptionVattenfall is in the top 10 of largest energy companies in Europe and the leading energy company in the Nordic countries. This makes it a major player whose decisions affect over 6 millionelectricity customers, over 3 million electricity network customers and over 2 million gas customers. After unbundling the distribution part from the rest of the company, the power distribution department was placed in a separate company which is fully owned by Vattenfall AB. Unbundling was ordered by the government [1] to improve competition in those parts of the energyindustry that are not characterised by a natural monopoly. Since the completion of the unbundling process, Business Area Distribution has been operating as an independent organisationwith full decision-making power. It is this part of Vattenfall that Vattenfall R&D Distribution reports to and receives a budget from.1.2. Operation of a State-Owned Commercial CompanyThe Swedish state owns 100% of the shares of Vattenfall AB and is the receiver of dividends ifthe company decides to pay out. As the only shareholder, the government has given Vattenfalla mandate that enables it to operate on a level playing field with privately owned competitors,although the state provides the targets and mission for Vattenfall. In the report by the Swedishgovernment on state-owned business in 2015 [2], the targets were defined and published asstated below. Please note that the revenue for the Distribution System Operator part of Vattenfall is subject to limitations based on incentive regulations.Table 1 Targets set by the Swedish government for VattenfallTargetOutcomeReturn on capital employed9%-8.2%Debt/equity ratio50-90%55.4%Funds from operations /adjusted22-30%net debt21.1%Carbon exposure in the compa65 Mtny portfolio by 202083.8 MtOutpace market growth in re Market growthnewable capacity by 202013.4% ( Market growth of9.9%)Improve energy efficiency improvements by reducing annual 440 GWh improvementusage of primary energy1,066 GWh improvementThese targets have been set by the Swedish government and are therefore the result of thepolitical process. The negative outcome of the return on capital employed is largely caused bynecessary depreciations to take the lower than expected energy price into account, as well aslosses from the sale of a lignite mine and associated power plants.1
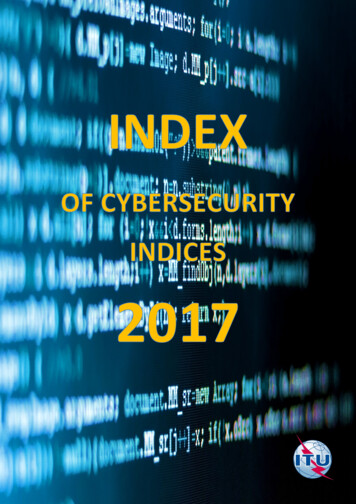
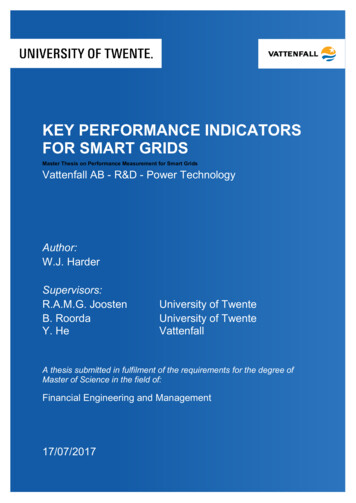
1.3. Vattenfall Research and Development DepartmentThe Vattenfall Research and Development (R&D) department is part of Strategic Developmentand provides R&D services to the six Business Areas (BA) known as Heat, Customers & Solutions, Wind, Generation, Market and Distribution. The sponsor for this project is BA Distributionthrough Vattenfall R&D Distribution. In general, R&D Distribution runs projects that aim to improve the Vattenfall-owned distribution grid in Sweden. Some examples could be improvingpower lines, transformers, breakers, switches, metering at the customer end and automating theoperation of the grid.Figure 1 Vattenfall Organisation Chart.1.4. Key Performance IndicatorsA main subject of this thesis is the part of the Balanced Score Card (a strategy managementtool) known as Key Performance Indicators. These indicators measure different aspects of performance such as quality, delivery time, capacity and financial figures. When these measure anaspect of performance which is the key to the success of the entity, they become Key Performance Indicators.A metric is defined as a measurement made over time, which communicates vital informationabout the quality of a process, activity or resource [3]. In this thesis, a Key Performance Indicator will be an indicator which is a measurement of the performance towards a main objective ofthe project. Key Performance Indicators have an associated quantified goal per indicator.2
1.5. Problem DescriptionIn the energy utility sector, Smart Grid development has started. Grid equipment is being automated, more and more sensors are being installed and self-healing1 networks are becoming areality. The benefits of these improvements are manifold, which makes that measuring the totalbenefit of having a Smart Grid requires analysis on many different levels and aspects.How to evaluate the performance and how to assess the effects the projects have was unknownand has recently become more relevant after the first Smart Grid projects have started at Vattenfall. To measure the performance of the electrical grid, KPIs are being used by the EuropeanCommission, regulators (such as the Energimarknadsinspektionen, the Swedish Energy Markets Inspectorate), other utility companies and Distribution System Operators (DSOs) to evaluate, monitor, follow up and guide the performance of grid projects. Vattenfall Distribution Nordicuses, among other KPIs, the System Average Interruption Duration Index (SAIDI), System Average Interruption Frequency Index (SAIFI) and Energy Not Supplied (ENS) to follow up onbusiness performance. This is common in the electric utility industry since regulators in severalcountries (Table 5) require the DSOs to use them as the basis for their performance measurement.However, at Vattenfall Distribution Nordic the use of KPIs to evaluate the performance and implementation of smart grid technology and functionalities, has not yet reached its full potential.Evaluation of the costs of the project is done before and after the project implementation, butnot in every case an analysis on the intended effect and business benefits of Smart Grid technology implementation is done. The management of Vattenfall’s DSO has requested that theresults of the projects are analysed ex-ante and ex-post to keep track of the progress that hasbeen made, and whether the projects have fulfilled their expectations.In projects sponsored by the EU, several KPIs and a framework to apply them with Smart Gridprojects have been developed, but this framework strives to encompass all aspects of SmartGrids and the author has found these to be too general for Vattenfall Distribution Nordic’sneeds, since they focus on the distribution aspect of Smart Grids.We can summarise the problem as follows:“Project managers would like the current method of evaluating, monitoring andfollowing up on Smart Grid projects, to be improved. They consider using KPIs,but a suitable set of KPIs in a clear framework for Smart Grid projects at Vattenfall Distribution Nordic is not available.”The aim of this study is to solve this problem by performing a KPI application study specifically for Smart Grid projects.1A self-healing network is a network that is able to identify faults, locate them and reroute energy to isolate the fault whilst restoring connection to other affected areas.3
1.6. Research QuestionsVattenfall Distribution Nordic is interested in using KPIs in measuring project proposals, performance and evaluation. The management within this Business Area believes using KPIs wouldbe useful for managing the projects on Smart Grids. This thesis is expected to serve as a basisand input to the application of KPIs for Smart Grid benefit analysis. The main question has thusbeen posed:“How can Vattenfall Distribution Use Key Performance Indicators to evaluate proposals, measure performance and evaluate the outcome of Smart Grid projects?”The question is divided into a number of sub-questions in order to answer it in a structuredmanner.Sub-question 1:“Which Smart Grid related KPIs are used in power industry by different organisations includingthe European Commission, regulators, utilities and DSOs?”The literature study provides Vattenfall with a list of KPIs that have been used in relation toSmart Grids and might prove valuable in the future as well. The author expects that this list includes KPIs that are relatively similar and are only different in the formal definition, as well asKPIs that would not be relevant for Vattenfall Distribution. A need to select the KPIs which willbe used for Smart Grid projects in Vattenfall Distribution brings us to the next subquestion:“What are the requirements for KPIs to be useful to evaluate proposals, measure performanceand evaluate the outcome of Smart Grid projects.”The outcome of this question should provide clarity on which KPIs should be selected and developed further. Measuring something has associated costs. An analysis should be made by theusers of the KPI framework during its implementation whether the information is worth morethan it costs to acquire. The final sub-question deals with the validation of the previous answers.“In what way should the KPI framework be implemented in order to facilitate usage by VattenfallDistribution?”Just providing a list of KPIs might prove insufficient in enabling Vattenfall Distribution to useKPIs for Smart Grid project evaluation, but providing a method for implementation might go along way in facilitating efficient use of the proposed metrics.1.7. ScopeThe study is performed for Vattenfall Distribution and this has direct implications for the scope,namely that it focuses on the distribution aspect of Smart Grids, having priority over power generation and consumption related aspects. The study builds on several EU-projects that havestudied and developed Smart Grid related KPIs. Vattenfall has contributed to many of theseprojects in one way or another and many of the people involved in them are still around.The technical aspects of these projects are not relevant for this report; the focus is on the goalsthe projects have. These goals are specified in terms of what they would like to achieve (such4
as lowering outage times) and the ambition level in the relevant aspect (how many minutes reduction of outage time).Vattenfall has a diverse portfolio of Smart Grid projects, which provide a basis to study thesought-after benefits of a Smart Grid in this stage of development. Aspects that have an influence on the realisation of the benefits are presented briefly; the focus of this aspect are the regulations which are used to determine the revenue cap. The calculation of KPI values frommeasurements for real projects is not included in this study.2. Current Situation2.1. KPI Framework Developed by EU-Funded ProjectsSeveral projects that aimed to define a Smart Grid KPI framework have been sponsored by theEU [4, 5]. They have produced metrics that can be applied broadly and cover much more thanthe aspects that Vattenfall Distribution is interested in, and in some cases lack calculation methods. An example would be “automation and control”: a way to actually quantify automation andcontrol in the context of Smart Grids from a Distribution System Operator aspect has not beenfound yet. As a result of the lack of quantification methods, these KPIs have only been usedsporadically in evaluating Smart Grid projects on the distribution aspect.2.2. StakeholdersThe Vattenfall R&D Distribution portfolio is the program within the Vattenfall R&D organisation which contains R&D activities with Vattenfall BU Distribution as client. The portfolio has afocus on development and implementation of proven methods and equipment. Several projectsare run parallel, from automating grid equipment to using smart meters to be notified of grid failure and setting up micro-grids that are able to run independently of the main grid. The overarching goals of these projects are lowering technical energy losses, improving the reliability of thepower grid, and running pilot projects that explore future business opportunities for VattenfallDistribution.Vattenfall BU Distribution runs the distribution grids that Vattenfall owns. Their main goals areproviding a reliable distribution of electrical energy and doing this with low electrical losses ofenergy. Since operating an electric grid is a natural monopoly,2 the profit Vattenfall DistributionAB is allowed to make is set by the state. In recent years, the state has introduced several incentive schemes (based on the reliability, efficiency and effective capacity) that influence thefinancial reward the company is allowed to have. Smart Grid projects have the potential to improve the metrics which are incentivised by the government.2Duplicate equipment is considered a waste of resources or more formally, “A necessary condition for anatural monopoly to exist for output Q of some good is that the cost of producing that good is subadditiveat Q” [4]. This means that the products are produced most efficiently if there is only one producer per(geographical) market. Authors note: Another, less strict definition of this term would be that it in the specified market, it is always cheaper to produce something with only one company instead of more than one.5
Vattenfall BU Distribution customers rely on Vattenfall BU Distribution to provide them withelectric energy. These customers can be residential, commercial or industrial. For most of thesecustomers, electric energy is a critical product. Without it, shops and factories would come to astandstill. Many houses are heated electrically as well, from not very efficient methods like electrical radiator panels to the more efficient heat pumps. Several KPIs are directly linked to thequality of power that customers receive and are incentivised by the government. Distributioncustomers are entitled to compensation in case of interruption of the power supply for more than12 hours according to state laws [6].2.3. IncentivesThe energy distribution market is regulated in Sweden with over 160 businesses responsible fortheir specific areas. [6] Revenue is capped, with the cap calculated by adding a percentage tothe WACC (Weighted Average Cost of Capital). This has led to a situation in which there was anincentive to choose solutions with a high capital investment, even when solutions with lowercosts would have been available. To provide an extra stimulus for distribution companies to perform at the top of their capabilities the following incentives were introduced: [7, 8]Table 2 Incentive scheme for DSOs in SwedenNameMeaningDescriptionSAIDISystem Average Interruption Part of incentive scheme by adjusting revenueDuration Indexcap, based on average interruption duration [8]SAIFISystem Average Interruption Part of incentive scheme by adjusting revenueFrequency Indexcap, based on average interruption frequency [8]CEMIPercentage of customersexperiencing at least 4 interruptionsPart of incentive scheme by adjusting revenuecap, based on amount of customers experiencingmultiple interruptions [8]NetworkLossesEnergy lost in the networksPart of incentive scheme with bonus/malus, depending on network losses [7]Load Fac- Daily average load divided Part of incentive scheme, bonus only, related totorby daily maximum loadaverage load divided by maximum load [7]The combination of these incentives makes it rewarding to operate a reliable distribution network that is efficient in the network losses aspect as well as in the use of the assets. Some ofthe incentives are stronger (e.g. outage related) than others (e.g. efficiency related); internalexperts on this matter have indicated that the incentive related to the network losses is currentlytoo low to influence decisions. The financial result of the incentive is not significant given thescale of the investment that would be required to improve the network losses. Therefore, theincentive currently does not have the desired effect of providing extra motivation for grid operators to invest in more efficient grid equipment. However, the strategic goals of reaching a NetPromotor Score (NPS) of 2 relative to Vattenfall’s peer competitors [9] and absolute CO2emissions of less than 21 MTonnes before 2020 is a clear indication that there are other formsof motivation than purely financial ones.6
Since the regulator requires data on the incentives mentioned in Table 2, this data already exists within the company. This makes them suitable candidates for KPIs, since these are definedin a strict manner already and data could be obtained from sources within the company.Quantifying the improvement of these metrics can be coupled to these financial rewards withgreat accuracy, providing a reliable indication of what an improvement in the metric would beworth. Smart GridsIn the traditional grid, about 8% of the energy from generating facilities is lost along transmission lines, whilst 20% of generation capacity is reserved to meet peak demand (i.e., only in use5% of the time) [10]. This is not an optimal situation, since this reserve has very low utilisation ofits capacity. The implementation of a Smart Grid aims to improve these figures. In general, thisis done by adding a stream of information parallel to the stream of energy. This stream of information enables a bi-directional stream of electricity, where a consumer can also become a producer when the market conditions favour this. An actor that is a consumer for the largest part ofthe time but who will produce energy if the conditions are favourable, for instance high solarpanel output and low self-consumption, is called a prosumer. For a consumer to be labelled asa prosumer, there is a need for either some asset that generates electricity (e.g. solar panels,micro wind turbines and micro-hydro generation), or stores energy for later use, for instancestationary batteries, or an EV that is capable of delivering energy as well as consuming it. If aprosumer and consumer are living next to each other, there would be a scenario where theprosumer delivers energy to the consumer with much lower losses than those that would beassociated with long-distance transmission of energy.Another beneficial aspect of smart grids is the improved knowledge on how the grid is doing.Before, the first moment a DSO finds out about an outage is when it receives a call from a customer. The time between the start of the outage and the first call is a direct contributor to SAIDI,which could be avoided if automated detection systems were in place. An example of an improvement that has been made in this field is the automatic “pinging” or automated meters. If ameter does not respond, it is a sign of an outage and the Fault Location, Isolation and Restoration (FLIR) process can be started.A problem that has arisen with the installations of DER is that these can cause voltage problems. Without knowing what the voltages at the customer sites are, limits have to be put ontoDER at prosumer sites to make sure these voltage deviations do not violate quality limits. Oneway to do this is to install a Smart Transformer, which is able to provide different output voltagesto compensate for the generation from the prosumer. Having this intelligent equipment is anaspect of a Smart Grid as it will facilitate the installation of higher capacities of distributed renewable energy resources.The option to read values from a distance also reduces the need to physically travel from site tosite, reducing the number of possibilities for accidents, thereby increasing safety. This countsnot only for the measuring of meter data at customer sites, but also of measuring the conditionof transformers. This increase in data sources opens up possibilities for condition basedmaintenance as well.All aspects of Smart Grids combined will change the way society generates, distributes andconsumes power [10].7
3. Literature Study3.1. Smart GridsThe definition of a Smart Grid has been discussed in the past years [10-13]. The sources usedin this thesis all describe a method or combination of methods of improvement of the currentgrid. This can be a limited scope such as putting a focus on the implementation of smart homes,or can include many different aspects. In every case, the grid as we know it today plays an important role. A Smart Grid should not be viewed as a replacement of our current grid but moreas an upgrade. Gharavi and Ghafurian state the following requirements of a Smart Grid [13]: Allow for the integration of renewable energy resources to address global climatechange.Allow for active customer participation to enable improved energy conservation.Allow for secure communications.Allow for better utilisation of existing assets to address long-term sustainability.Allow for optimised energy flow to reduce losses and lower the cost of energy.Allow for the integration of electric vehicles to reduce dependence on hydrocarbon fuels.Allow for the management of distributed generation and energy storage to eliminate ordefer system expansion and reduce the overall cost of energy.Allow for the integration of communication and control across the energy system to promote interoperability and open systems and to increase safety and operational flexibility.If all of these requirements are fulfilled, an electrical energy distribution grid has become aSmart Grid. Farhangi [10] expects that the implementation of the Smart Grid will be an organicgrowth instead of a drastic overhaul. Although many of the functions of a Smart Grid could bedeveloped and implemented parallel to each other, this would require a large capital investmentin a short time period [14]. According to Gharavi and Ghafurian [13] the Smart Grid will have thefollowing characteristics when it is fully implemented: Self-healing: automatic removal of potentially faulty equipment from service before it failsby operating disconnection switches, and reconfiguration of the system to reroute supplies of energy to sustain power to all customers,Flexible: the rapid and safe interconnection of distributed generation and energy storageat any point on the system at any time,Predictive: use of machine learning, weather impact projections, and stochastic analysisto provide predictions of the next most likely events so that appropriate actions are takento reconfigure the system before next worst events can happen,Interactive: appropriate information regarding the status of the system is provided notonly to the oper
3.1. Smart Grids 8 3.2. KPIs in General 9 3.3. KPIs in R&D 10 4. METHODOLOGY 10 4.1. Finding KPIs 10 4.2. Study of Smart Grid Workings and Advantages 11 4.3. Setting up a Method for Applying KPIs 11 4.4. Selecting KPIs for Recommendation 12 5. EXISTING KPIS 13 5.1. KPIs Used by Regulators for DSOs 13 6. MONETISING SMART GRID KPIS 14 6.1 .