Transcription
Performance Assessment Using Key Performance Indicators (KPIs) for Water Utilities: A PrimerBy Sanford V. BergProfessor Emeritus, Economics—University of FloridaSenior Fellow, Public Utility Research CenterFebruary 26, 2020 (Revised) Water Economics and Policy, Vol. 6, No. 2 (2020)AbstractKey Performance Indicators (KPIs) are widely recognized as a basis for evaluating water utilityoperations in developing countries and for designing both regulatory and managerial incentivesthat improve performance. A number of methodolgies can be used for assessing performance,with KPIs and OPIs serving as more comprehensible and potentially more comprehensive thanmore technical empirical benchmarking studies. Data initiatives in low and middle incomecountries require resources that could be used for other activities with more immediate payoffs.However, regulatory oversight requires data analysis of trends, current performance and realistictargets. Quantitative studies can provide clues regarding the extent of economies of scale, scope,and density, but policy-makers need much more detail and specificity than most scholars provide.Here, the focus is on information systems that provide accurate, reliabile, and relevant data. KPIsrepresent the foundation for those developing, implementing, and responding to public policy-incentivizing water utilities in developing (and developed) countries to contain costs, improveservice quality, and expand water access over the long run.1. IntroductionThis paper on assessing water utility performance takes a primer/tutorial approach (with examples fromcase studies). Surveys of production and cost functions in the water utility sector have identified over twohundred quantitative studies (Berg and Marques, 2011; Cetrulo, et. al. 2019). Yet the use of thesetechnical quantitative studies by regulators for actual rate cases is relatively limited in middle and lowincome nations. One reason is that the data on which utilities are being evaluated are not very reliable.Another is that identifying high performers using stochastic frontier analysis (SFA) or data envelopmentanalysis (DEA) requires that decision-makers have confidence in the robustness of studies. In addition, itis a challenge to communicate the implications of quantitative studies to non-technical decision-makers(regulators who implement public policy and politicians who determine public policy). However, KeyPerformance Indicators (KPIs) provide a starting point for ranking utilities in a country. KPIs like nonrevenue water (NRW), collections, coverage, and staff per 1000 customers provide an important startingpoint for improving performance in the water sector.The advanced tools and new datasets available to economists have resulted in a plethora of publications.Many articles claim to have policy implications, even when the specific context of national situations arenot highlighted. For example, the existence of significant scale economies does not necessarily imply thatmerger or consolidations will reduce unit costs. There may be cost savings from sharing informationsystems or utilizing engineers more effectively, but the networks are still miles apart, so the cost savingsof bringing two systems together may not be substantial.1
Utility performance scores (and associated rankings) are used to identify poor performers, Yet manystudies do not (or cannot) control for unique circumstances faced by utilities related to topography,hydrology, customer characteristics, and other elements affecting costs. That context includes financialand political constraints (such as affordability and service quality as objectives), age of water networksand past maintenance, and the nature of regulation. Most authors acknowledge these limitations oftheir modeling efforts, but that does not prevent us (myself included) from drawing conclusions andmaking generalizations that are broader than can be adequately supported. For example, in theirsurvey of studies, Cetrul, et. al., 2019) conclude “ . . . regulatory incentives have not promotedperformance improvement of water utilities in developing countries.” (p. 378). They recognize thatthere are different types of regulatory systems, but still conclude that incentives do not impactperformance! This is far too strong a conclusion, given the wide range of regulatory regimes (price caps,cost of service, hybrids, appropriate targets, K-factors, etc.) This observation suggests that scholarsconducting SFA and DEA might present their conclusions with greater humility. No study is definitive;most are suggestive. The current paper argues that while simplistic approaches to performancecomparisons are not ideal, they often convey enough information to motivate those with operating andoversight responsibilities to change their current strategies. In addition, careful data collection for a fewindicators provides a strong foundation for more comprehensive studies that require time series andpanel data (Berg, 2010).Several years ago, the author prepared a survey of six books on water utility benchmarking activitiesinvolving performance assessment and improvement (Berg, 2013). Those volumes showed how collectingand analyzing KPIs enabled regulators and managers to do their jobs, since decision-makers manage whatthey measure. Quantitative evidence on trends over time, patterns across comparable utilities, and onhighest performing operators is essential if realistic targets and incentives are to be established. Since itonly summarized key lessons, the earlier article lacked substantive examples that might help thoseengaged in evaluating water utilities. With that in mind, this study focuses on the KPIs utilized bymanagers and by water sector regulators. The emphasis is on the potential benefits from devotingresources to data collection and analysis, and on the pitfalls associated with the misuse of data andmisplaced confidence in particular information.1 The focus is not on analytic techniques for assessingperformance (such as statistical or data envelopment analyses) but on steps to be taken prior to morecomprehensive quantitative research studies.2 The purposes of this study are two-fold: (1) practitionersin developing countries can see how information systems are established that enable regulators to1This study extends earlier work by the author on data availability (Berg and Phillips, 2017) and utilizes materialdeveloped for the Public Utility Research Center’s Advanced Training Program “Benchmarking InfrastructureOperations.” It reflects contributions from practitioners around the world. In addition, portions of this study drawupon material prepared by the author to answer a Frequently Asked Question on KPIs forwww.regulationbodyofknowledge.org . The World Bank supported the development of that material, and thatearlier study benefited from comments by Jemima T. Sy and Anna Aghababyan. Neither sponsoring organizationsnor reviewers are responsible for this survey of KPIs.2As of 2010, Berg and Marques (2011) had identified 190 quantitative studies using cost or production functions ofwater and sanitation services. A complete listing of the studies is available on-line.2
monitor, evaluate, and incentivize operators; and (2) analysts can better appreciate the strengths andlimitations of Overall Performance Indicators (OPIs) in establishing incentives.Let us start with the definition for KPIs from the Glossary in the Body of Knowledge on InfrastructureRegulation3:“KPIs are indices of cost and production outcomes for a firm. KPIs enable decision makers to tracktrends and identify areas needing changes, including operational procedures,maintenance/inventory practices, and capacity investments. These indicators represent valuableinformation regarding whether infrastructure performance is improving or becoming worse, sotracking KPIs is essential for performance assessment and enhancement (benchmarking). KPIs canbe classified into a set of categories that allow managers to establish primary responsibilitieswithin the key departments of the regulated business (whether public or private). Sinceperformance outcomes are inter-related and inter-dependent, creating an Overall PerformanceIndicator (OPI) is problematic. While specific departments might be responsible for collecting thedata on one or more indices, performance will generally rely on the activities of severaldepartments. Thus, the associated key performance outcomes refer to overall technical andfinancial operations, service quality, and customer experience. For example KPIs could includehours per day of service (technical), nonrevenue water or line losses (operational), cash flows andcollections (financial), and customer complaints (indicating value for money, from the users’standpoint).”The definition notes that KPIs go beyond cost and production outcomes to include other dimensions ofperformance, including customer perceptions. However, this definition does not acknowledge that someareas—like financial sustainability, professional capacity-building, and resource sustainability—requiremore comprehensive analyses of business plans, staff development programs, and long term hydrologicalconditions. Traditional KPIs often do not include these dimensions of performance involving long termoutcomes. Thus, one limitation of KPIs is the tendency to focus on areas that reflect current operationsrather than the sustainability of the utility. The more comprehensive definition (recognizing thelimitations of benchmarking) provides an outline of this study: overall performance assessment forutilities, accuracy and reliability of individual KPIs, and limitations of current tracking and incentivesystems. The sections identify some steps that can help address these three topics.2. Overall Performance Assessment for UtilitiesWater utility regulators in many countries utilize OPIs in ranking utilities and evaluating overallperformance trends (Cabrera, Dane, Haskins, & Theuretzbacher-Fritz, 2010). A number of steps can betaken to limit aggregation problems: identify key performance objectives, use relative performance scoresrather than rankings, ensure that weights reflect current priorities and recognize the importance oftrends, group “comparable” utilities by basic operating conditions as well as size (to control forcircumstances beyond managerial control), and present comparisons in ways that are clear andappropriate for target audiences. Examples from Albania and Peru are presented to illustrate howregulators have applied these steps. These countries were selected because the annual reports of theirwater sector regulators utilize KPIs in evaluating performance; other nations could have been chosen aswell since the tools are applied in many developing countries.3See www.regulationbodyofknowledge.org .3
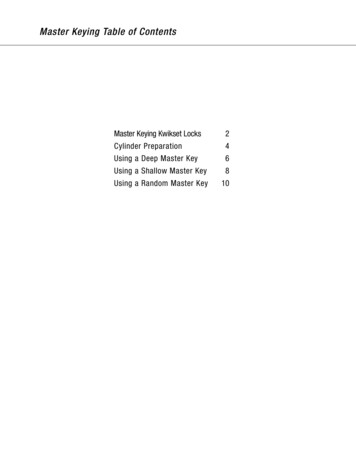
2.1 Identify Key Performance Objectives before focusing on Key Performance Indicators.For a performance indicator to be “key”, it must capture some dimension of performance that is importantto those receiving service or to those who hope to have access in the future. Those responsible forproviding oversight of infrastructure services and for delivering those services should reach a consensusregarding what is valued and what feasible. Generally, legislation will identify dimensions of performancethat elected representatives seek to improve: for example, water service should be affordable, producedefficiently, and available throughout the nation. Key Performance Objectives could include availability,network outage impact reduction, robustness of operations to extreme events (including weather andconflicts), quality of service, downtime, notification of delivery problems, customer satisfaction (viasurveys or number of complaints), integrity of billing and collection processes, affordability, access,efficiency, productivity, innovation, security, and safety. These goals can then be associated with a set ofKPIs. Once the objectives are prioritized, and data collection has commenced, the performance evaluationprocess can begin: starting small, and slowly increasing the number and accuracy of KPIs. Anotheradvantage of starting with objectives is that indicators that are “easy to measure, but relativelyunimportant” will not become the focus of performance evaluation.2.2 Use relative performance rather than rankings to create an Overall Performance Indicator (OPI).Having a single indicator is convenient, though it can mask weak or strong performance in specific areas.Nevertheless, regulators and managers often combine KPIs to create an Overall Performance Index. Caremust be taken to ensure the process is transparent and reflects priorities. In particular, aggregating a setof KPIs to create an OPI should not be done by adding rankings to create an overall score. Rather, analystsshould utilize raw scores relative to best score (or the target score). For example, take a situation wherethree KPIs are used to evaluate the relative performance of three utilities depicted in Table 1. Higherscores are desired.Table 1. Three Indicators (A, B, and C) and Three UtilitiesFirm/ABCU198 (1)85 (1)55 (3)U296 (2)83 (2)60 (2)U394 (3)82 (3)82 (1)Scores relative to 100% (with Rankings in Parentheses).In the above example, U3 ranks third for indicators A and B, and comes in first for KPI C. If we add therankings, U1 has five points, U2 has six points, and U3 has seven points—where the lowest score could belabelled “best”. However, this conclusion would be incorrect, since the procedure treats ordinal numbers(rankings or positions) as though they were cardinal numbers that could be added together. Taking thebest score for each indicator as the denominator, we can normalize the data and create a “relativeperformance” KPI score for each utility, as shown in Table 2:4
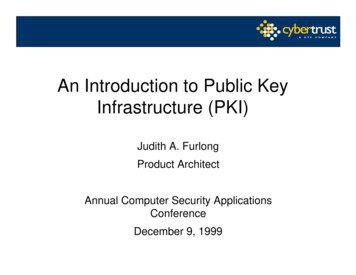
Table 2. Three Indicators (A, B, and C) and Three UtilitiesFirm/ABCOPIU198/98 85/85 55/82 2.7U296/98 83/85 60/82 2.7U394/98 82/85 82/82 2.9Individual Scores are relative to the Best Scores for each Indicator.U3 has the best overall performance (2.9) if the three KPIs are added together (basically, given equalweight), where the other two utilities are tied with scores of 2.7. Of course, if measurement accuracy islow for the three indicators, the three utilities could be viewed as performing equally well. Note thatinstead of using the highest score in each KPI category, the Target KPI score could be used in thedenominator. This shift will give some benefit to the utility whose performance is closest to particulartargets. Such an adjustment might be appropriate if exceeding the target is very costly and theperceived benefit is small. Thus, the “best” choice for normalization depends on the purpose of thecomparison. A comprehensive analysis would check the robustness of the results to different measures.2.3 Give weights to the various indicators that reflect priorities.In the above example, if KPI A is given a weight of .9, and B and C are each given a weight of .05, then theOPI changes and the revised rankings would also change. Clearly, determining the weights can be achallenge. In Peru, the water regulator (SUNASS) gives equal weight to each of nine KPIs, but there aredifferent numbers of operational and financial KPIs, so weights are implicit: determined by the number ofKPIs in the four categories (Corton, 2003):1. Quality of service (three--compliance with residual chlorine rule, continuity of service, andpercentage of water receiving chemical treatment),2. Coverage of service (two--water coverage and sewerage coverage),3. Management efficiency (three--a combination of service continuity and volume per person at aconnection, percentage with meters, and the ratio of uncollected bills to total billings), and4. Managerial finance efficiency (one--ratio of direct costs and other operating expenses torevenues)Of course, one problem with KPIs (and with cost and production function studies) is that costs can bereduced today at the expense of greater costs in the future. Maintenance, staff training, and systematicremediation can all be deferred—improving indicators of current performance but burdening futurecustomers. Thus, authorities setting targets and weights and providing oversight also need to monitorbudgets to ensure that particular outlays are not deferred. However, avoiding micromanagement thenbecomes a challenge. Ther is no single, simple way to establish weights for an OPI, nor can the problemof information asymmetry be eliminated.In the case of Uganda, the national water and sanitation utility has internal management contracts witheach of its managers for geographic areas. The national targets reflect the priorities identified in theoperator’s performance contract with its oversight committee (established at the ministerial level). Thetargets and weights applied to the components in the incentive plans are jointly determined by the head5
office and the local manager. Both weights and targets depend on the current levels of performance, theimportance of achieving objectives from the standpoint of cash flows and customer satisfaction, andopportunities for improvement. The incentive framework is dependent on KPIs, targets and weights(Mugisha, 2011).The Water Regulatory Authority in Albania (WRA) utilizes a much more complex system where a maximumnumber of points is given for meeting the target for each of ten KPIs (with zero points for not reaching aminimum, WRA, 2016). Furthermore, each target has a given weight. For example, two of the targetseach have a weight of .20, so reaching a collection efficiency of 82% and non-revenue water of less than30% would give the utility 40 of the potential 100 points. Albania also has a category called “RegulatoryPerception” (weight of .05) based on compliance with the law. Within this category, equal weight is givento each of the four components: possession of a valid license, operating with an approved tariff, payingregulatory fees, and having timely and complete replies to WRA information requests (p. 70).Note that justifying explicit weights can be problematic unless stakeholders have participated in theprocess that created the weights. In particular, that average weights may not be the same as marginalweights when considering priorities. The relative importance of performance on specific KPIs in the futureis likely to be different from fundamental weights that might be given each KPI at current levels ofperformance. Thus, regulators creating an OPI should identify what matters in incremental terms. If allutilities meet a well-accepted target, that particular KPI could be assigned a lower weight, allowing theOPI to reflect future priorities. For example, the inclusion of the “Regulatory Perception” KPI wassomewhat important for the WRA since it only began publishing performance reports in 2012—and someutilities were still not complying with regulatory rulings. By 2015, WRA regulated 57 water (andwastewater) utilities, whose “Regulatory Perception” scores ranged from 10 to 95. The OPI ranged from16.99 to 99.5. Presumably SUNASS (the Peruvian water regulator) omitted consideration of this factorsince it did not face the same kinds of compliance issues—its authority and benchmarking system hasexisted for several decades.2.4 Give some attention to performance trends when evaluating utility scores.In the case of Albania, “Top Improvers” are also identified: utilities with scores increasing by more than10 points (out of a maximum of 100). Of course, a very high performing utility may find it difficult tofurther increase its OPI since the incremental cost of further improvements is likely to be high. So oneshould not expect rapid improvements in scores for high ranking firms. Conversely, low performing firmsmay be able to improve performance through improved internal incentives and the targeting of “lowhanging fruit”. However, low performing firms may also have inherited very poor networks that createchallenges for managers who seek to improve KPIs. In any event, some attention should be given to trendsin performance. It can be argued that a low scoring utility that shows improvements in a number ofperformance dimensions warrants positive recognition (and reward) for taking steps towards improvingoverall performance. Utilities with KPIs (and an OPI) that are moving in the wrong direction need to beidentified as well—if only to alert managers that those overseeing performance are concerned withdevelopments. Of course, the OPI scores over time will not be consistent if weights change andcomponents are added or deleted. Nevertheless, when the KPIs are defined consistently over time,unique circumstances might explain developments, but at least the burden of proof is placed on thoseclosest to the situation. Furthermore, when documented performance improves, both the operator andthe oversight agency can take some credit for positive trends (as depicted later in Section 3.3).2.5 Recognize basic operating conditions as well as unique opportunities (such as scale).Benchmarking scores require comparability among the units for the scores have any policy relevance.Since geography, topology, hydrology, customer density, customer incomes, scale of production, and age6
of networks are beyond current managerial control, those evaluating performance need to identifycomparable groups. In the case of Peru, researchers have grouped water utilities by comparableconditions (mountains, forest, and the coast, Corton, 2003). Empirical analysis found that unit operatingcosts were lowest in the forest due to the source of water. Without taking such conditions into account,managers could be unfairly penalized for not scoring as well as other managers. Similarly, the WRA inAlbania has three size groups—as it tries to control for the economies of scale. The standards forparticular KPIs differ across the groups. For example, the target indictor for “good performance in staffefficiency” (staff/1000 connections) is set at 10, 6 and 4—for utilities in the smallest, intermediate, andlargest markets, respectively. Most regulators utilize some system for grouping utilities they regulate toavoid inappropriate comparisons.2.6 Present comparisons in ways that are clear and appropriate for target audiences.Note that the regulatory system goes beyond the regulatory agency and the water utility operator toinclude stakeholders that are in a position to support, block, or blunt reforms that would improveperformance. Thus, communication with all stakeholders is central to gaining the trust and support ofthose supporting initiatives that could improve sector outcomes. Given the difficulties of creating an OPI(a composite indicator) that adequately captures performance, care must be taken in presenting results.In particular, excessive numerical precision is inappropriate. Arbitrarily selecting the top four firms (whenthe score for the fifth is close to that of the fourth) opens the regulator up to criticism. Note that a singlenumber is easier to interpret than a set of trends in many separate indicators. Nevertheless, it is betterto group firms into categories. Some regulatory commissions give grades of A, A-, B , B, B-, etc. Othersuse high pass, pass, and fail, where high pass means that targets are met and pass implies that there issystematic movement towards targets. Such summary categories are much easier for citizens tounderstand and better capture the inherent limitations of numerical comparisons. In addition, assessingprogress over time requires some consistency in the components of the OPI. The OECD Handbook onConstructing Composite Indicators (OECD, 2008) provides a good summary of the strengths andlimitations of OPIs.3Accuracy and Reliability of Individual KPIsAccurate and reliable KPIs enable decision-makers to track trends and identify areas needing changes;these would include operational procedures, maintenance/inventory practices, and capacity investments.For low and middle income nations, these indicators represent valuable information on whetherinfrastructure performance is improving or in decline. In the former case, those groups responsible forparticular stages of production should be rewarded for meeting targets. Managers will not tend to publishdata on declining performance. If politicians are not providing the government funds for infrastructurethat had been promised in campaigns, they are not likely to publicize weak performance either, since theirdecisions are part of the problem.Data produced and shared in a timely, consistent, comparable manner to guide, assess, and improveinfrastructure policy involves defining and collecting data, fostering cooperation, and drawing uponstakeholder input during the process. Even in small scale, community-based operations, basic recordsensure that funds are being utilized according to the agreed-upon business plan. Transparency regardingperformance promotes accountability as well. In addition, donor-sponsored initiatives are more likely toreceive follow-on funding for project expansions if those managing the project can document volumedelivered, number of customers served, service quality, collections, and other dimensions ofperformance.7
3.1 Data Quality and evidence-based decisionsManagers, policy-makers, and sector analysts would do well to pay more attention to data quality.Unreliable or inaccurate data can lead to inefficient investments and inappropriate initiatives byoperators. Reliability refers to the decision-maker’s confidence regarding how the data were collected,transmitted and stored. For example, Energy and Water Utility Regulatory Authority (EWURA) forTanzania, has adopted the International Water Association’s approach to characterizing confidence indata (EWURA, 2014). EWURA designates data as (A) having high reliability when it has “sound textualrecords, procedures, investigation or analysis properly documented and recognized as the best methodof assessment.” Reliable (or B) data have “minor shortcomings, e.g. some missing documentation,reliance on unconfirmed reports, involves some use of extrapolation.” Low reliability (C data) wouldinvolve “extrapolation from limited samples for which Grade A or B is available.” Data that is WithoutReliability (D) reflect “unconfirmed verbal reports, cursory inspections or analysis.” By identifying theprocesses underlying data collection, EWURA is explicitly evaluating the information management systemof each utility it regulates.EWURA also explicitly addresses accuracy. The range of error is used to establish four accuracy bands,from 0-5% (band 1) to “worse than plus or minus 50%” (band 4). Thus a data point labeled A2 has areliable collection system, but the range of error is still plus or minus 5% to 20%. By utilizing a standardizedconfidence indictor that builds on reliability and accuracy, EWURA is able to initiate programs thatimprove data quality over time—thus improving confidence in data collection systems and subsequentanalyses and performance comparisons.By highlighting these characteristics of data used to evaluate utility performance, the regulator isestablishing incentives to improve data collection procedures. Management’s track record on thisdimension of utility activities is given explicit attention, which then places pressure on managers tostrengthen processes used by different departments. Data quality is enhanced by ensuring thatresponsible departments provide data to a central point (thus avoiding information silos), and reviewingsource documents to reduce inaccuracies and corruption.KPIs can be classified into a set of categories that allows managers to establish responsibility within thekey departments of the regulated business (whether public or private): technical (for engineers),operational (for the engineers and accountants), financial (for the finance teams), and commercial (forthe teams facing the users). The associated key performance outcomes would then be linked to thesecategories: quality, hours/day of service (technical), non-revenue water or line losses (operational), cashflows and collections (financial), and customer complaints (indicating value for money—from thestandpoint of users).In low income, fragile, and/or conflict affected states, decision-makers tend to lack source documentscontaining basic data on sector characteristics and performance. Nevertheless, it is important thatfinancial reports be produced so analysts can see the linkages among the three major financial records:income statements, balance sheets, and statements of cash flows. In addition, managers (and regulators)should have access to the following: Asset registries (installation date, capacity, location, maintenance records),Business Plans (with targets and descriptions of managerial incentives for meeting those targets)8
Operating statistics (number of workers, number of customers, reliability, service quality, etc.)In all cases, the focus should be on improving the accuracy and reliability of the data underlying basicorganizational records that provide the “raw material” for constructing KPIs. Such information also helpsinvestors considering public-private partnerships and bond purchases to better understand conditions on(and under) the ground, reducing risks associated with “negative surprises”. However, such informationis often lacking in low income countries due to a number of factors:a. Records might have been destroyed during a conflict;b. Data may be scattered and hard to access (stored under “bad” conditions—high humidity orretained in “information silos”);c. Data collection and authentication might not be a high priority relative to just getting service tocitizens;d. Lack of staff capacity with regards to basic accounting and information systems;e. Current management avoids transparency so that the true state of operations will not be availableto those critical of current outcomes;f.Some managers avoi
Key Performance Indicators (KPIs) are widely recognized as a basis for evaluating water utility . staff development programs, and long term hydrological conditions. Traditional KPIs often do not include these dimensions of performance involving long term outcomes. Thus, one limitation of KPIs is the tendency to focus on areas that reflect .