Transcription
Contact Center Benchmark ReportSample Contact CenterPrincipal InvestigatorBruce BelfioreSenior Research ExecutiveJohn ChatterleyDirector, Research & AnalysisDavid RaiaAlan PottkotterSenior Research AnalystDirector of Information TechnologyBenchmarkPortalCONFIDENTIAL INFORMATIONThis report generated on Thursday, February 16, 2017Report ID : 9999Copyright 2017, BenchmarkPortal, LLC126 E. Constance Avenue Santa Barbara, CA 93105This report may not be copied, scanned, or reproduced in any mannerwww.BenchmarkPortal.comPG(1)
Sample IndustryName:Company:John DoeCity:Any CitySample CompanyState:Any -0000Country:USAIndustry Sector:Sample IndustryThe data in this Sample Report are not real. They are for illustrative purposes only.Copyright 2017, BenchmarkPortal,, 126 E. Constance Avenue Santa Barbara, CA 93105 All Rights Reserved.Unless permission is granted, this material may not be copied, reproduced or coded for reproduction by any electrical, mechanical or chemical process or combination thereof,now known or later developed. For any questions or comments, please contact surveys@benchmarkportal.com.Copyright 2017, BenchmarkPortal, LLC126 E. Constance Avenue Santa Barbara, CA 93105This report may not be copied, scanned, or reproduced in any mannerwww.BenchmarkPortal.comPG(2)
Sample IndustryExecutive SummaryResearchers at BenchmarkPortal have continued the work begin at Purdue University in 1995, collecting contact center performance dataand providing actionable benchmarking reports to contact center managers. Although there are many parameters to measure in a contactcenter, twenty-two Key Performance Indicators (KPIs) have been found to strongly correlate to optimizing the quality and quantity of callshandled.BenchmarkPortal was awarded a U.S. Patent for its unique methodology of benchmarking call centers. That methodology has been utilized inpreparing this report.The report includes the following elements:1. Tables of key classification characteristics,2. A performance matrix that compares you to your industry,3. A table of KPIs that indicate the effectiveness (or quality) of your call center,4. A table of KPIs that indicate the efficiency (or cost elements) of your call center, Aggregated multichannel tables of KPIs and All Industries*multichannel comparisons, and6. Our glossary of terms and definitions.Our benchmark reports have been used by call center managers around the world to:a) Establish an objective baseline of current performance against industry peers.b) Identify strengths to be cultivated and weaknesses to be addressed.c) Create roadmaps for improvement.d) Lead toward certification as a Call Center of Excellence under the program administered by BenchmarkPortal.As such, our reports have shown themselves to be practical, actionable tools for directional and continuous improvement.Copyright 2017, BenchmarkPortal, LLC126 E. Constance Avenue Santa Barbara, CA 93105This report may not be copied, scanned, or reproduced in any mannerwww.BenchmarkPortal.comPG(3)
Sample IndustrySection I: Contact Center Classification MetricsIn comparing a contact center's performance to its peers in the same industry, it is useful to have some basic statistical informationregarding the other call centers in the industry. This Section exhibits those "demographic" metrics, such as call center size in terms ofvolume of calls handled, number of agents, IVR statistics, and the likeContact Center Profile MetricsThe data in this Sample Report are not real. They are for illustrative purposes only.MetricYour ValueIndustry AverageInbound Calls Offered1,389,5291,383,141Annual Inbound Call Volume Handled by Agents1,035,6171,078,782Annual Inbound Call Volume Handled by the IVR198,423191,6125.00%5.00%Percent Consumer to Business95.00%95.00%Organized Labor (Union) -YesN/A0.00%Organized Labor (Union) -NoY100.00%Full-Time Agents135110Part-Time Agents96Percent Business to BusinessCopyright 2017, BenchmarkPortal, LLC126 E. Constance Avenue Santa Barbara, CA 93105This report may not be copied, scanned, or reproduced in any mannerwww.BenchmarkPortal.comPG(4)
Sample IndustrySection I (Continued)Contact Center Classification MetricsWhere Agents Spend Their TimeMetricRespond to Inbound CallsInitiate Outbound CallsRespond to E-mailRespond to On-line Web-chatsOtherYour ValueIndustry .00%0.00%Your ValueIndustry .00%0.30%0.85%0.00%Your ValueIndustry Average 5,304,193 14.20 11.50 32,026,626 16.99 15.05Contact TypesMetricCustomer Service (questions and inquiries)Order Taking and Order TrackingTechnical SupportComplaintsRe-directing Inbound CallsOtherContact Center CostsMetricAnnual Call Center BudgetAverage Hourly Wage for Front-line AgentsAverage Hourly Starting WageCopyright 2017, BenchmarkPortal, LLC126 E. Constance Avenue Santa Barbara, CA 93105This report may not be copied, scanned, or reproduced in any mannerwww.BenchmarkPortal.comPG(5)
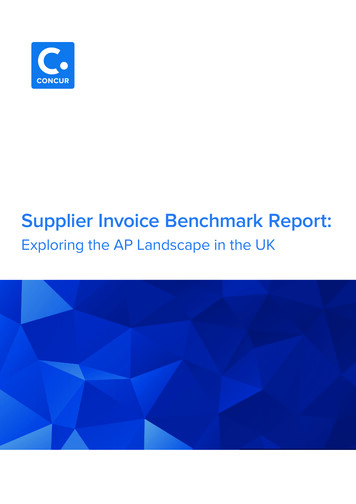
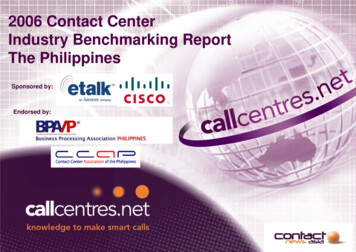
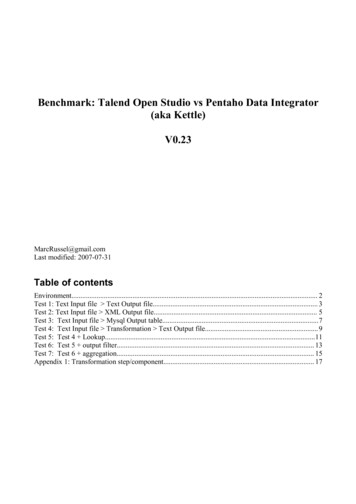
Sample IndustrySection II: Voice Channel - Performance MatrixThe challenge of every contact center manager is to balance the quality and quantity of inbound calls handled. The patented BenchmarkPortal processesinclude the Performance Matrix. The Performance Matrix combines quantity KPIs on the x-axis, i.e., metrics like calls/agent/hour, average talk time, agentutilization and the like (see Section III) with quality KPIs on the y-axis, i.e., metrics like average speed of answer, time on hold and the like (see Section IV)Effectiveness Index (Quality)10.005.000.00-5.00-10.00-10-5051 10Efficiency Index (Quantity/Cost)* Star position is based upon the accuracy of data you provided. Missing metrics will decrease the accuracy of your star position.Copyright 2017, BenchmarkPortal, LLC126 E. Constance Avenue Santa Barbara, CA 93105This report may not be copied, scanned, or reproduced in any mannerwww.BenchmarkPortal.comPG(6)
Sample IndustrySection III: EfficiencyKey Performance Indicators –Voice ChannelThis section brings together those efficiency-related (productivity) Inbound Call KPIs that are critical to contact center managers for bothmanagement and improvement initiatives. The table below contains eleven cost-related KPIs that are indicative of a contact center's costefficiency. Statistics shown include the industry average and gap for each KPI as computed from our database.MetricYour ValueIndustry AverageGapInbound Calls per Agent per Hour6.816.800.01Cost per Inbound Call in Dollars 2.25 25.21 22.96Average Inbound Call Talk Time in Minutes4.134.450.32Average Inbound After Call Work in Minutes1.150.66-0.49Agent Utilization in Percent68.42%75.46%-7.03%Agent Occupancy in Percent87.69%84.17%3.52%Adherence to Schedule in Percent93.60%88.95%4.66%Average Agent Attendance in Percent96.00%94.50%1.50%Inbound Call Auxiliary Time in 8%-10.63%Agents/Supervisor RatioTurnover of Full-time Agents in PercentNote: Gaps which have a negative impact on cost efficiency are shown in red with a minus sign. Gaps in blue without a minus sign have a positive impact on costefficiency relative to the industry average.Copyright 2017, BenchmarkPortal, LLC126 E. Constance Avenue Santa Barbara, CA 93105This report may not be copied, scanned, or reproduced in any mannerwww.BenchmarkPortal.comPG(7)
Sample IndustrySection IV: EffectivenessKey Performance Indicators – Voice ChannelThe table below contains the eleven KPIs most indicative of the contact center's effectiveness (quality). Statistics shown include the industryaverage and gap for each KPI as computed from our database.MetricYour ValueIndustry AverageGapTop Box Customer Satisfaction in Percent82.25%79.60%2.65%Bottom Box Customer Satisfaction in Percent1.50%2.07%0.57%Top Box Agent Satisfaction in Percent42.32%34.30%8.02%Bottom Box Agent Satisfaction in Percent3.10%3.90%0.80%Inbound Calls Closed on First Call in Percent90.00%88.35%1.65%Inbound Calls Average Speed of Answer in Seconds91.0088.75-2.25Inbound Calls Transferred in Percent5.00%7.36%2.36%Average Hold Time Inbound Calls in Seconds79.0084.505.50Average Time in Queue Inbound Calls in Seconds112.50108.36-4.14Average Inbound Calls Abandoned in Percent6.56%8.88%2.32%Note: Gaps which have a negative impact on cost efficiency are shown in red with a minus sign. Gaps in blue without a minus sign have a positive impact on costefficiency relative to the industry average.Copyright 2017, BenchmarkPortal, LLC126 E. Constance Avenue Santa Barbara, CA 93105This report may not be copied, scanned, or reproduced in any mannerwww.BenchmarkPortal.comPG(8)
Sample IndustrySection V: Multi Channel MetricsKey Performance IndicatorsMultichannel KPI comparisons depicted in this section aggregate multichannel data for All Industries in our growing database until such timeas sufficient data has been gathered and validated to allow Industry-specific comparisons. “All Industry” comparisons with your Industry areuseful for directional insights into performance improvement but are not to be considered definitive for a specific Industry.Annual VolumeYour ValueAll Industry Average790,729195,363E-Mail Annual Total VolumeN/A71,844Social Media Annual VolumeN/A8,472Web Chat Annual VolumeN/A34,461Postal Mail Annual VolumeN/A80,425Fax Annual VolumeN/A17,405Other Annual VolumeN/A74,391Outbound Calls Annual VolumeCopyright 2017, BenchmarkPortal, LLC126 E. Constance Avenue Santa Barbara, CA 93105This report may not be copied, scanned, or reproduced in any mannerwww.BenchmarkPortal.comPG(9)
Sample IndustrySection V (Continued)Multi Channel All Industry MetricsOutbound CallsOutbound CallsYour ValueAll Industry AverageGapOutbound Calls Average Talk Time in MINUTES3.803.26-0.54Outbound Calls After Call Work Time in MINUTES2.501.39-1.11 3.20 5.44 2.24Your ValueAll Industry AverageGapE-mail Response Time in HOURSN/A13.88N/AE-mail Average Handle Time in MINUTESN/A7.65N/AE-mail First Contact Resolution Rate PercentN/A83.59%N/AE-mail Contact Upsell RateN/A9.90%N/AE-mail Average Cost PerN/A 8.48N/AYour ValueAll Industry AverageGapSocial Media Response Time in HOURSN/A2.51N/ASocial Media Average Handle Time in MINUTESN/A6.96N/ASocial Media Cost PerN/A 5.72N/AOutbound Calls Average Cost PerE-mailE-mailSocial MediaSocial MediaCopyright 2017, BenchmarkPortal, LLC126 E. Constance Avenue Santa Barbara, CA 93105This report may not be copied, scanned, or reproduced in any mannerwww.BenchmarkPortal.comPG(10)
Sample IndustrySection V (Continued)Multi Channel All Industry MetricsWeb ChatWeb ChatYour ValueAll Industry AverageGapWeb Chat Response Time in SECONDSN/A68.83N/AWeb Chat Average Handle Time in MINUTESN/A10.86N/AWeb Chat First Contact Resolution Rate PercentN/A79.59%N/AWeb Contact Upsell RateN/A9.50%N/AWeb Chat Cost PerN/A 11.29N/AYour ValueAll Industry AverageGapPostal Mail Handle Time in MINUTESN/A7.12N/APostal Mail Cost PerN/A 8.97N/AYour ValueAll Industry AverageGapFax Average Handle Time in MINUTESN/A6.60N/AFax Mail Cost PerN/A 6.83N/AYour ValueAll Industry AverageGapOther Average Handle Time in MINUTESN/A11.75N/AOther Cost PerN/A 14.94N/APostal MailPostal MailFaxFaxOtherOtherCopyright 2017, BenchmarkPortal, LLC126 E. Constance Avenue Santa Barbara, CA 93105This report may not be copied, scanned, or reproduced in any mannerwww.BenchmarkPortal.comPG(11)
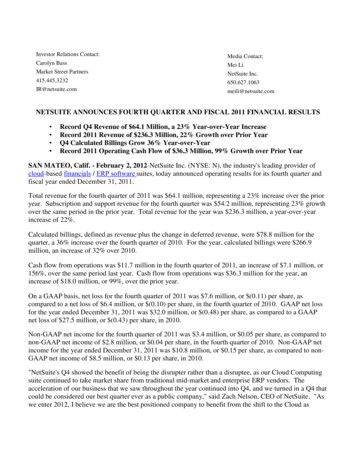
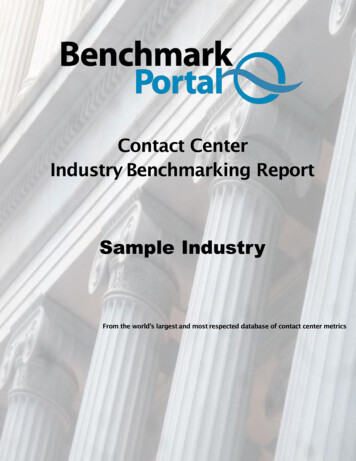
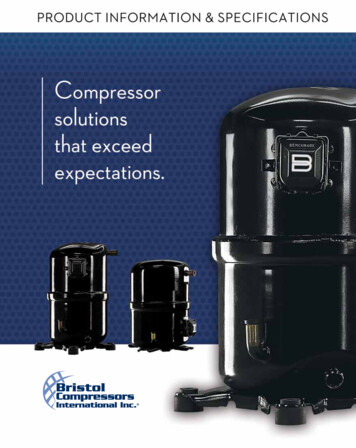
Sample IndustrySection VI: Customer SatisfactionFormal Collection ProcessThe graphic below represents the percent of Centers that have a formal mechanism to collect Customer Satisfaction. It is difficult to imagineeffective improvement programs that do not include “the Voice of the Customer” in one form or another.75%80%70%60%50%25%40%30%20%10%0%Percent YesCopyright 2017, BenchmarkPortal, LLC126 E. Constance Avenue Santa Barbara, CA 93105This report may not be copied, scanned, or reproduced in any mannerPercent Nowww.BenchmarkPortal.comPG(12)
Sample IndustryAppendix ABenchmarkPortal BackgroundBenchmarkPortal hosts a data mart of key performance metrics, collected from thousands of call centers. This database, which originatedat Purdue University (Indiana, U.S.A.) under Dr. Jon Anton and Professor Richard Feinberg, has become the worldwide source for bestpractice information for customer service, sales, collections, and technical support call centers.BenchmarkPortal manages the International Benchmarking Community, which is a membership organization of call center managers andquality assurance professionals dedicated to using best practice comparison information as a key management decision driver.Bruce Belfiore now leads this research into best practices. The BenchmarkPortal team publishes books and white papers to educatecontact center managers. They continually strive to identify best practices in all aspects of contact center operations.In addition to best practices benchmarking and research, BenchmarkPortal offers the following to the contact center community: Center of Excellence Certification to Contact Centers that are among the highest performers in their industries. Performance assessments for contact centers Specialized consulting assignments. (see "core competencies" on next page) Certificated training for call center professionals through the College of Call Center ence.com/) Automated benchmarking services (iBenchmark) to facilitate continuous improvement programs for contact centers in all sectors.Copyright 2017, BenchmarkPortal, LLC126 E. Constance Avenue Santa Barbara, CA 93105This report may not be copied, scanned, or reproduced in any mannerwww.BenchmarkPortal.comPG(13)
Sample IndustryAppendix BCore Competencies of the BenchmarkPortal TeamAgent recruiting and screeningOutsourcing selection and contractingQuality assurance measurementBenchmarking best-in-classElectronic commerceRFP preparation and fieldi
preparing this report. The report includes the following elements: 1. Tables of key classification characteristics, 2. A performance matrix that compares you to your industry, 3. A table of KPIs that indicate the effectiveness (or quality) of your call center, 4. A table of KPIs that indicate the efficiency (or cost elements) of your call center, Aggregated multichannel tables of KPIs and All Industries*