Transcription
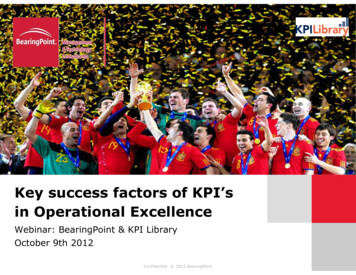
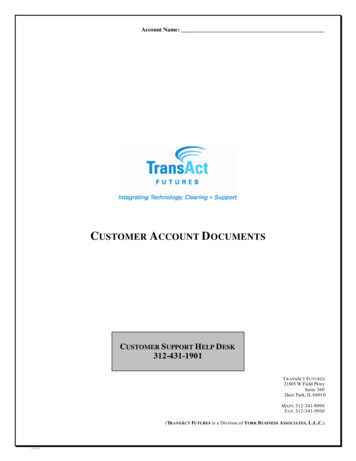
TMKey Performance Indicators Benchmarking Data Modeling- ActPoint KPI 20 20 Key Performance Indicators. Entry-level “Starter Package” for smaller school districts.FINANCE - 5 Measures Fund Balance Ratio (A) UnassignedFund Balance Ratio (B) UncommittedFund Balance Ratio (C) UnrestrictedGrant Funds As Percent Of Total BudgetWorkers’ Compensation Cost Per EmployeeINFORMATION TECHNOLOGY - 3 Measures IT Spending Per Student IT Spending Percent Of District Budget Network - Bandwidth Per StudentOPERATIONS - 10 Measures Food Services: Cost per MealFood Services: Meals Per Labor HourTransportation: Cost Per Mile OperatedM&O: Custodial Work - Cost Per Square FootM&O: Custodial WorkloadM&O: Cost Per StudentM&O: Costs Percent Of District BudgetM&O: Routine Maintenance - Cost Per Square FootM&O: Utility Costs - Cost Per Square FootM&O: Work Order Completion Time (Days)HUMAN RESOURCES - 2 Measures Teacher Retention - Average For 1-5 Years Teacher Vacancies On First Day of SchoolEnrollment1 - 500AnnualLicense Fee 750501-1,000 1,0001,001-2,500 1,5002,501-5,000 2,0005,001-10,000 2,500Annual license fee includes: Automated surveys Real-time dashboards Comparative analytics Multiple filtering options Data modeling Data scrubbing Dedicated account manager Phone, email and live chat supportSUBSCRIPTION OPTIONS (4): For more information, go to:www.actpoint.comActPoint KPI 20: 20 KPIsActPoint KPI Standard: 50 KPIsActPoint KPI Plus: 100 KPIsActPoint KPI PRO: 500 KPIs 2014-2015 Council of the Great City Schools. All Rights Reserved. 2015 TransACT Communications, Inc. All Rights Reserved. ActPoint is a registered trademark ofTransACT Communications, Inc.Measures accurate as of 3/31/2015. Measures subject to change without notice.
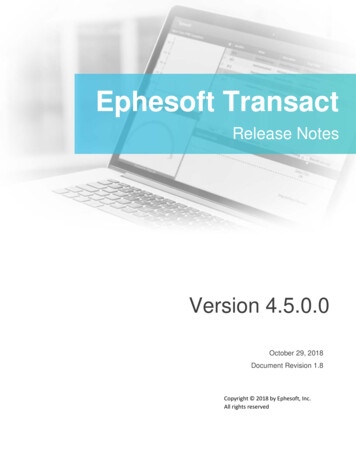
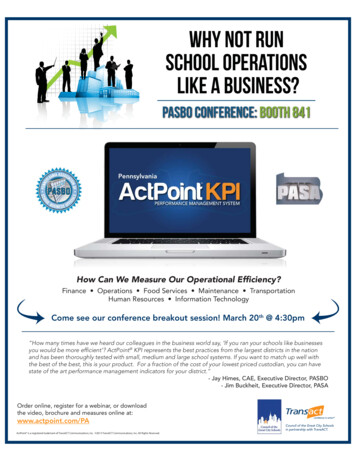
ActPoint KPITM: 50Key Performance Indicators Benchmarking Data Modeling- ActPoint KPI Standard 50 Key Performance Indicators. Recommended for districts between 1-5,000 enrollment.FINANCE - 20 MeasuresINFORMATION TECHNOLOGY - 7 MeasuresAccounts Payable AP Cost Per 100K Revenue AP Cost Per InvoiceCash Management Cash Flow - Short-Term Loans Per 100K Revenue Investment Earnings Per 100K RevenueCompensationFood ServicesFinancial Management Debt Servicing Costs Ratio To District Revenue Expenditures Efficiency - Final Budget As Percent OfActual Fund Balance Ratio (A) Unassigned Fund Balance Ratio (B) Uncommitted Fund Balance Ratio (C) Unrestricted Revenues Efficiency - Final Budget As Percent OfActualGrants Management Grant Funds As Percent Of Total Budget Grant-Funded Staff As Percent Of District FTEsProcurementCompetitive Procurements RatioProcurement Cost Per 100K SpendProcurement Cost Per Purchase OrderProcurement Savings RatioStrategic Sourcing Ratio Breakfast Participation Rate (Districtwide)Cost Per MealFood Cost Per MealFund Balance As Percent Of RevenueLunch Participation Rate (Districtwide)Supper Participation Rate (Districtwide)Total Costs As Percent Of RevenueMaintenance & Operations Custodial Work - Cost Per Square FootCustodial WorkloadMajor Maintenance - Cost Per StudentRenovations - Cost Per StudentRoutine Maintenance - Cost Per Square FootSafety & Security Risk Management Cost Of Risk per Student Workers’ Compensation Cost Per EmployeeHUMAN RESOURCES - 4 Measures Devices - Average Age Of ComputersDevices - Computers Per EmployeeDevices Per StudentIT Spending Per StudentIT Spending Percent Of District BudgetIT Spending Spending Per District FTENetwork - Bandwidth Per StudentOPERATIONS - 19 Measures Payroll Cost Per Pay Check Incidents - People Incidents Per 1,000 StudentsS&S Expenditures Per 1,000 StudentsS&S Expenditures Percent Of District BudgetS&S Staff Per 1,000 StudentsTransportation Bus Fleet - Average Age Of Fleet Cost Per Mile Operated Cost Per RiderSubstitute Placement RateTeacher Absences Per TeacherTeacher Retention - Average For 1-5 YearsTeacher Vacancies On First Day of SchoolFor more information, go to:www.actpoint.com 2014-2015 Council of the Great City Schools. All Rights Reserved. 2015 TransACT Communications, Inc. All Rights Reserved. ActPoint is a registered trademark of TransACT Communications, Inc.Measures accurate as of 3/31/2015. Measures subject to change without notice.
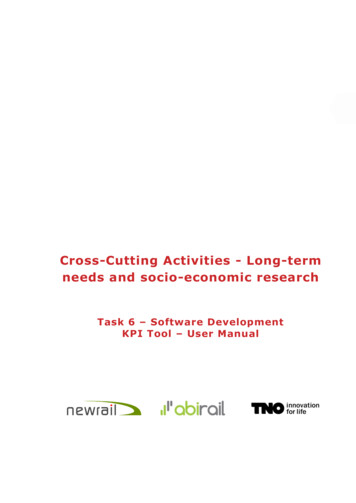
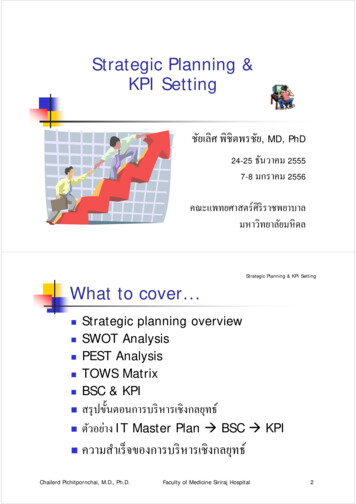
ActPoint KPIPlus: 100TMKey Performance Indicators Benchmarking Data Modeling- ActPoint KPI Plus -100 Key Performance Indicators. Recommended for districts between 5,001-19,999 enrollment.FINANCE - 39 Measures AP Cost Per 100K RevenueAP Cost Per InvoiceCash Flow - Months Above Liquidity BaselineCash Flow - Short-Term Loans Per 100K RevenueCompetitive Grant Funds As Percent Of TotalCompetitive Procurements RatioCooperative Purchasing RatioCost Of Risk per StudentDebt Principal Ratio To District RevenueDebt Servicing Costs Ratio To District RevenueExpenditures Efficiency - Adopted Budget As Percent Of ActualExpenditures Efficiency - Final Budget As Percent Of ActualFund Balance Ratio (A) UnassignedFund Balance Ratio (B) UncommittedFund Balance Ratio (C) UnrestrictedGrant Funds As Percent Of Total BudgetGrant-Funded Staff As Percent Of District FTEsInvestment Earnings Per 100K RevenueInvoices - Days To ProcessInvoices Processed Per FTE per MonthP-Card Purchasing RatioPALT For Informal SolicitationsPALT For Invitations for BidsPALT For Requests for ProposalsPay Checks Processed Per FTE per MonthPayroll Cost Per 100K SpendPayroll Cost Per Pay CheckProcurement Cost Per 100K SpendProcurement Cost Per Purchase OrderProcurement Savings RatioReturned Grant Funds Per 100K Grant RevenueRevenues Efficiency - Adopted Budget As Percent Of ActualRevenues Efficiency - Final Budget As Percent Of ActualStrategic Sourcing RatioWarehouse Operating Expense RatioWarehouse Stock Turn RatioWorkers’ Compensation Cost Per 100K Payroll SpendWorkers’ Compensation Cost Per EmployeeWorkers’ Compensation Lost Work Days Per 1,000 EmployeesHUMAN RESOURCES - 10 Measures Substitute Placement RateTeacher Absences Per TeacherTeacher Retention - Average For 1-5 YearsTeacher Vacancies On First Day of SchoolTime To Fill Vacancies - Instructional SupportTime To Fill Vacancies - Non-School ExemptTime To Fill Vacancies - Non-School Non-ExemptTime To Fill Vacancies - School-Based ExemptTime To Fill Vacancies - School-Based Non-ExemptTime To Fill Vacancies - TeachersPhillip Smith - Brand Managerphillip@transact.com 425-977-2120 www.actpoint.comOPERATIONS - 37 Measures Accidents - Miles Between AccidentsAccidents - Miles Between Preventable AccidentsBreakfast Participation Rate (Districtwide)Bus Equipment - GPS TrackingBus Fleet - Alternatively-Fueled BusesBus Fleet - Average Age Of FleetBus Fleet - Daily Buses As Percent Of Total BusesBus Fleet In Service DailyBus Usage - Daily Runs Per BusCost Per BusCost Per MealCost Per Mile OperatedCost Per RiderCustodial Work - Cost Per Square FootCustodial WorkloadFood Cost Per MealFood Cost Per RevenueFund Balance As Percent Of RevenueIncidents - Assault/Battery Incidents Per 1,000 StudentsIncidents - People Incidents Per 1,000 StudentsLabor Costs Per RevenueLunch Participation Rate (Districtwide)M&O Cost Per StudentM&O Costs Percent Of District BudgetMajor Maintenance - Cost Per StudentMeals Per Labor HourOn-Time PerformancePersonnel - Buses per MechanicRenovations - Cost Per StudentRoutine Maintenance - Cost Per Square FootS&S Expenditures Per 1,000 StudentsS&S Expenditures Percent Of District BudgetS&S Staff Per 1,000 StudentsSupper Participation Rate (Districtwide)Total Costs As Percent Of RevenueUtility Costs - Cost Per Square FootWork Order Completion Time (Days)INFORMATION TECHNOLOGY - 14 Measures Devices - Advanced Presentation Devices Per TeacherDevices - Average Age Of ComputersDevices - Computers Per EmployeeDevices Per StudentIT Spending Per StudentIT Spending Percent Of District BudgetIT Spending Spending Per District FTENetwork - Bandwidth Per StudentNetwork - Bandwidth Per UserSupport - Break/Fix Staffing Cost Per TicketSupport - First Contact Resolution RateSupport - Help Desk Call Abandonment RateSupport - Help Desk Staffing Cost Per TicketSupport - Mean Time To Resolve Tickets 2014-2015 Council of the Great City Schools. All Rights Reserved. 2015 TransACT Communications, Inc. All Rights Reserved. ActPoint is a registered trademark of TransACT Communications, Inc.Measures accurate as of 3/31/2015. Measures subject to change without notice.
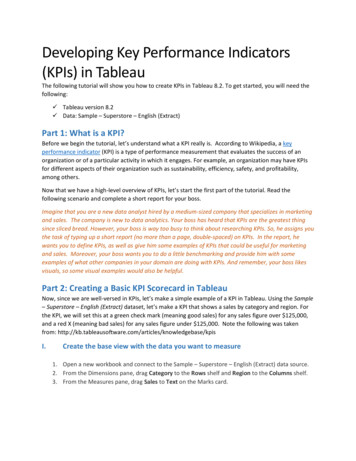
ActPoint KPIPRO: 500 TMKPI Measureswww.actpoint.com
ActPoint KPIPRO: 500 TMAccounts Payable - 18 Measures AP Cost Per 100K Revenue AP Cost Per Invoice AP Staff - Accountants With AP Certificate AP Staff - Accountants With CPA AP Staff - Cost Per FTE AP Staff - District FTEs Per AP FTE AP Staffing Ratio - Clerical And Support AP Staffing Ratio - Managers AP Staffing Ratio - Professionals AP Staffing Ratio - Supervisors Invoices - Days To Process Invoices - Past Due at Time of Payment Invoices - Percent Paid Electronically Invoices - Percent Received Electronically Invoices Processed Per FTE per Month Payments Voided Payments Voided Due To Duplication Payments Voided Due To ErrorCash Management - 12 Measures Cash Flow - Months Above Liquidity Baseline Cash Flow - Short-Term Loans Per 100K Revenue Cash/Investment Equity Per 100K Revenue Investment Earnings As Percent Of Cash/Investment Equity Investment Earnings Per 100K Revenue Treasury Staff - Cost Per FTE Treasury Staff - District FTEs Per Treasury FTE Treasury Staffing Cost Per 100K Revenue Treasury Staffing Ratio - Clerical And Support Treasury Staffing Ratio - Managers Treasury Staffing Ratio - Professionals Treasury Staffing Ratio - SupervisorsCompensation - 20 Measures Pay Checks - Direct Deposits Pay Checks - Errors Per 10K Payments Pay Checks - Percent Off-Cycle Pay Checks Processed Per FTE per Month Payroll Cost Per 100K Revenue Payroll Cost Per 100K Spend Payroll Cost Per Pay Check Payroll Outsourcing As Percent Of Costs Payroll Staff - Cost Per FTE Payroll Staff - District FTEs Per Payroll FTE Payroll Staff - Overtime Hours Per FTE Payroll Staffing Ratio - Clerical And Support Payroll Staffing Ratio - Managers Payroll Staffing Ratio - Professionals Payroll Staffing Ratio - Supervisors Personnel Record Self-Service Usage per District FTE Personnel Records Self-Service Usage: Address Changes Personnel Records Self-Service Usage: Direct Deposit Changes Personnel Records Self-Service Usage: W-4 Changes W-2 Correction Rate (W-2C)OperationsFinanceHuman ResourcesInformation Technologywww.actpoint.comPage 1Financial Management - 19 Measures Annual Financial Report - Days To Publish Budget Amendments Debt Principal Ratio To District Revenue Debt Servicing Costs Ratio To District Revenue Debt Servicing Costs Ratio To total Debt Expenditures Efficiency - Adopted Budget As Percent Of Actual Expenditures Efficiency - Final Budget As Percent Of Actual Fund Balance - Percent (A) Unassigned Fund Balance - Percent (B) Assigned Fund Balance - Percent (C) Committed Fund Balance - Percent (D) Restricted Fund Balance - Percent (E) Nonspendable Fund Balance Ratio (A) Unassigned Fund Balance Ratio (B) Uncommitted Fund Balance Ratio (C) Unrestricted Fund Balance Ratio (D) All Except Nonspendable Fund Balance Ratio (E) All Types Revenues Efficiency - Adopted Budget As Percent Of Actual Revenues Efficiency - Final Budget As Percent Of ActualGrants Management - 15 Measures Amendments To Grant Budgets Competitive Grant Funds As Percent Of Total Days To Access New Grant Funds Grant Funds - Percent Federal Grant Funds - Percent Local/Private Grant Funds - Percent State Grant Funds As Percent Of Total Budget Grant-Funded Staff As Percent Of District FTEs Grants Receivables Aging Grants Receivables Aging - Days To Process Grants Receivables Aging - Days To Receive Payment Returned Grant Funds - Federal Returned Grant Funds - Local/Private Returned Grant Funds - State Returned Grant Funds Per 100K Grant RevenueProcurement - 59 Measures Competition-Eligible Procurements - Percent Emergency Competition-Eligible Procurements - Percent Non-Authorized Competition-Eligible Procurements - Percent Of Total Spending Competition-Eligible Procurements - Percent Sole-Source Competitive Procurements Ratio Construction - Percent Of Purchasing Construction Contracts Awarded Cooperative Purchasing Ratio Cooperative Purchasing Ratio - Excluding P-Cards M/WBE Vendor Utilization P-Card Average Transaction Amount P-Card Purchasing Ratio P-Card Single Transaction Limit PALT For Informal Solicitations PALT For Invitations for Bids 2014-2015 Council of the Great City Schools. All Rights Reserved. 2015 TransACT Communications, Inc. All Rights Reserved. ActPoint is a registered trademark of TransACT Communications, Inc.Measures accurate as of 3/31/2015. Measures subject to change without notice.
ActPoint KPIPRO: 500 TMOperationsFinanceHuman ResourcesInformation Technologywww.actpoint.comPage 2Procurement Continued.Risk Management - 14 Measures PALT For Invitations for Bids - (A) Days to Prepare Cost Of Risk per Student PALT For Invitations for Bids - (B) Days of Advertising And Open Liability Claims - Percent LitigatedBidding Liability Claims - Percent Open As Of Year-End PALT For Invitations for Bids - (C) Days to Issue After Close Liability Claims Per 1,000 Students PALT For Requests for Proposals Liability Cost Per Claim PALT For Requests for Proposals - (A) Days to Prepare Liability Cost Per Student PALT For Requests for Proposals - (B) Days Proposals Accepted Workers’ Compensation Claims - Percent Indemnity PALT For Requests for Proposals - (C) Days to Issue After Close Workers’ Compensation Claims - Percent Litigated Procurement Cost Per 100K Spend Workers’ Compensation Claims Per 1,000 Employees Procurement Cost Per Purchase Order Workers’ Compensation Cost Per 100K Payroll Spend Procurement Costs Per 100K Revenue Workers’ Compensation Cost Per Claim Procurement Costs Ratio - Outsourced Services Workers’ Compensation Cost Per Employee Procurement Costs Ratio - Personnel Workers’ Compensation Lost Work Days Per 1,000 Employees Procurement Savings - Percent Through Informal Solicitations Workplace Incidents Per 1,000 Employees Procurement Savings - Percent Through Invitations For Bids Procurement Savings - Percent Through Requests For Proposals Procurement Savings Ratio Procurement Staff - Cost Per FTE Procurement Staff - District FTEs Per Procurement FTE Procurement Staff With Professional Certificate Procurement Staffing Ratio - Professional Staff Procurement Staffing Ratio - Supervisors And Managers Procurement Staffing Ratio - Support And Clerical Strategic Sourcing Ratio Threshold For formal Proposal Threshold For formal Sealed Bid Threshold For School Board Approval Warehouse Number Of Unique Items Warehouse Number Of Unique Items - Facility Maintenance Warehouse Number Of Unique Items - Food Services Warehouse Number Of Unique Items - School/office Supplies Warehouse Number Of Unique Items - Textbooks Warehouse Number Of Unique Items - TransportationMaintenance Warehouse Operating Expense Ratio Warehouse Operating Expense Ratio - Facility MaintenancePhillip Smith Warehouse Operating Expense Ratio - Food ServicesBrand Manager Warehouse Operating Expense Ratio - School/Office SuppliesTransACT Communications, Inc. Warehouse Operating Expense Ratio - Textbooksphillip@transact.com Warehouse Operating Expense Ratio - Transportation425-977-2120Maintenance Warehouse Stock Turn Ratio Warehouse Stock Turn Ratio - Facility Maintenancewww.actpoint.com Warehouse Stock Turn Ratio - Food Services Warehouse Stock Turn Ratio - School/Office Supplies Warehouse Stock Turn Ratio - Textbooks Warehouse Stock Turn Ratio - Transportation Maintenance 2014-2015 Council of the Great City Schools. All Rights Reserved. 2015 TransACT Communications, Inc. All Rights Reserved. ActPoint is a registered trademark of TransACT Communications, Inc.Measures accurate as of 3/31/2015. Measures subject to change without notice.
ActPoint KPIPRO: 500 TMFood Services - 97 Measures Breakfast Access - During Breakfast Break Breakfast Access - Served In The Cafeteria Breakfast Access - Served In The Classroom Breakfast Access - Universal Free Breakfast Breakfast Access Rate Breakfast Access Rate, Elementary/K-8 Breakfast Access Rate, High School Breakfast Access Rate, Middle School Breakfast F/RP Participation Rate Breakfast F/RP Participation Rate, Elementary/K-8 Breakfast F/RP Participation Rate, High School Breakfast F/RP Participation Rate, Middle School Breakfast Non-F/RP Participation Rate, Elementary/K-8 Breakfast Non-F/RP Participation Rate, High School Breakfast Non-F/RP Participation Rate, Middle School Breakfast Participation Rate (Districtwide) Breakfast Participation Rate (Districtwide), Elementary/K-8 Breakfast Participation Rate (Districtwide), High School Breakfast Participation Rate (Districtwide), Middle School Breakfast Participation Rate (Districtwide), Secondary Schools Breakfast Participation Rate (Meal Sites) Breakfast Participation Rate (Meal Sites), Elementary/K-8 Breakfast Participation Rate (Meal Sites), High School Breakfast Participation Rate (Meal Sites), Middle School Cost Per Meal Cost Per Meal - Contractor-Operated Cost Per Meal - District-Operated Food Cost Per Meal Food Cost Per Revenue Fund Balance As Percent Of Revenue Indirect And Overhead Costs As Percent Of Total Costs Indirect Costs Ratio - License Fees And Contract Services Indirect Costs Ratio - Rent, Warehousing And Storage Indirect Costs Ratio - Training And Professional Development Indirect Costs Ratio - Travel, Advertising And Office Expenses Labor Costs Per Revenue Lunch Access Rate Lunch Access Rate, Elementary/K-8 Lunch Access Rate, High School Lunch Access Rate, Middle School Lunch F/RP Participation Rate Lunch F/RP Participation Rate, Elementary/K-8 Lunch F/RP Participation Rate, High School Lunch F/RP Participation Rate, Middle School Lunch Non-F/RP Participation Rate, Elementary/K-8 Lunch Non-F/RP Participation Rate, High School Lunch Non-F/RP Participation Rate, Middle School Lunch Participation Rate (Districtwide) Lunch Participation Rate (Districtwide), Elementary/K-8 Lunch Participation Rate (Districtwide), High School Lunch Participation Rate (Districtwide), Middle School Lunch Participation Rate (Districtwide), Secondary Schools Lunch Participation Rate (Meal Sites) Lunch Participation Rate (Meal Sites), Elementary/K-8 Lunch Participation Rate (Meal Sites), High School Lunch Participation Rate (Meal Sites), Middle School Management Company Share Of Total Expenditures Management Company Share Of Total Meals Meal Accountability - Percent Of Sites With POS System Meal Reimbursements - Breakfasts, Percent Free Meal Reimbursements - Breakfasts, Percent Reduced-Price Meal Reimbursements - Lunches, Percent Free Meal Reimbursements - Lunches, Percent Reduced-Price Meal Reimbursements - Supper, Percent Free Meal Reimbursements - Supper, Percent Reduced-Price Meals Per Labor Hour Operating Cost Ratio - Equipment Operating Cost Ratio - Food Operating Cost Ratio - Labor Operating Cost Ratio - Supplies And Small Wares Operating Cost Ratio - Technology Operating Cost Ratio - Utilities, Custodial And Trash Removal Operating Cost Ratio - Vehicle FleetOperationsFinanceHuman ResourcesInformation Technologywww.actpoint.com Outside Meal Services - Catering As Percent Of Revenue Outside Meal Services - Meal Sites That Are Charter/Other Outside Meal Services - Meals To Charter/Other Provision II Enrollment Rate - Breakfasts Provision II Enrollment Rate - Lunches Revenue Percentage - A La Carte and Vending Sales Revenue Percentage - Federal Meal Reimbursements ServSafe Or Equivalent Staff Per Site ServSafe-Certified Staff Per Site Supper Access Rate Supper Access Rate, Elementary/K-8 Supper Access Rate, High School Supper Access Rate, Middle School Supper Participation Rate (Districtwide) Supper Participation Rate (Districtwide), Elementary/K-8 Supper Participation Rate (Districtwide), High School Supper Participation Rate (Districtwide), Middle School Supper Participation Rate (Meal Sites) Supper Participation Rate (Meal Sites), Elementary/K-8 Supper Participation Rate (Meal Sites), High School Supper Participation Rate (Meal Sites), Middle School Total Costs As Percent Of Revenue USDA Commodities - Percent As Donations (Bonuses) USDA Commodities - Percent Of Total RevenueMaintenance & Operations - 72 MeasuresPage 1 Building Square Footage By Ownership - Percent Leased Building Square Footage By Type - Percent Modular Building Square Footage By Type - Percent Portable Building Square Footage By Type - Percent Site-Built Building Square Footage By Usage - Percent Academic Building Square Footage By Usage - Percent Non-Academic Building Square Footage By Usage - Percent Vacant Custodial Supply Cost Per Square Foot Custodial Work - Cost Per Square Foot Custodial Work - Cost Per Square Foot, Contractor-Operated Custodial Work - Cost Per Square Foot, District-Operated Custodial Work - Cost Per Student Custodial Work - Proportion Contractor-Operated Custodial Work - Staff Ratio - Field Workers Per Office Staff Custodial Work - Staff Ratio - Non-Exempt Per Exempt Field Staff Custodial Workload Deferred Maintenance - Average Cost Per Project Deferred Maintenance - Percent Of Projects Completed Deferred Maintenance Resulting In Break-Downs Green Buildings - Buildings Green Certified Green Buildings - Buildings Green Certified Or Equivalent Green Buildings - Buildings With Energy Star Certificate Grounds Work - Cost Per Acre Grounds Work - Cost Per Acre, Contractor-Operated Grounds Work - Cost Per Acre, District-Operated Grounds Work - Cost Per Student Grounds Work - Proportion Contractor-Operated Grounds Work - Staff Ratio - Field Workers Per Office Staff Grounds Work - Staff Ratio - Non-Exempt Per Exempt Field Staff M&O Cost Per Student M&O Costs Percent Of District Budget M&O Staff - Field Staff As Percent Of All Staff M&O Staff - Non-Exempt Workers As Percent Of Field Staff Major Maintenance - Supervisors/Support Staff Costs As Percent Of Total Costs Major Maintenance - Cost Per Student Major Maintenance - Delivered Construction Costs As Percent Of Total Costs Major Maintenance - Design To Construction Cost Ratio Major Maintenance - Staff Ratio - Field Workers Per Office Staff Major Maintenance - Staff Ratio - Non-Exempt Per Exempt Field Staff New Construction - Cost Per Student New Construction - Delivered Construction Costs As Percent Of Total Costs New Construction - Design To Construction Cost Ratio New Construction - Staff Ratio - Field Workers Per Office Staff New Construction - Staff Ratio - Non-Exempt Per Exempt Field Staff New Construction - Supervisors/Support Staff Costs As Percent Of Total Costs Recycling - Percent Non-Regulatory Recycling - Percent Of Total Material Stream Renovations - Cost Per Student Renovations - Delivered Construction Costs As Percent Of Total Costs 2014-2015 Council of the Great City Schools. All Rights Reserved. 2015 TransACT Communications, Inc. All Rights Reserved. ActPoint is a registered trademark of TransACT Communications, Inc.Measures accurate as of 3/31/2015. Measures subject to change without notice.
OperationsFinanceHuman ResourcesInformation TechnologyActPoint KPIPRO: 500 TMwww.actpoint.comMaintenance & Operations Continued. Renovations - Design To Construction Cost Ratio Renovations - Staff Ratio - Field Workers Per Office Staff Renovations - Staff Ratio - Non-Exempt Per Exempt Field Staff Renovations - Supervisors/Support Staff Costs As Percent Of Total Costs Routine Maintenance - Cost Per Square Foot Routine Maintenance - Cost Per Student Routine Maintenance - Cost Per Work Order Routine Maintenance - Cost Per Work Order, Contractor-Operated Routine Maintenance - Cost Per Work Order, District-Operated Routine Maintenance - Proportion Contractor-Operated, By Work Orders Routine Maintenance - Ratio Of Field Workers to office Staff Utility Costs - Cost Per Square Foot Utility Costs - Electricity Cost Per Square Foot Utility Costs - Heating Fuel Cost Per Square Foot Utility Costs - Sewer Cost Per Square Foot Utility Costs - Water Cost Per Square Foot Utility Usage - Electricity Usage Per Square Foot (KWh) Utility Usage - Heating Fuel Usage Per Square Foot (KBTU) Utility Usage - Water (Non-Irrigation) Usage Per Square Foot (Gal.) Utility Usage - Water Usage For Irrigation Work Order Cancel/Void Rate Work Order Completion Rate Work Order Completion Time (Days)Safety & Security - 52 Measures Armed Personnel - Percent Of All Field Personnel Armed Personnel - Percent Of Law Enforcement Personnel, Contracted Armed Personnel - Percent Of Security Personnel, Contracted Armed Personnel - Percent Of Security/Police Personnel, District Crisis Response Teams - Drills Per Team Crisis Response Teams - Teams Per Academic Site Health/Safety Inspections - Percent Of Academic Sites Annually Health/Safety Inspections - Percent Of Non-Academic Sites Annually Health/Safety Inspections - Sites Inspected Annually Health/Safety Violations - Average Number Days To Correct Health/Safety Violations Per Site ID Badge Required, Employees - Percent Of Academic Sites ID Badge Required, Employees - Percent Of Non-Academic Sites ID Check And Badge Required, Visitors - Percent Of Academic Sites ID Check And Badge Required, Visitors - Percent Of Non-Academic Sites Incidents - Assault/Battery Incidents Per 1,000 Students Incidents - Assaults - Firearm Incidents Per 1,000 Students Incidents - Assaults - Robbery Incidents Per 1,000 Students Incidents - Assaults - Sexual Assault Incidents Per 1,000 Students Incidents - Assaults - Weapon (Excluding Firearm) Incidents Per 1,000 Students Incidents - Bullying Incidents Response Rate Incidents - Bullying/Harassment Per 1,000 Students Incidents - Intrusion/Burglary Incidents Per Site Incidents - Larceny/Vandalism Incidents Per Site Incidents - Larceny/Vandalism Incidents Rate Of Arrests Incidents - People Incidents Per 1,000 Students Incidents - People Incidents Rate Of Arrests Incidents, Threat - Incidents Per Site Intrusion/Burglary Alarm Systems - False Alarms Per Site Intrusion/Burglary Alarm Systems - Percent Of Academic Sites Intrusion/Burglary Alarm Systems - Percent Of Non-Academic Sites Intrusion/Burglary Alarm Systems - Percent Of Sites Intrusion/Burglary Incidents - Average Minutes To Respond to Alarm Intrusion/Burglary Incidents - Percent At Non-Alarmed Sites Intrusion/Burglary Incidents - Percent Of Alarm Failures Metal Detectors, Any Kind - Academic Sites Metal Detectors, Any Kind - Non-Academic Sites Metal Detectors, Hand-Held - Academic Sites Metal Detectors, Walk-Through - Academic Sites Real-Time Video Monitoring - Percent Of Academic Sites Real-Time Video Monitoring - Percent Of Non-Academic Sites S&S Expenditures - Percent For Contracted Services S&S Expenditures - Percent For Personnel S&S Expenditures Per 1,000 Students S&S Expenditures Percent Of District Budget S&S Staff Per 1,000 Students Security Plans - Academic Sites With NIMS-Compliant Plan Training Hours Per Law Enforcement personnel, Contracted Training Hours Per Safety/Security personnelPage 2 Training Hours Per Security personnel, Contracted Training Hours Per Security/Police personnel, District Vulnerability Assessments Of Construction/Renovation Designs - Percent of ProjectsTransportation - 67 Measures Accidents - Miles Between Accidents Accidents - Miles Between Accidents (Contractor-Operated) Accidents - Miles Between Accidents (District-Operated) Accidents - Miles Between Preventable Accidents Accidents - Miles Between Preventable Accidents (Contractor-Operated) Accidents - Miles Between Preventable Accidents (District-Operated) Bus Equipment - AVL/GPS Links To Routing Software Bus Equipment - GPS Tracking Bus Equipment - Rider Harnesses, Lap Bus Equipment - Rider Harnesses, Lap-And-Shoulder Bus Equipment - Student Tracking Systems Bus Equipment - Video Cameras Bus Fleet - Alternatively-Fueled Buses Bus Fleet - Average Age Of Fleet Bus Fleet - Daily Buses As Percent Of Total Buses Bus Fleet - Maintenance Hours Per Bus Bus Fleet - Percent Contractor-Operated Bus Fleet - Percent District-Operated Bus Fleet In Service Daily Bus Inspections - Percent Passed On First Try Bus Usage - Daily Runs Per Bus Bus Usage - Daily Seat Utilization Bus Usage - Daily Seat Utilization (Contractor-Operated) Bus Usage - Daily Seat Utilization (District-Operated) Bus Usage - Live Miles Per Deadhead Mile Bus Usage - Live Miles Per Deadhead Mile (Contractor-Operated) Bus Usage - Live Miles Per Deadhead Mile (District-Operated) Bus Usage - Miles Per Bus Bus Usage - Miles Per Bus (Contractor-Operated) Bus Usage - Miles Per Bus (District-Operated) Bus Usage - Seats Filled Per Bus Run Bus Usage - Seats Filled Per Bus Run (Contractor-Operated) Bus Usage - Seats Filled Per Bus Run (District-Operated) Contract Buses - Percent Of Ridership Cost Per Bus Cost Per Bus (Contractor-Operated) Cost Per Bus (District-Operated) Cost Per Mile Operated Cost Per Rider Daily Ride Time - General Education Daily Ride Time - SWD Students Daily Ride Time, Maximum Allowed - General Education Daily Ride Ti
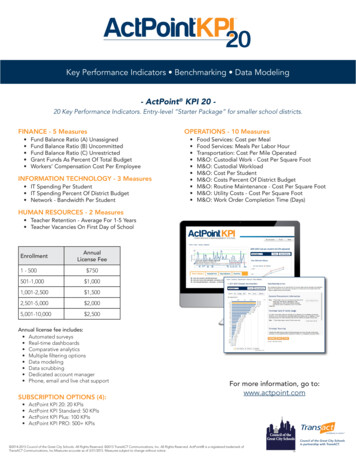
- ActPoint KPI 20 - 20 Key Performance Indicators. Entry-level "Starter Package" for smaller school districts. For more information, go to: www.actpoint.com SUBSCRIPTION OPTIONS (4): ActPoint KPI 20: 20 KPIs ActPoint KPI Standard: 50 KPIs ActPoint KPI Plus: 100 KPIs ActPoint KPI PRO: 500 KPIs