Transcription
Dynamic Mechanical Analysis (DMA)Basics and Beyondε ω Σ(Δεβ/1 ιωτβ)Dr. Lin LiThermal AnalysisPerkinElmer Inc.April 2000
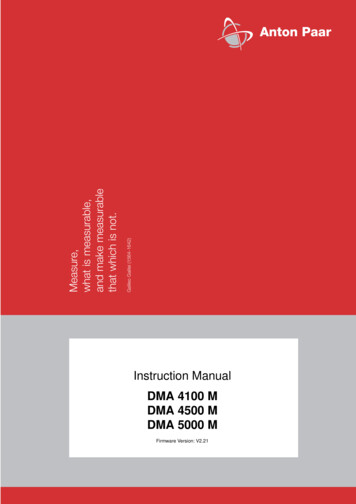
The DMA lets you relate:product propertiesmolecular structureMaterialBehaviorprocessing conditions
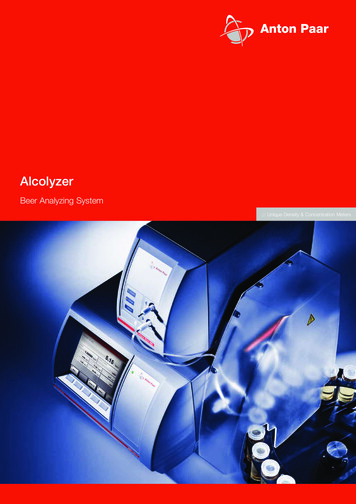
DMA Structure in generalHow the DMA works: Constant inputs and outputsfunction as in the TMAForce MotorCoilMagnet A sine wave current is addedto the force coilTemperature Enclosure The resultant sine wavevoltage of the LVDT iscompared to the sine waveforce The amplitude of the LVDT isrelated to the storage modulus,E' via the spring constant, k. The phase lag, δ, is related tothe E" via the dampingconstant, D.LVDTCore RodInterchangeableMeasuring SystemFurnaceHeat Sink/Cooling System
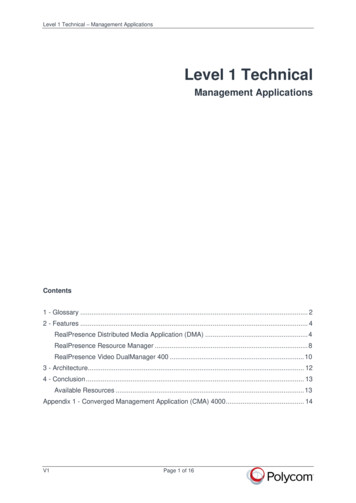
Outstanding Flexibility 1:Multiple GeometriesCompressiveShearExtensionCup & PlateFlexureParallel PlateCup & PlateTray & PlateSintered Plates3 pt. Bending4 pt. BendingAST M FlexureDual CantileverSingle CantileverExtensionShear SandwichCoaxial CylinderPaper Fold
Log E’Why?121110987654320 mm1 mm5 mm20 mm
Stress Causes Strain.LoLL-Lo ΔLCauchy orEngineering Strainε ΔL/LoHenchy orTrue Strainε ln (ΔL/Lo)Kinetic Theoryof Rubber Strainε 1/3{L/Lo-(Lo/L)2}Kirchhoff Strainε 1/2{ (L/Lo)2-1}Murnaghan Strainε 1/2{1-(Lo/L)2}The different definitions of tensile strainbecome equivalent at very small deformations.
The Elastic Limit: Hooke’sLaw σslope kStrain increaseswith increasingStressε
Real vs. Hookean StressStrain CurvesCurve 1: DMACreep Recoveryin Parallel PlateFile info: Drssr90R.2Thu Apr 14 15:16:52 1994Sample Height:3.359 mmCreep Stress: 2600.0mNDresser 90 DurameterRecovery ress (Pa x 107)1.00.8σ0.6Slope 1642965.02 Pa/%0.40.2Slope 359171.32 Pa/%0.04.0TEMP1: 20.0 CTIME1:5.3 minReal behavior8.012.0Strain (%)KPMPERKIN-ELMER7 Series ThermalAnalysis SystemThu Apr 14 16:34:38 199416.0ε
The Viscous Limit: NewtonianBehaviorσThe speed at which the fluid flowsthrough the holes (the strain rate)increases withstress!!!slope η.γ
Viscosity Effectsτ.γ Newtonian behavior is linear and theviscosity is independent of rate. Pseudoplastic fluids get thinner as shearincreases. Dilatant Fluids increase their viscosity asshear rates increase. Plastic Fluids have a yield point withpseudoplastic behavior. Thixotrophic and rheopectic fluids showviscosity-time nonlinear behavior. Forexample, the former shear thin and thenreform its gel structure.
Polymers are Non-NewtonianFluids!!! At low shear rates, theviscosity is controlled byMW. The material showsNewtonian behaviorLinearDependence Viscosity shows a linearon Ratedependence on rate abovethe ηo region. At high rates, the materialcan no longer shear thin andInfinite Shear Plateau ηa second plateau is reached. LogηZero Shear Plateau ηoLog.γ
Analyzing a Stress-StrainCurve failure (ε , σ )linearregionΒΒnonlinear regionσyield point (εy, σy)Young’s modulus (E)E εσdσ εdεLLThe area underthe curve to this lineis the energy neededto break the material
Under Continuos Loads: CreepRecovery Applying a constantload for long timesand removing it from asample. Allows one to see thedistortion underconstant load and alsohow well it recovers.
Creep is a fundamentalengineering test.Curve 1: DMACreep Recoveryin 3 Point BendingFile info: cr ptfe-5 Wed Jun 29 15:31:18 1988Sample Height:3.300 mmCreep Stress: 1.50e 06PaPTFE - CREEP/RELAXATIONRecovery Stress: 6.25e 02Pa# 1 PTFE - CREEP/RELAXATION AT -5C:cr ptfe-5Strain (%)# 2 Force (mN)2500.02250.00.00252000.01750.0Force (mN)0.0020Strain (%) Creep is used as abasic test for design. By looking at boththe creep andrecovery parts of thecurve, we can beginto examine howpolymers 00.00050.00.00000.0-250.01.02.03.04.0Time (minutes)TEMP1: -15.0 CTIME1:7.0 min5.06.07.0DMA7 APPLICATIONS LABPERKIN-ELMER7 Series ThermalAnalysis SystemThu Apr 28 20:32:20 1994
Dynamic StressForce (dynamic)ForceF (static)Timematerial responseStress FAPhase angle δAmplitude kStressStrain yo/yTime
Why? Let’s bounce a ball.E” energy loss ininternal motionE’ elasticresponse
All this is calculated from δ andk: From k, we calculate E’ (storage modulus) From δ, we calculate E’’ (loss modulus) then:Tan δ E”/E’E* E’ iE” SQRT(E’2 E”2)G* E*/2(1 ν)η 3G*/ω
To apply this to materials.Dyna mic Stress ScanσσοεοεSince each part of the ramphas a sine wave stressassociated with it, we get:tan δE*, E’, E”ηfor each data point!!
For example, DSS CurvesCurve 1: DMAAC Stress Scanin Parallel PlateFile info: Drssr70DssThu Apr 14 16:44:41 1994Frequency: 1.00 HzStress Rate: 250.0mN/minDresser 70 Durameter Tension: 110.000%Curve 1: DMAAC Stress Scanin Parallel PlateFile info: Drssr70DssThu Apr 14 16:44:41 1994Frequency: 1.00 HzStress Rate: 250.0mN/minDresser 70 Durameter Tension: 110.000%5.57)4.57)4.0s x 103.53.0Viscosity (Pa6)Complex Viscosity (Pa s x 105.04.5Dynamic Stress (Pa x 10# 2 Dresser 90 Durameter:Drssr90dss5.55.0# 1 Dresser 70 Durameter:Drssr70Dss7Complex Viscosity (Pas x 10 )2.52.01.54.03.53.02.52.01.0Slope 6297938.16 Pa/%1.50.51.0Slope 1274361.04 Pa/%0.00.20.40.6Strain (%)TEMP1: 10.5 CTIME1: -1.2 min0.81.0KPMPERKIN-ELMER7 Series ThermalAnalysis SystemThu Apr 14 16:59:58 19940.20.40.6Strain (%)TEMP1: 10.5 CTIME1: -1.2 min0.81.0KPMPERKIN-ELMER7 Series ThermalAnalysis SystemThu Apr 28 20:28:00 1994
We can heat the materialunder minimal load at acalibrated rate. This allows the materialto change withtemperature. These changes can bedescribed in terms of freevolume or relaxationtimes.Free VolumeNow, let’s induce temperatureas a variable.
Thermomechanical Analysis asa starting Point.Curve 1: TMAin PenetrationFile info: TgflexTue Oct 10 16:21:08 1995Sample Height:4.180mmDC Force: 100.0 mNTg by flex# 1 Tg by flex:TgflexPenetration (mm)7.06.56.0Onset 106.92 C5.5Penetration Temperature (C)TEMP1: 30.0 CTEMP2: 150.0 CTIME1:0.0 minRATE1: 10.0 C/min125.0150.0175.0PERKIN-ELMER7 Series Thermal Analysis SystemSun Nov 26 20:10:47 1995
TMA - It’s all free volume.Curve 1: TMAin ExpansionFile info:cteTue Oct 10 16:46:51 1995Sample Height:1.742mm DC Force: 10.0 mNcte# 1 cte :cteExpansion (mm)2.10FreeVolume2.05Expansion (mm)2.001.951.90Cx 2.195 x 10-2/C1.851.80Tg1.75Cx 2.948 x 101.7070.080.0-5Onset 105.53/C90.0Temperature (TEMP1: 30.0 CTEMP2: 150.0 CTIME1:0.0 minRATE1: 10.0 C/min100.0C)C110.0PERKIN-ELMER7 Series ThermalAnalysis SystemSun Nov 26 20:08:09 1995OccupiedVolume
And it’s not just Tg.Curve 1: TMAin ExtensionFile info:menard005 Tue Feb 21 12:28:20 1995Sample Height:12.017mm DC Force: 0.0 mNFIBER E# 1 FIBER E:menard005Extension (mm)12.2012.1812.1612.14Extension 0100.0He/20psi/H/ChillerTEMP1: 30.0 CTEMP2: 250.0 CTIME1:Temperature (0.0 minRATE1:5.0 C/min150.0C)200.0250.0Tech.Support Lab/K.MenardPERKIN-ELMER7 Series ThermalAnalysis SystemTue Feb 21 12:29:39 1995(the traditional way to do heat set)
Time Temperature Scans at aFixed Frequency hold frequency constant and varytemperature or time at temperature allows detection of transitions in material allows one to study cures most sensitive method for finding Tg can also get changes in dimension (TMA)while collecting DMA data Best probe of polymer relaxations as functionof temperature
Idealized Multi-Event DMA Scan(6)γ (5)Β (4)Tg - glass transition (3) αE’Rubbery Plateau (2)Tm - melting (1)(6)(5)localbendmotions andstretchTemperature(4)(3)sidegradualgroups mainchain(2)largescalechain(1)chainslippage
Log Modulus (Pa)In more detail.11109876543FECrystalline PolymerDCCrystal-crystal ransitionPrimaryTransitionHighly Visco calizedMotionBend &StretchBondsSideGroupsMainChainGradualMain Chain LargeScale trainedStateIncreasingR. Seymour, 1971
Common changes show as:MWE’tan δMWDCrosslink DensityCrystallinity
Tg are easily seen, as in PET FilmTemp/Time Scandemofilmin ExtensionWed Oct 11 17:06:48 1995Amplitude: 21.949uTension: 110.000%1.6#1pet film:demofilmtan#2Storage Modulus (Pa x 109)tan3.01.02.591.20.8Onset 83.29C2.00.61.50.4Onset 107.820.21.0C0.50.0Onset 79.35C0.0-100.00.0100.0Temperature (TEMP1: -100.0 CTEMP2: 250.0 C)3.51.4TIME1: 0.0 minRATE1: 10.0 C/min200.0C)PERKIN-ELMER7 Series ThermalSun Nov 26 21:02:11 1995300.0Analysis SystemModulus (Pa x 10Curve 1: DMAFile info:Frequency: 1.00 Hzpet film
or in PP fishing line.Curve 1: DMA Temp/Time Scan in ExtensionFile info:1116942Wed Nov 16 13:20:39 1994Frequency: 1.00 HzDynamic Stress: 200.0mNfishing lineStatic Stress: 300.0mN# 1 fishing line:1116942-1tan(x 10)# 2 Storage Modulus (Pa x 109)8.02.57.05.01.5tan4.01.0Modulus (Pa x 10(x emperature (TEMP1: -130.0 CTEMP2: 270.0 CTIME1:0.0 minRATE1: 10.0 C/min100.0C)150.0200.0PERKIN-ELMER7 Series ThermalAnalysis SystemSun Nov 26 21:24:35 1995Sample prep can be minimal if only temperatures are needed.
Transitions are clearly seen inhighly crosslinked samples#1epoxyresin:afriedli.1Storage Modulus (Pa x 50.31.00.20.50.10.00.00.050.0heavy xlinkTEMP1: 30.0 CTEMP2: 250.0 C100.0150.0Temperature (TIME1:0.0 minC)RATE1: 10.0 C/minThis Tg is undetectable in the DSC !!!!!!200.0kmPERKIN-ELMER7 Series ThermalThu Jun 23 13:45:10 1994250.0Analysis SystemtanModulus (Pa x 109)Curve 1: DMATemp/Time Scanin 3 Point BendingFile info:afriedli.1Thu Feb 17 12:14:11 1994Frequency: 1.00 HzDynamic Stress: 800.0mNepoxyresinStatic Stress: 1000.0mN
as well as in blends.Curve 1: DMATemp/Time Scanin 3 Point BendingFile info:sbr14Thu Feb 15 10:45:19 1990Frequency: 1.00 HzDynamic Stress: 2.00e 05PaSTYRENE BUTADIENE RUBBETension: 110.000%#1STYRENE BUTADIENE RUBBER:sbr14Storage Modulus (Pa) L#2tan1.00.910 90.80.610 80.50.40.310 70.20.110 6-150.00.0-100.0-50.0K66:22T914TEMP1: -180.0 CTEMP2: 250.0 C0.0Temperature (TIME1:0.0 minRATE1:5.0 C/min50.0C)100.0150.0APPLICATION LABORATORYPERKIN-ELMER7 Series ThermalAnalysis SystemSun Nov 26 20:54:43 1995200.0tanModulus (Pa)0.7
It’s not always so simple:For example, crystal-crystals slips can cause α transitionsCurve 1: DMATemp/Time Scanin 3 Point BendingFile info:AMPfrPP.1Wed Oct 27 13:49:06 1993Frequency: 1.00 HzDynamic Stress: 950.0mNLeBrun samplesStatic Stress: 1000.0mN#1#2LeBrun samples:AMPfrPP.1Storage Modulus (Pa x 10tan(x 10-19))3.0Modulus (Pa x 10Tg orAlpha1.01.0Tα*0.5-150.0TEMP1: -160.0 CTEMP2: 300.0 C0.50.0-100.0-50.0AMP Flame Retardant PolypropyleneTIME1:0.0 min0.0Temperature (RATE1:5.0 C/min-1tan1.51.5(x 109)2.02.0)2.52.550.0C)KPMPERKIN-ELMER7 Series ThermalSun Nov 26 20:58:36 1995100.0Analysis System
Higher Order Transitionsaffect toughnessCurve 1: DMATemp/Time Scanin 3 Point BendingFile info:AMP66gp.1Tue Oct 26 16:05:29 1993Frequency: 1.00 HzDynamic Stress: 190.0mNLeBrun samplesStatic Stress: 200.0mNLeBrun samples4.05.55.03.54.5Good Impact Strength)3.0Modulus (Pa x 103.02.5β 0.0-100.0-50.0AMP good part 20% glass filled Nylon 6/6TEMP1: -160.0 CTEMP2: 300.0 CTIME1:0.0 min0.0Temperature (RATE1:5.0 C/minImpact was good if Tg/Tβ was 3 or less.50.0C)100.0KPMPERKIN-ELMER7 Series ThermalSat Oct 15 14:32:54 1994150.0Analysis System(x 102.53.5tan9-1)4.0
.and also define operatingrange.Curve 1: DMA Temp/Time Scan in 3 Point BendingFile info:gamma 1Thu Jun 30 02:17:24 1988Frequency: 7.00 HzDynamic Stress: 1.86e 06PaEPOXY PC BOARD AT 7 HzStatic Stress: 1.86e 06Pa# 1 EPOXY PC BOARD AT 7 Hz:gamma 110Storage Modulus (Pa x 10)1.1- # 2tan-1(x 2.01.50.31.00.20.50.10.00.0-100.00.0Temperature (TEMP1: -180.0 CTEMP2: 300.0 CTIME1:0.0 minRATE1: 10.0 C/min100.0C)200.0PE DMA7 R&D LABPERKIN-ELMER7 Series ThermalAnalysis SystemSun Nov 26 20:13:53 1995(x 100.7tanModulus (Pa x 1010)3.5)0.9-11.0
It can get complex.Curve 1: DMATemp/Time Scanin ExtensionFile info:T2n4ptgFri Jan 18 18:14:51 1991Frequency: 1.00 HzDynamic Stress: 1.00e 07PaNYLON MONOFILAMENTStatic Stress: 1.05e 07Pa2#1NYLON MONOFILAMENT:T2n4ptgStorage Modulus (Pa) L#2tan(x 10-14.0)3.5-1)3.0(x 102.5432.021.5Tg or Tα10 998765-200.0Tγ-150.0iNITIAL RUNTEMP1: -180.0 CTEMP2: 0.0 CTEMP3: 150.0 CTIME1: 0.0 minTIME2: 0.0 min-100.0TβStressRelief-50.00.50.00.0Temperature (RATE1: 4.0 C/minRATE2: 2.0 C/min1.050.0C)100.0B.CasselPERKIN-ELMER7 Series ThermalSun Nov 26 20:59:14 1995150.0Analysis System200.0tanModulus (Pa)10 1098765
Curing of Thermosets can be studied at constant temperature or by atemperature ramp can get minimum viscosity, gelation point (time),vitrification point, and activation energies fromDMA curve can adapt instrument to do simultaneous DEADMA to follow cure to completion cure studies are not limited to polymeric systemsbut include food products like cakes and cookies
Analysis of a Cure by DMA10 810 7Modulus10 6E’-E” Crossover gelation point106 Pa Solidity10 5vitrification pointE”10 4Curing10 3E’10 2Melting10 1Minimum Viscosity (time, length,temperature )η 10 050.070.090.0Τ110.0130.0150.0
QC can often be done bysimply fingerprinting the resin.3.53.0note the different slopes andthe different curve shapes2.5η 2.01.5bad1.00.5good0.025.050.075.0100.0125.0150.0
Postcure studies allow processoptimization:1.0Postcure time vs. Tg and E’1 hour0 hours2 hours2001803 - 8 hours160140120tan δProperty0.5100E'@50 ( E 9 P A )8060E' ONSET40T A N D PE A K200.0T A N D ONSET0150200175Temperature024TIME IN HOURS68
Frequency Scans hold temperature constant and vary frequencyallows one to look at trends in materialcan estimate changes in MW and MWDlooks at both tack-like and peel-like behaviorcan use data for Time Temperature Superpositionto extend frequency range or predict age life.
Frequency determines the typeof response10 7MoreLiquidlikeMoresolidlike10 610 510 510 410 4Flow dominatesElastic dominates10 310 310 -210 -110 0Frequency (Hz)10 1Viscosity (PaModulus (Pa)s)10 610 7
For example, two hot melt adhesives.show affect of rate (peel vs. tack)η 10 810 810 710 7bad10 610 610 510 510 410 4good10 310 210 310 -410 -310 -210 -1Τ10 010 110 2E’’
Creep can look at distortionunder load,Curve 1: DMACreep Recoveryin 3 Point BendingFile info:cr ptfe-5Wed Jun 29 15:31:18 1988Sample Height:3.300mmCreep Stress: 1.50e 06PaPTFE - CREEP/RELAXATIONRecovery Stress: 6.25e 02Pa#1PTFE - CREEP/RELAXATION AT -5C:cr ptfe-5Strain (%)#2Force (mN)2500.02250.00.00252000.0Strain 00050.0-250.00.00000.01.02.03.0Time (minutes)TEMP1: -15.0 CTIME1: 7.0 min4.05.06.0DMA7 APPLICATIONS LABPERKIN-ELMER7 Series ThermalAnalysis SystemThu Apr 28 20:32:20 19947.0Force (mN)1750.00.0020
cyclic application of loads,Differences can be seen in good and bad samples and get more apparent withseveral cycles. Here the bad material is not flowing enough to fill the pores andform a mechanical bond.55.050.0Good% 0.01.02.03.0Time in minutes4.05.0
and with varying temperatures.Curve 1: DMACreep Recoveryin Parallel PlateFile info:DR90D2.1Fri Jul 23 12:23:50 1993Sample Height:2.836 mm Creep Stress: 2600.0mNDresser 90 DRecovery Stress: 1.0mN# 1 Dresser 90 D:DR90D2.1Strain (%)#2Force (mN)#3T ( 4.00.02.0-250.00.00.025.050.075.0Time (minutes)TEMP1: -50.0 CTEMP2: 0.0 CTEMP3: 50.0 CTEMP4: 100.0 minRATE1: 10.0 C/minRATE2: 10.0 C/minRATE3: 10.0 C/min100.0125.0KPMPERKIN-ELMER7 Series ThermalAnalysis SystemSun Nov 26 20:41:31 1995Force (mN)Strain (%)24.0
And you can tabulate this stuffgraphically.τ1/T The time to 1/epercent recovery isthe relaxation. This is a measureof how quickly amaterial recovers.(There is a lot moreto this subject.)
Stress RelaxationExperiment StartsPosition By exploiting the specialcontrols of the DMA-7e,we can run stressrelaxation experiments. These look at how theforce change for asample kept at a setdistortion as a function oftime or temperature.σTimeSample would be distorted to y length and held.
Don’t forget the DMA-7e also doesStress Scans can do either static or dynamic ramps static scans calculate Young’s modulus andstress-strain curves dynamic scans give material response toincreasing oscillatory forces:– get complex viscosity and modulus for each data point– can look at changes in elasticity (E’) and lag (phase angle) withincreasing stress Both methods are fast tests for QC applicationsafter the material has been fully characterized byother DMA modes.
Specialized Testing is Possible.The design of the DMA-7e makes it possible todo:Time-Temperature Superposition (TTS)DEA/DMATests in SolutionMicroscopic DMAPhoto DMADMA-?
PP fibers in solvent200.0175.0Force in 5.00.020.040.060.0Temperature in C80.0100.0
To Review, DMA ties together.m olecular structureMolecular weightMW DistributionChain BranchingCross linkingEntanglementsPhasesCrystallinityFree VolumeLocalized motionRelaxation Mechanismsproduct propertiesMaterialBehaviorprocessing conditionsStressStrainTemperatureHeat HistoryFrequencyPressureHeat setDimensional StabilityImpact propertiesLong term behaviorEnvironmental resistanceTemperature performanceAdhesionTackPeel
Conclusions DMA allows you to preform a wide range oftests from sensitive probes of molecularstructure to model studies. the DMA-7e allows operation as six differentinstruments to maximize flexibility. Data can be overlayed with DSC, TGA, TMA,and DTA for easier analysis.
References: Books Menard, DMA: Introduction to the Technique, Its Applications and Theory,CRC Press, 1999.Brostow et a., Failure of Plastics, Hanser, 1986.Ferry, Viscoelastic Properties of Polymers, Wiley, 1980.Gordon et al., Computer Programs for Rheologists, Hanser, 1995.Gol'dman, Prediction of Deformation Properties of Polymeric and CompositeMaterials,, ACS, 1994.Mascosko, Rheology, VCH, 1993.Matsouka, Relaxation Phenomena in Polymers, Hanser, 1993.McCrum et al, Anelastic and Dielectric Properties of Polymeric Solids, Dover,1992 (reprint of 1967 edition).Nielsen et al., Mechanical Properties of Polymers and Composites, Dekker,1994.Sperling, Introduction to Physical Polymer Science, Academic Press, 1994.Ward et al., Introduction to Mechanical Properties of Solid Polymers, Wiley,1993.
nalysis System nalysis System Dresser 90 Durameter:Drssr90dss s x 10 7) 1.0 0.0 0.5 1.0 1.5 2.0 2.5 3.0 3.5 4.0 4.5 5.0 5.5 Thu Apr 14 16:59:58 1994 Dynamic Stress (Pa x 10 6) Strain (%) KPM Slope 1274361.04 Pa/% Curve 1: DMA in Parallel Plate sThu Apr 14 16:44:41 1994 n Dresser 70 Durameter PERKIN-ELMER %