Transcription
Water Resour Manage (2016) 30:1685–1699DOI 10.1007/s11269-016-1245-6A Graph-Theoretic Framework for Assessingthe Resilience of Sectorised Water Distribution NetworksManuel Herrera1 · Edo Abraham2 · Ivan Stoianov2Received: 3 July 2015 / Accepted: 24 January 2016 /Published online: 13 February 2016 The Author(s) 2016. This article is published with open access at Springerlink.comAbstract Water utilities face a challenge in maintaining a good quality of service undera wide range of operational management and failure conditions. Tools for assessing theresilience of water distribution networks are therefore essential for both operational andmaintenance optimization. In this paper, a novel graph-theoretic approach for the assessment of resilience for large scale water distribution networks is presented. This is of greatimportance for the management of large scale water distribution systems, most models containing up to hundreds of thousands of pipes and nodes. The proposed framework is mainlybased on quantifying the redundancy and capacity of all possible routes from demand nodesto their supply sources. This approach works well with large network sizes since it doesnot rely on precise hydraulic simulations, which require complex calibration processes andcomputation, while remaining meaningful from a physical and a topological point of view.The proposal is also tailored for the analysis of sectorised networks through a novel multiscale method for analysing connectivity, which is successfully tested in operational utilitynetwork models made of more than 100,000 nodes and 110,000 pipes.Keywords Water distribution networks · Resilience · Complex systems · Graph theory ·Multiscale graph decomposition Ivan Stoianovivan.stoianov@imperial.ac.ukManuel Herreraa.m.herrera.fernandez@bath.ac.ukEdo Abrahamedo.abraham04@imperial.ac.uk1EDEn - Department of Architecture and Civil Engineering, University of Bath, Bath, BA2 7AY, UK2InfraSense Labs - Department of Civil and Environmental Engineering, Imperial College London,London, SW7 2AZ, UK
1686M. Herrera et al.1 IntroductionResilience can be defined as the ability of a system to maintain and adapt its operationalperformance in the face of failures and other adverse conditions (Laprie 2005; Strigini2012). Depending on the application domain, different approaches are applied to assess theresilience of man-made systems. There is no single widely used definition for quantifyingthe resilience of water distribution networks (WDNs), a common method is to formulate thehydraulic resilience as a measure of the ability of a network to maintain supply under failureconditions. Todini (2000) proposed a resilience index based on the steady state flow analysis of WDNs and dissipated energy; consequently, the resilience of a water network wasdefined using a measure of the available surplus energy. Recent work extends this approach;for example, Raad et al. (2010) modelled the outcomes of this index proposing to work withalternative approaches to the original in Todini (2000); this was done to overcome computational difficulties in optimising a network design problem using Todini’s resilience index asan objective function. Therefore, by using parameters of physical significance in the supplyas surrogates and not the real hydraulic details, di Nardo et al. (2013a) included these surrogate indices for optimizing the resilience of sectorised water distribution networks. Bañoset al. (2011) proposed an extension to Todini (2000) by considering failures under various water demand scenarios. Other approaches based on a steady state hydraulic analysisinclude Prasad and Park (2004) who adapted Todini’s index by incorporating the effects ofboth surplus pressure and reliability of supply loops assessed by the variability in the diameter of pipes connected to the same node. They also applied the method to a multi-objectiveproblem for the optimal design and rehabilitation of a water distribution network. Jayaramand Srinivasan (2008) used the same method from Prasad and Park (2004) for the analysisof networks with multiple sources. An alternative approach was proposed by Wright et al.(2015) who assess the resilience of networks with dynamically configurable topologies byestimating what percentage of operational demand can be supplied when a disruptive eventoccurs.A common constraint of the above approaches is that the combination of possible failure scenarios grows exponentially as the network becomes bigger (Berardi et al. 2014)together with possible inconsistencies and uncertainties associated with hydraulic simulations (Gupta and Bhave 1994). Trifunović (2012) explores hydraulic properties of thenetwork based on the statistical analysis of common parameters under normal operation andproposed them as indices to assess the resilience of a water network. However, these statistical parameters may not be valid under failure conditions (Giustolisi et al. 2008). Anotherinherent drawback is the dependence on well calibrated (accurate) hydraulic models forlarge networks. Beyond the implicit non-linearity, the number of parameters involved in thehydraulic equations (Abraham and Stoianov 2015) and their large number of possible combinations introduce high complexity to the WDN calibration problem (an NP-Hard problem,which cannot be solved in polynomial time Takahashi et al. (2010).) For large WDNs, thesehave an expensive computational cost since, even for moderate size networks, the number of possible failure scenarios grows exponentially and are approached using either somelinearising assumptions or the use of heuristics for failure simulations (Berardi et al. 2014).This paper assesses the resilience of WDNs from a topological perspective where properties such as network configuration and redundancy in connectivity are taken into accounttogether with physical-based flow properties. This assessment is based on a computationally efficient implementation of the K-shortest paths algorithm (Eppstein 1998). It measuresin a statistically robust way how every WDN demand node would be affected by disruptions in supply. This is done by analysing alternative paths between demand nodes and
A Graph-Theoretic Framework for Assessing the Resilience of WDNs1687water sources (i.e. tanks and reservoirs). In addition, the paths are weighted by the hydraulicattributes of the supply routes to make the measures physically meaningful. Graph-theoreticindices have been applied to assess the resilience of water networks and used also as asurrogate measure in design problems (Yazdani et al. 2011). These surrogate indices aremeasures that correlate to physical/hydraulic based indices of resilience but are not necessarily based on physical indices whose parameters are either unavailable or are difficult tocompute. These indices can be broadly classified into “statistical” and “spectral” measures(Gutiérrez-Pérez et al. 2013). Among the statistical indices, the meshedness coefficient(Buhl et al. 2006) provides an estimation of the topological redundancy of a network.Central-point dominance (Freeman 1977), gives a measurement of the network vulnerability to failures corresponding to central locations. Flow Entropy (Raad et al. 2010) measuresthe strength of supply to a node both in terms of the number of connections and their similarity. The so-called demand-adjusted entropic degree in Yazdani and Jeffrey (2012) is anotheralternative that uses demand on nodes and volume capacity on edges to compute a weightedentropic degree. More recently, (Liu et al. 2014) have extended the flow entropy measure toalso consider the impact of pipe diameter on reliability.The work also extends the proposed adaptation of K-shortest paths algorithm for theanalysis of WDNs divided into sectors or District Metered Areas (DMAs) by utilizing multiscale network decomposition (Albert and Barabási 2002; Lee and Maggioni 2011). Demandnodes of a given DMA are aggregated into a sector-node, where a new graph (DMA-graph)is defined with vertices representing DMA areas and edges that abstract the sector-to-sectorconnectivity (Izquierdo et al. 2011). A mapping function is used to establish a relationshipbetween the network graph of demand nodes and the DMA-graph, where every DMA-vertex(or sector-node) has new features such as number of customers, total demand, and an average pressure aggregated from information of individual nodes of the DMA. The physicalconnections between sectors, which consist of pipes and boundary valves, form the edges ofthis DMA-graph and define the level of its connectivity. Resilience assessments carried outon individual demand nodes in the DMAs are also linked to the corresponding sector-nodes,which are then used for a system-level resilience analysis. Considering both the networkgraph of demand nodes and a DMA-graph, a multiscale analysis of resilience is proposed.2 A Graph Theory Perspective on the Definition of WDN ResilienceThe network connectivity of a WDN can be modelled as a nearly-planar mathematicalgraph1 , G (V , E), where V (vertices) corresponds to n nodes and E (edges) correspondsto m pipes of the water system. This graph also has the particular characteristics that everynode or edge should normally have at least one path of edges connecting it to a source node(tanks and/or reservoirs).For a given WDN, our approach starts with computing a measure of resilience for eachnode by identifying the number of water sources a node is connected to and estimating howwell that node is supplied by the available water sources. To accomplish this, all routesconnecting a node i to all tanks and reservoirs are computed, and used to quantify thecapacity or resistance of the corresponding routes. Since computing all routes which link1Aplanar graph is one that can be drawn on a plane without having edges intersecting other than at a nodemutually incident with them. WDN graphs are not strictly planar due to the existence of some possiblecrossovers but are almost planar.
1688M. Herrera et al.nodes to sources is prohibitively expensive, our approach becomes feasible by restrictingthe computations to the K ‘shortest’ routes (Eppstein 1998) for the flow between a nodei and its j -th source sj (i). In calculating this index, every route should be weighted by asurrogate measure of flow resistance. For example, the proposed surrogate flow resistancemeasure depends on the physical characteristics of connecting pipes as water travels fromj -th source, sj (i), to i and it can be estimated by a measure proportional to the energy lossassociated with a route of supply. The estimation of energy loss in water transportation iscommonly done using the Darcy-Weisbach and Hazen-Williams formulae. Although bothformulae depend on hydraulic measures like velocity and roughness, only the proportionaldependence on topological constants of the network has been considered as no detailedhydraulic modelling is used. Energy loss across a link is proportional to f L/D; where fis the friction factor, L is the length of the pipe and D represents its diameter. This resistancemeasure is used to weight every path in the calculus of shortest paths, providing a surrogatemeasure for potential energy loss associated with each path connecting a node and its watersource. The proposed resilience index for a node isIGT (i) S s 1 K1 1,Kr(k, s)(1)k 1where S is the total number of sources in the network and r(k, s) is a surrogate measure ofthe energy loss (the resistance to water transport) associated with the k th path to source s.One such measure of energy loss could be approximated as:r(k) M m 1f (m)Lm,Dm(2)where M is the number of pipes in path k and f (·) estimates the friction factor by pipe ageand material (Christensen 2009).The weighted KSP algorithm returns infinity for Eq. 2 if there is no path of water distribution connecting the given node with a supply source. The contribution of such a sourceto the resilience index for a node in Eq. 1 will be zero. Consequently, both the resistance ofpaths to sources and redundancy in supply are explicitly taken into account by the resilienceindex.In Eq. 2, the flow resistance over K paths is averaged since using the shortest path onlymay not be sufficient to represent the connectivity and indirectly resilience. By averagingover the complete set of routes (i.e. K 2n , where n is a very big number for operational networks (Eppstein 1998)), the true connectivity of a node to a source is measured.However, the computational complexity of this measure grows exponentially (O(2n n) forthe proposed index) and it quickly becomes infeasible for medium to large networks. Averaging over the K-shortest paths is a computationally feasible approximation that takes intoaccount a sufficiently large number of paths in a robust statistical method.2.1 Validation of the Resilience Assessment MethodA previously published network C-Town (Ostfeld et al. 2012) is used as a validation casestudy for the graph-theoretic method proposed. This is a medium size network that consistsof 333 nodes, 429 pipes, 4 valves, 5 pump stations, 7 elevated tanks, and 1 reservoir. Agraph-theoretical analysis of resilience in WDNs (Yazdani et al. 2011) identifies a node of
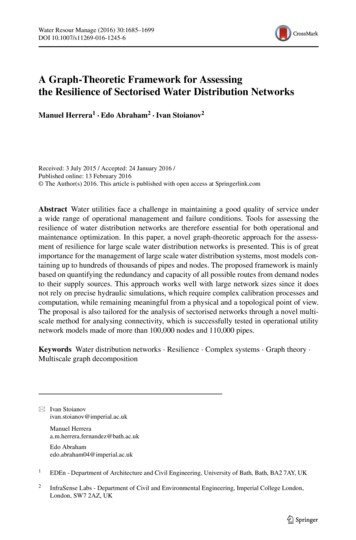
A Graph-Theoretic Framework for Assessing the Resilience of WDNs1689special importance as those with high betweenness centrality index, which measures therelative number of shortest paths from all vertices to all others that pass through a node.Nodes with betweenness centrality values larger than 2 times the standard deviation (SD)from the network average computed over all nodes will be denominated as high betweennessnodes. This work considers “critical transfer nodes” to those of topological importance withrespect to the flow distribution with a WDN. Thus, critical transfer nodes are, a priori, thosebelonging to the main trunk and those with high betweenness.In the case of the proposed K-shortest path index, for a demand node i and source s, letg(K; i, s) K1 1,Kr(k)(3)k 1represent the inverse of the resistance to supply in Eq. 1 averaged over K paths. Figure 1ashows the difference g(K 1) g(K) for two nodes of varying centrality, A and B, wherethe latter belongs to the set of central nodes. In the two cases, the average of Eq. 3 takingK shortest paths converges when the number of paths is increased. That is, the differenceon computing g(K 1) or g(K) changes significantly as one moves away from using onlythe shortest path (i.e. K 1) but not as much when one goes from K to K 1 paths forlarger values of K (over 30 paths in the case of Fig. 1a). Then, this measure is proposed asa decision criterion on the number of paths to be used in Eq. 1 to compute IGT (·).Using K paths has two main advantages. Firstly, it emphasises the need to consider multiple paths of transport that contribute to the resilient operation of a network and it guaranteesa robust statistical estimation since multiple paths are used to capture the average connectivity and capacity instead of the unique shortest path connecting two nodes. Secondly, thesum in Eq. 1 converges for relatively low values of K to obtain a good approximation of theanalysis over all possible routes.Once the tuning process provides an estimate of the K value, the proposal proceeds tocompute the inverse of the resistance to supply, g(K), for the chosen K. In Fig. 1b g(30)is plotted for all individual nodes. The same plot also represents the values of g(30) forcentral nodes (main-trunk nodes and those with a betweenness centrality of at least 2 timesthe SD of the network average; they are plotted with red triangles). Most of the criticalnodes have high g(K) compared to the average node g(K) value. In general, nodes ofhigher betweenness centrality are those that will appear more frequently in any shortest path,including paths to sources, and so will tend to have higher resilience as defined by Eq. 1.Fig. 1 Validation analysis on the K routes to the water sources
1690Table 1 Resilience indicescomputed when a percentage ofpipes are removedM. Herrera et al.Index0 % removed2.5 % removed5 % 3550.03512.2 Comparison of K-Shortest Paths Index (IGT ) with Alternative ApproachesThe next stage of the analysis is a comparison of the various indices of resilience underfailure conditions in a supply network. Three scenarios generated from C-Town are considered, (Table 1, Fig. 1). The first scenario represents normal operational conditions withoutfailures. The second scenario is created by the failure (removal) of 2.5 % of randomlyselected pipes. The third scenario assumes the failure of 5 % of pipes. The resilienceindices are expected to degrade as more pipes are taken off. The aim of this example is toevaluate the consistency of the new index, IGT , by validating that it positively correlateswith results obtained from hydraulic simulations. The comparison is done with Todini’shydraulic resilience index, Ir (Todini 2000). Other graph-theoretic indices, such are centraldominance betweenness (ICB ), meshedness (Im ), and a demand-adjusted entropic index(IS ) (Yazdani and Jeffrey 2012), are also included in this analysis. Table 1 summarises theaverage of the computed indices under the repetition of 20 random experiments for eachscenario.To compare the performance of the various indices, their relative change under failureconditions are investigated. The process starts with the computation of a nominal resiliencevalue; these are the computed under normal operation of a WDN. Then, there are computedthe indices under failure configurations and are plotted the ratio of the new resilience valuesto their corresponding nominal index. Figure 2a shows that the degradation in resilience iscaptured by the considered indices to a different degree. The simulation of failure indicesin Fig. 2a is repeated 20 times (by randomly sampling the corresponding disrupted pipes ateach repeated simulation; in this case, 20 samples is enough to arrange statistically meaningful comparisons between groups/indices). At each iteration, different sets of pipes (2.5Fig. 2 Graph-theoretic indices vs. hydraulic simulation based index
A Graph-Theoretic Framework for Assessing the Resilience of WDNs1691% and 5 %) are randomly sampled and the indices are averaged for each proportion of pipefailures in the WDN. Figure 2b shows the distribution of the indices in Fig. 2a under thesemultiple experiments.As shown in Fig. 2b, graph-theoretic indices show consistency with the hydraulic index2 .The index IGT changes in a proportional way to variations in the condition of the waterdistribution network. The entropic degree, IS , is the measure which provides the poorestestimation of the deterioration in resilience as more pipes are removed, similarly to theresults presented by (Greco et al. 2012). Figure 2b also shows that the meshedness index,Im , has a narrow distribution. This is because meshedness is a measure that depends onlyon the relative number of nodes and pipes, without taking into account their physical orhydraulic properties.3 Assessing Resilience for Large Scale Water NetworksThe network topology of a WDN includes both tree-like (usually hierarchical and lowerredundant networks, i.e. having an equivalent proportion of nodes and links connectingthem) and well meshed structures, where there usually exists several paths connecting twonodes and so a greater number of links compared to the number of nodes. These two type ofstructures can be interconnected by links forming graph-bridges, which transport water fromthe transmission mains to these distribution areas. One way to analyse large-scale WDNsis by partitioning the network into different components (assets: valves, pumps, pipes, andmeters, among others). Alternatively, a WDN can be divided into sub-networks in order tomake the analysis simpler than working with the whole system model. This is of interestespecially in the case of large-scale WDNs, which can contain hundreds of thousands ofnodes and pipes, where consequently the classical methods of analysis are not efficientbecause of the large dimensions.Many WDNs have been divided into sectors (DMAs) mainly for leakage management(Tabesh et al. 2009; Gomes et al. 2013; Xin et al. 2014). For this and a variety of other reasons (Herrera 2011), WDNs are divided into sectors nowadays and researches have focusedtheir attention on different sectorisation approaches. The most studied works on water network division are based on variations of graph clustering (di Nardo and di Natale 2011;Perelman and Ostfeld 2011), spectral clustering (Herrera et al. 2010; Candelieri et al. 2014;Herrera et al. 2012), community detection (Diao et al. 2012), multi-agent systems (Izquierdoet al. 2011; Hajebi et al. 2013), breadth and depth first search (Deuerlein 2008; di Nardoet al. 2014) or multilevel partitioning (di Nardo et al. 2013b). The work of Mandel et al.(2015) is the first to propose a sectorisation approach for large-scale water networks. Forthese previously sectorised networks, the resilience index in Eq. 1 measures the level ofconnectivity of each demand node through various supply roots. A DMA division of the network automatically allows the use of two different scales of this resilience measure, havingapproaches of resilience for every individual node or measures summarised by sector. Thisprovides new ways for analysing and managing the system and allows network configurations that have a major impact on resilience to be easily identified; for example multi-feed,single-feed, cascading DMAs.2 Please note that the proposed index does not replace/estimate hydraulically simulated indices. The presentedanalysis validates the consistency of results as failure conditions change.
1692M. Herrera et al.3.1 Multiscale Resilience AnalysisThe proposed graph-theoretic index is extended to water networks that are divided intosectors thus enabling resilience analysis. A DMA-based graph is a graph of lower levelof detail (or coarser granularity) that captures the topology of existing DMAs. The DMAscale resilience is derived from a user-defined function that transforms the resilience ofthe demand nodes in a DMA to a scalar representing the DMA resilience. For example,by transforming the index of Eq. 1 to the coarser sector level graph to analyse the relativeconnectivity of DMAs. Here, it is used the trimmed mean (Garcı́a-Escudero et al. 2003) totransform the resilience of n i demand nodes of DMAi to the sector graph as: (DMAi )IGT ni IGT (j )j 1n i(4).In calculating the mean, the trimmed approach discards points of very high or very lowvalue before computing the mean for the remaining nodes. Then, the aggregated measureis the summary of the single values for n i nodes of the DMA, with n i ni . As such,a trimmed mean is a more robust centrality measure as the average value is not skewedby extreme low/high value data. For instance, if a DMA with predominantly high resilientnodes has a sub-area that has critically low resilience, the arithmetic average would notidentify the presence of these in the DMA resilience index, whereas the trimmed methoddoes. Furthermore, the presence of individual critical customers such as hospitals couldsignificantly affect the system level resilience assessment. The set of excluded nodes inthe computation of the trimmed mean, H, are identified to validate the existence of criticalnodes among them, and the subsequent impact on the DMA resilience assessment. As aresult, Eq. 5 formulates a constitutive rule which is used to rank DMAs as low resilientif they have low values of IGT for critical users (hospitals, schools, or industrial users)regardless of the fact that a DMA as a whole or a majority of its demand nodes might havehigh resilience. min{IGT (Hi )} if at least one critical user HIGT (DMAi ) (5) IGT (DMAi ) otherwise,where Hi is the set of critical users in DMAi .For a DMA with a large variation in the IGT value, it is possible to trim a significantnumber of nodes (i.e. a number of demand nodes representing a significant number of customers) in computing Eq. 4. To avoid this, the variability of the resilience is used, which isdefined here as standard deviation normalized by the mean resilience value: 2(DMAi )SGT ni j 11 ni 1 IGT (j ) IGT IGT2.(6)Based on the variability of IGT (·) in each DMAi (Eq. 6), a second constitutive rule isformulated and applied: 2 (DMA ) t minDMAi {IGT (·)} if SGTiIGT (DMAi ) (7) (DMA ) otherwiseIGTiwhere t is a user-defined threshold.
A Graph-Theoretic Framework for Assessing the Resilience of WDNs1693When high variability exists, this constitutive rule computes the DMA resilience indexover the whole set of demand nodes in the DMA and identifies the existence of low resilientnodes. The two Eqs. 5 and 7 assist operators to identify areas for a further investigationwhere a threshold of demand nodes or critical customers might not have the required levelof resilience.3.2 Multiscale Representation of a WDNAn essential part of the sector-level resilience analysis is the pre-processing of networkdata of varying types and complexity. For example, geographic information system (GIS)data, telemetry measurements, and hydraulic information is aggregated into an unified system that provides access to heterogeneous data sets. A novel augmented graph is proposedwhich transforms DMAs into sector-nodes. Each sector-node has aggregated data aboutthe assets it contains, abstracting the high-granularity graph of hydraulic nodes to a lowgranularity graph. The pipes and valves that connect different DMAs represent the edgesbetween sector-nodes and inherit their corresponding properties. A schematic view of thismultiscale decomposition process is represented in Fig. 3.By considering all links hydraulically connecting DMAs, the edges of the new graphare formed by taking into account the open/closed status of valves, and consequently linkswhich can provide additional operational resilience are identified. The weights of the newgraph edges are proportional to the aggregated volumetric properties of individual pipesand valves that connect sector-nodes. Sector-nodes can also be used to visualize averagelevels of demand, pressure, elevation, etc. and the sector-node size can inherit topologicalcharacteristics of DMAs (eg. number of nodes or customers).A multiscale network decomposition to assess the resilience of water systems isapproached by studying their performance and network structure at various granularity levels and by analysing topological and physical information inherited from single demandnodes to sectors. Other important details that are obtained in the analysis include the numberand location of multi-feed DMAs, the number of valves within each DMA, and the pressure differential between neighbouring DMAs. In addition, the sector-node graph is used toidentify which part of the network topology should require further investigation to improveresilience.Fig. 3 Mapping high-granularity demand-node into low-granularity DMA-based graphs
1694M. Herrera et al.Fig. 4 Layout and g(K) index for the analysis of WDN-A4 Experimental StudyTwo operational WDNs were used to analyse the proposed methodology for assessing theresilience of sectorised water distribution networks. Firstly, a medium size WDN dividedinto 3 DMAs is investigated. A resilience assessment is carried out for each DMA. Thesecond case-study corresponds to a large water supply zone with high population density inEngland, UK. In both cases, certain sensitive information about the networks is withheld inorder to maintain confidentiality.4.1 Case-Study AWDN-A (Fig. 4a) has 4820 nodes, 1 tank, and 5234 pipes and valves sectorised into 3DMAs. Detailed information for each DMA is summarised in Table 2. Figure 4a also showsthe DMAs layout and the location of critical transfer nodes (i.e. nodes with high values ofcentral-betweenness).In order to compute the proposed graph-theoretic index, IGT of Eq. 1, a sufficient numberof shortest paths K need to be used. The analysis outlined in Fig. 1 was carried out ondifferent nodes and it showed that K 30 as sufficient for WDN-A. In Fig. 4b, we plot thevalues of g(30) for each node of the WDN and for demand nodes with high betweennesscentrality (labelled as critical nodes and also marked in red in Fig. 4a). For this network,analysis in Fig. 4b shows that the measure g(K) of the most critical nodes exceeds theaverage for the network.From Table 2, it can be concluded that DMA-3 is the sector with lowest resilience giventhe index IGT (DMA3 ), while IGT (DMA2 ) index is higher than the other two. DMA-2 isTable 2 Summary of the DMAconfiguration and resilienceindices for WDN-ASector ID# nodes# pipesIGT 88260.0465TOTAL482040320.0663
A Graph-Theoretic Framework for Assessing the Resilience of WDNs1695directly connected with the only source that supplies water to the whole network. Thus,topologically and hydraulically, DMA-2 is the most resilient sector of this network.4.2 Case-Study BWDN-B (shown in Fig. 5) is comprised of 106,115 nodes, 4 constant head sources, 28reservoirs, 111,096 pipes, 102 pumps, and 1,900 boundary valves (Fig. 5a). GIS models,telemetry data, and physical and hydraulic information are combined in an integral databaseframework. Figure 5 shows the process of multiscale decomposition from the network ofdemand nodes to a coarser representation by sector-nodes. Through the graph transformation process, every DMA (sector-node) inherits the information related to the nodes withinthe area; such as, demand, elevation, pressure, and geographic coordinates. Sector-nodesalso gather the information of the pipes and valve: diameter and length, and their owncharacteristics and the open/closed status for valves.The pro
connectivity (Izquierdo et al. 2011). A mapping function is used to establish a relationship between the network graph of demand nodes and the DMA-graph, where every DMA-vertex (or sector-node) has new features such as number of customers, total demand, and an aver-age pressure aggregated from information of individual nodes of the DMA. The .