Transcription
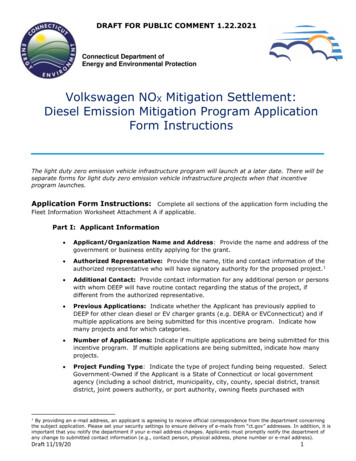
Zero-EmissionVehicles ProgressDashboardZEV Transition Council MeetingAlbert CheungHead of Global AnalysisMay 18, 2022
About this dashboard This dashboard has been produced for the Zero-Emission Vehicles Transition Council (ZEVTC) by BloombergNEF, at therequest of the U.K. Department for Business, Energy and Industrial Strategy (BEIS). Coverage scope:– ZEV adoption, charging infrastructure deployment and automakers’ ZEV sales– Focused on ZEV Transition Council countries Timeframe:– Data from 2015 to end-2021– Future editions of this dashboard will use latest available data, on a quarterly basis where available Sources: BNEF research, and other data sources noted on each slide1ZEV Transition Council - Progress Dashboard
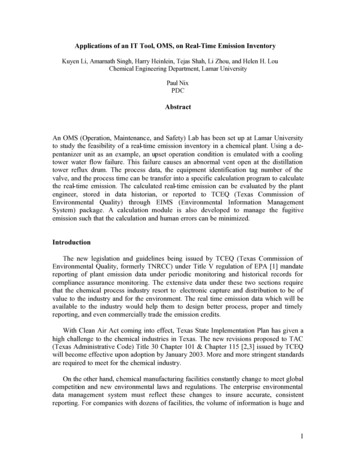
Global passenger EV sales reached anew record in 2021Quarterly EV sales, by embersCanadaNetherlandsSouth KoreaSwedenItalyNorwayRest of EUFranceU.K.U.SGermanyFranceSouth KoreaMexicoRest of .7148.0159.5272.2311.0353.5Source: BloombergNEF, Marklines, Jato. Note: Includes BEV, PHEV and FCVs2ZEV Transition Council - Progress DashboardThe next largest market was the U.S. at 10% ofthe global total in 2021.ZEVTC member countries combined wereresponsible for 50% of global passenger EV sales.The EU-27 leads the way in this group, with 1.8million EVs sold in 2021 – 28% of global EV sales– and 55% of total ZEV Council membercountries’ sales.660.2690.8NorwayDenmarkU.S.Global passenger EV sales grew by 103% in2021, to nearly 6.6 million units.China and Europe have led the global passengerEV and FCV market since 2015, beingresponsible for 85% of global EV sales in 2021.ThousandMillion2.52015 162021 EV sales in ZEV TransitionCouncil countriesItalyCanadaOutside of the EU, the U.S., U.K., Norway andSouth Korea are leaders in absolute terms with660,000, 353,000, 159,000 and 126,000 sold in2021, respectively.EV sales grew the fastest in India, up 209% in2021 compared to 2020.
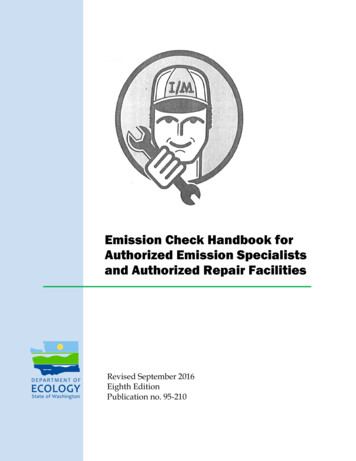
Pure battery EVs are beating out plugin hybridsGlobally, sales of battery electric vehicles outweigh thoseof plug-in hybrids and fuel cell vehicles.Global passenger EV sales by drivetrain BEVs were nearly 70% of 2021 global EV salesMillion PHEVs were 30%2.5 FCVs are a miniscule portion of the EV market, belowFuel cell2.0FCVs continue to find it difficult to compete with BEVs oncost and popularity and are unlikely to gain market share inthe passenger vehicle 15161718192021Source: BloombergNEF, Marklines, Jato. Note: Includes BEV, PHEV and FCVs31% of sales globallyZEV Transition Council - Progress DashboardOf the ZEVTC countries, only Japan and South Korea havemeaningful activity on fuel cell vehicles. Their sales werelimited in 2021, accounting for 5% and 8% of EV sales inthe two countries, respectively.
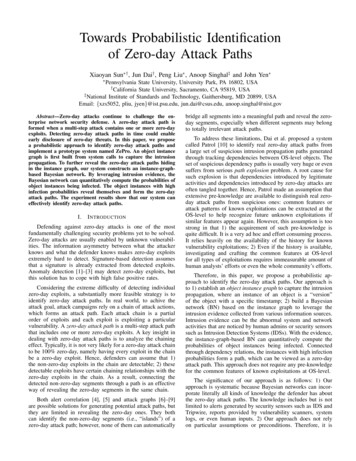
Some regions have reached massmarket adoptionEV share of passenger vehiclesalesZEV share of passenger vehiclesales (excludes PHEVs)100%100%Norway90%90%80%80%70%70%NorwayIf plug-in hybrids (PHEVs) are included,countries such as Norway (97%), Sweden(60%), Netherlands (51%) and Denmark (49%)have reached very high sales %10%0%ItalyCanada15 16 17 18 19 20 21NorwaySwedenGermanyFranceSouth KoreaU.S.MexicoGlobal10%0%15 16 17 18 19 20 21NetherlandsDenmarkItalyRest of EUCanadaJapanSource: BloombergNEF. Note: Includes BEV, PHEV and FCVs4Some ZEVTC members are well above thisglobal average, while others are still gettingtheir ZEV markets started.Sweden40%ZEV Transition Council - Progress DashboardGlobally, EVs accounted for 13% of passengervehicle sales in 4Q 2021, or 9% when excludingPHEVs.U.K.SpainIndiaJust under half of all EVs sold in the EU-27 in2021 were PHEVs – more than in other regions– but these are not true zero-emission vehicles.This means that the actual ZEV share ofpassenger vehicles sales in ZEVTC countrieslike Sweden, Netherlands and Denmark was at33%, 42% and 22% in 4Q 2021, respectively.Some 75% of passenger EV sales in Mexicowere also PHEVs in 2021.
The public charging infrastructure baseis growing steadilyCumulative public chargingconnectors installed, 2021Public yItalyJapanU.K.Rest of EUSouth 1870,57572,627103,898112,858Public charging connectorsnormalized by vehicle fleet, 2021Connectors per 1 million vehiclesMexico55India80Spain400U.S.465Japan499Rest of ,962Sweden2,510Denmark2,642South Korea2,784Norway5,764Netherlands10,882Source: BloombergNEF. Note: middle chart is normalized by total passenger vehicle fleet size (all drivetrains).5ZEV Transition Council - Progress Dashboard% net change 2020-20212020-2021 anyDenmarkU.K.FranceU.S.South KoreaRest of 6%27%28%45%79%80%
The number of EVs per public connectorhas increased in all countriesIn 2021, the global ratio of EVs on the road to public chargingconnectors was 9.2, growing from 7.4 in 2020EVs per public charging connectorEVs per connector353025201510502015 2016 2017 2018 2019 2020 panFranceRest of EUItalyIndiaMexicoSouth KoreaNetherlandsSource: BloombergNEF6ZEV Transition Council - Progress DashboardFor ZEVTC countries, the ratio of EVs on the road to public chargingconnectors was 14.1 in 2021, up from 10.2 in 2020.The ratio has increased for all ZEV Transition Council countries, but to adifferent extent.Netherlands, Canada and Japan saw limited change, signalling thatgrowth in charging is matching growth in EV sales.Others, such as Denmark, Italy and the U.K. saw a fast growth in theratio signalling that installations did not grow as fast as vehicle sales.Differences depend on access to home charging, drivetrain mix andutilization of existing infrastructure.Norway has the highest ratio of EVs to public chargers, at 30:1. Thiscan be explained by the high prevalence of detached houses in thecountry, and therefore home charging availability. Increasing utilizationof existing infrastructure also plays a role.In Denmark, the ratio increased by 77% in 2021, as EV sales grew105%. Note that 62% of EVs sold in the country in 2021 were PHEVs,which are less likely to rely on public charging.
Several automakers have surpassed10% EV share of salesPassenger EV sales by automakersassociated with ZEVTC countriesMillion1.6Passenger EV share of sales .012%VW Group0.810%6%0.44%0.22%0.00%2015 16TeslaGeelyToyota1718 19 20VW GroupBMWTata2015 1621Tesla, VW Group, GM, Hyundai-Kia led thepack. These accounted for nearly twothirds of the total covered in this slide.EV sales from this group of 13 automakerswere up 45% from 2020.Tesla has been the leading EVmanufacturer since 2018, and sold over930,000 BEVs globally in 2021.Volkswagen Group is gradually catchingup.8%0.6Leading automakers that are associatedwith ZEVTC countries represented nearly4.4 million in total EV sales in 2021 – twothirds of the global enz2021Renault-NissanFordBMW, Geely and Mercedes-Benz had thehighest EV share of sales, excluding Tesla.BMW’s EV sales share was 19%, Geely’swas 17% and Mercedes-Benz hit 14%.Source: BloombergNEF. Note: Includes automakers that are headquartered or have major operations in ZEVTC countries. Renault Nissan includes Mitsubishi. Geelyincludes Volvo. Commercial vehicles are included in manufacturers total sales. EV sales from Chinese JVs are attributed to both partners in full.7ZEV Transition Council - Progress Dashboard
Early signs of decarbonizationprogress for trucksSelected companies’ targets for zero-emission trucksCompanyZEV sales targetsZEV R&Dinvestment202520302040“Vast majorityof total” by2025n/aUp to 60%100% (by 2039)n/an/a 35%“Absolutemajority”2.6 bn euros,2021-2610% Scania inEurope50% (Scania)40-60% (MAN*)50% all group longhaul trucksSource: BloombergNEF, company press releases Note: ZEV is zero emission vehicle; Daimler Truck’s R&Dwas EUR1.4 billion in 2021; *MAN targets are separate for long-haul (40%) and delivery (60%) trucks.Traton targets 50% of its long-haul trucks to be battery electric by 2030. Other truckmakers do notbreakdown technology shares, but for 2030 their targets are likely to be met using battery electric trucks.8ZEV Transition Council - Progress DashboardSales of zero-emission trucks are still very low,putting commercial vehicle decarbonization farbehind the progress made in passenger vehicles.Three major truck manufacturers have recentlypresented plans for zero emission medium- andheavy-duty trucks.Between 2019-2021, these three manufacturers(Daimler, Volvo and Traton) sold around 450,000units annually in ZEVTC countries, accounting forabout 30% of the market.Many manufacturers expect to deploy both batteryelectric and fuel cell trucks to reachdecarbonization targets.All-electric medium- and heavy-duty trucks arealready being used in several applications. Somefuel cell trucks are also being trialed, but theirdeployment timelines generally point towards theend of the 2020s.For either technology, refueling infrastructure is anecessary condition before large-scale adoption.
Oil use avoided by EVs has more thandoubled since 2015Global oil demand in road transport reached roughly 43.7 million barrels perday in 2021, a slight increase since 2015.Oil demand avoided by EVs and FCVsThe adoption of electric vehicles and fuel cell vehicles avoided almost 1.5millions of barrels of oil per day in 2021 – about 3.3% of total demand. Thedisplaced demand is roughly equivalent to one-fifth of Russia's total oil andoil products exports prior to the war, and roughly double Germany's importsof Russian oil and products at the end of 2021.Millons of barrels of oil per day0.0-0.2-0.42/3 hicles-1.0-1.2Two- and three-wheeled EVs accounted for 67% of the oil demand avoidedin 2021. This is due to their rapid adoption particularly in Asia.Buses, with 16% of total oil demand avoided, were next, followed bypassenger vehicles, the fastest growing segment, accounting for 13%.Commercial vehicles accounted for just 4% of total oil demand avoided in2021, largely from light commercial EVs.In BNEF’s Net-Zero Scenario, which achieves a zero-emission vehicle fleetglobally by 2050, oil displacement increases to over 7 million barrels perday in 2030 – roughly equivalent to Russia's total oil and products exportsprior to the war.-1.4-1.62015 2016 2017 2018 2019 2020 2021Source: BloombergNEF, IEA9Avoided oil consumption has more than doubled in the past six years, upfrom 725,000 barrels of oil per day in 2015.ZEV Transition Council - Progress DashboardThis figure rises to nearly 16 million barrels per day in 2035, and representspermanent removal of oil dependency.
Copyright and disclaimerCopyright Bloomberg Finance L.P. 2022. This publication is the copyright of Bloomberg Finance L.P. in connection with BloombergNEF. No portion of this document may bephotocopied, reproduced, scanned into an electronic system or transmitted, forwarded or distributed in any way without prior consent of BloombergNEF.DisclaimerThe BloombergNEF ("BNEF"), service/information is derived from selected public sources. Bloomberg Finance L.P. and its affiliates, in providing theservice/information, believe that the information it uses comes from reliable sources, but do not guarantee the accuracy or completeness of this information, which issubject to change without notice, and nothing in this document shall be construed as such a guarantee. The statements in this service/document reflect the currentjudgment of the authors of the relevant articles or features, and do not necessarily reflect the opinion of Bloomberg Finance L.P., Bloomberg L.P. or any of theiraffiliates (“Bloomberg”). Bloomberg disclaims any liability arising from use of this document, its contents and/or this service. Nothing herein shall constitute or beconstrued as an offering of financial instruments or as investment advice or recommendations by Bloomberg of an investment or other strategy (e.g., whether or notto “buy”, “sell”, or “hold” an investment). The information available through this service is not based on consideration of a subscriber’s individual circumstances andshould not be considered as information sufficient upon which to base an investment decision. You should determine on your own whether you agree with thecontent. This service should not be construed as tax or accounting advice or as a service designed to facilitate any subscriber’s compliance with its tax, accounting orother legal obligations. Employees involved in this service may hold positions in the companies mentioned in the services/information.The data included in these materials are for illustrative purposes only. The BLOOMBERG TERMINAL service and Bloomberg data products (the “Services”) areowned and distributed by Bloomberg Finance L.P. (“BFLP”) except (i) in Argentina, Australia and certain jurisdictions in the Pacific islands, Bermuda, China, India,Japan, Korea and New Zealand, where Bloomberg L.P. and its subsidiaries (“BLP”) distribute these products, and (ii) in Singapore and the jurisdictions serviced byBloomberg’s Singapore office, where a subsidiary of BFLP distributes these products. BLP provides BFLP and its subsidiaries with global marketing and operationalsupport and service. Certain features, functions, products and services are available only to sophisticated investors and only where permitted. BFLP, BLP and theiraffiliates do not guarantee the accuracy of prices or other information in the Services. Nothing in the Services shall constitute or be construed as an offering offinancial instruments by BFLP, BLP or their affiliates, or as investment advice or recommendations by BFLP, BLP or their affiliates of an investment strategy orwhether or not to “buy”, “sell” or “hold” an investment. Information available via the Services should not be considered as information sufficient upon which to base aninvestment decision. The following are trademarks and service marks of BFLP, a Delaware limited partnership, or its subsidiaries: BLOOMBERG, BLOOMBERGANYWHERE, BLOOMBERG MARKETS, BLOOMBERG NEWS, BLOOMBERG PROFESSIONAL, BLOOMBERG TERMINAL and BLOOMBERG.COM. Absence ofany trademark or service mark from this list does not waive Bloomberg’s intellectual property rights in that name, mark or logo. All rights reserved. 2022 Bloomberg.10ZEV Transition Council - Progress Dashboard
BloombergNEF (BNEF) is a strategicresearch provider covering global commoditymarkets and the disruptive technologiesdriving the transition to a low-carboneconomy.Our expert coverage assesses pathways forthe power, transport, industry, buildings andagriculture sectors to adapt to the energytransition.We help commodity trading, corporatestrategy, finance and policy professionalsnavigate change and generate opportunities.Albert Cheung, Head of Global Analysisacheung89@bloomberg.netClient enquiries:Bloomberg Terminal: press Help key twiceEmail: support.bnef@bloomberg.netLearn more:about.bnef.com @BloombergNEF
1 ZEV Transition Council - Progress Dashboard This dashboard has been produced for the Zero-Emission Vehicles Transition Council (ZEVTC) by BloombergNEF, at the request of the U.K. Department for Business, Energy and Industrial Strategy (BEIS). Coverage scope: -ZEV adoption, charging infrastructure deployment and automakers' ZEV sales