Transcription
Applications of an IT Tool, OMS, on Real-Time Emission InventoryKuyen Li, Amarnath Singh, Harry Heinlein, Tejas Shah, Li Zhou, and Helen H. LouChemical Engineering Department, Lamar UniversityPaul NixPDCAbstractAn OMS (Operation, Maintenance, and Safety) Lab has been set up at Lamar Universityto study the feasibility of a real-time emission inventory in a chemical plant. Using a depentanizer unit as an example, an upset operation condition is emulated with a coolingtower water flow failure. This failure causes an abnormal vent open at the distillationtower reflux drum. The process data, the equipment identification tag number of thevalve, and the process time can be transfer into a specific calculation program to calculatethe real-time emission. The calculated real-time emission can be evaluated by the plantengineer, stored in data historian, or reported to TCEQ (Texas Commission ofEnvironmental Quality) through EIMS (Environmental Information ManagementSystem) package. A calculation module is also developed to manage the fugitiveemission such that the calculation and human errors can be minimized.IntroductionThe new legislation and guidelines being issued by TCEQ (Texas Commission ofEnvironmental Quality, formerly TNRCC) under Title V regulation of EPA [1] mandatereporting of plant emission data under periodic monitoring and historical records forcompliance assurance monitoring. The extensive data under these two sections requirethat the chemical process industry resort to electronic capture and distribution to be ofvalue to the industry and for the environment. The real time emission data which will beavailable to the industry would help them to design better process, proper and timelyreporting, and even commercially trade the emission credits.With Clean Air Act coming into effect, Texas State Implementation Plan has given ahigh challenge to the chemical industries in Texas. The new revisions proposed to TAC(Texas Administrative Code) Title 30 Chapter 101 & Chapter 115 [2,3] issued by TCEQwill become effective upon adoption by January 2003. More and more stringent standardsare required to meet for the chemical industry.On the other hand, chemical manufacturing facilities constantly change to meet globalcompetition and new environmental laws and regulations. The enterprise environmentaldata management system must reflect these changes to insure accurate, consistentreporting. For companies with dozens of facilities, the volume of information is huge and1
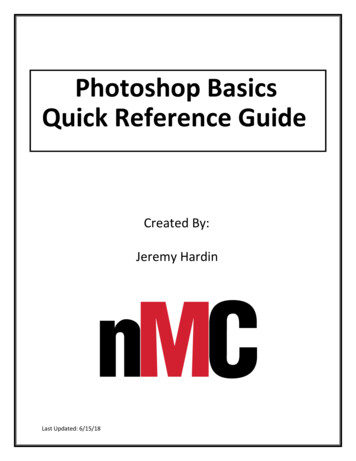
the sources are many. A disciplined work process enabled by new technology is neededto effectively handle the volume and diversity of change information.Information technology is an approach to help chemical process industry (CPI) getmore accurate information of processes and emissions. So they can make more effective,reliable and proactive way for achieving air compliance. OMS lab, which has beensetting up in Lamar University, is to integrate commercial software packages used in CPIby developing bridge packages. We can use the real-time process data from DCS tocompute the emission data. The real-time emissions inventory can be very useful to helpplant managers make a more accurate, reliable and proactive decision so as to reduce thenumber of events and minimize the emissions. Self- regulative environmentalmanagement can be achieved by this way.The information technology package developed in this study can be used in theemissions inventory for the regional air monitoring and control. Emissions from fugitivearea and point sources are the main contributors to the emissions inventory. A criticalportion of air emission is VOC (Volatile Organic Compound) that contributes to theozone formation [3]. The monitoring and control of highly reactive VOC (HR VOC) hasbeen required by several states such as Texas [4]. Current inventory indicates that highlyreactive VOC are released from the process plants in the Houston-Galveston Area asgiven in Table 1:Table 1. Main sources of HR VOC in HGA [4]Fugitive EmissionFlaresVent Gas ControlCooling Tower48%30%8%7%Both fugitive emission and flares are the major contributors to the emission inventory.OMS lab will deal with these two major sources in this paper.OMS LabThe OMS Lab consists of computerFigure 1. OMS Lab at Lamarhardware and software to link all theDCScomponents together: a DCS (DistributedProcessAMSControl System), a process dynamicSimulatorsimulator, an air model, an EIMS(environmental information managementLinking Enginesystem), and an asset management solution(AMS). The OMS laboratory is not only alink but also allows communication andEIMSAir Modeldata exchange between the variouscomponents of the system. The dataexchange between the different sources,applications, and users will be handled through a Linking engine. This allows seamless2
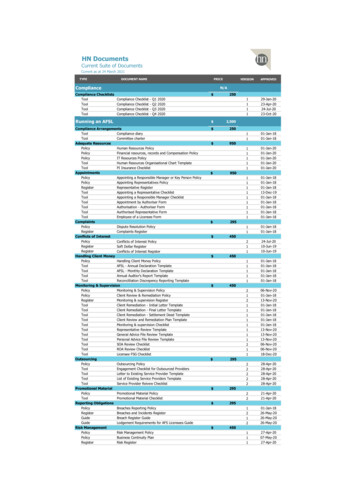
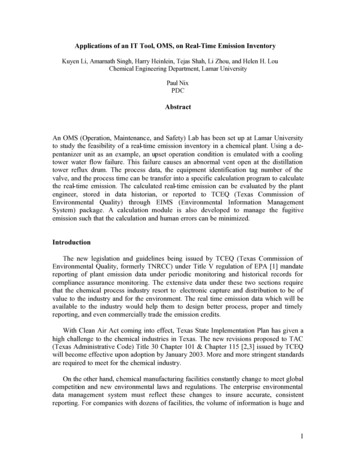
transfer of data, and permit the analysis and report generation. The software being usedare Aspen, Hysys for process plant simulation; PDC – COMPASS for emission inventoryreports; and MocKingbird for the linking engine.Fugitive Emission Management – OMS Application 1Emissions that are not released through a stack, vent, duct pipes or other confines airstreams are termed as fugitive sources. These emissions include equipment leaks and areaemissions. It is very difficult and expensive to detect and estimate such emissions. It isadvisable to calculate the fugitive emissions with the help of data available from thedirect measurement. Industries are free to use any method to estimate the fugitiveemissions. The emission factors given by the Synthetic Organic Chemical ManufacturingIndustry (SOCMI) are widely used to perform the calculations.Although fugitive emissions were known to the regulatory agencies, no estimation orstandard method was developed until early 80’s. Regulations during 80’s requiredfacilities to estimate and control fugitive emissions. The EPA began to develop a series ofNational Emission Standards for Hazardous Air Pollutants (NESHAPs), whichestablished emission standard for industries. NESHAP includes the leak detection andrepair (LDAR) program to detect, estimate and reduce fugitive emissions. In 1986,Congress passed the Superfund Amendments and Reauthorization Act (SARA), whichrequire industries to quantify the levels of certain chemicals to waste as well as the loss ofthose chemicals to fugitive emissions. The plant are required to estimate fugitiveemissions every six months to determine the facility’s compliance with operating permitsaccording to the Clean Air Act Amendment (CAA) of 1990.In the OMS lab, the module forcalculating fugitive emission isLine Listdeveloped using Visual Basic.DatabaseMocKingbird linking engine is used toprovide the easy access for theoperator to locate the leakingCalculationExcelcomponent from P&ID. Using theModule forSpreadFugitiveSheetuser interface, the operator enters theEmissionTag ID of the leaking component,timestamp the start of a leak and theFugitiveEmissionscreening value measured for thatFactorcomponent. Visual Basic moduleDatabasequeries the “line list” database in orderReportsChapter 115to check the phase and thecomposition of the process streamassociated with the component. BasedFigure 2. Flow-diagram for fugitive emissions calculationon the available data module queriesthe emission factor database to pull out the required emission factor for the massOperatorInterfaceMockingbirdP&ID of theprocess3
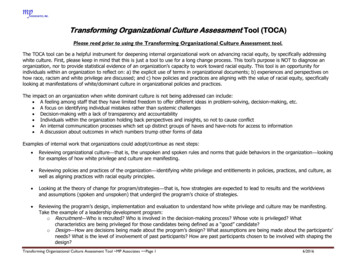
emission rate calculation. The obtained emission factor is transferred to the Excel SpreadSheet for calculation. Based on the emission factor, the emission rate is calculated in theExcel spreadsheet using built- in macro when repair/leak is rectified. The flow-diagram ofthis real-time emissions calculation process can be seen from Figure 2.Process Upset Emission Management – OMS Application 2Upset/Startup/Shutdown and maintenance activities can have significant emissions ascompared to routine emission levels. These emissions may contribute to the ozone spikeobserved in a heavy industrial area. Conclusion from the Episodic Release ReductionInitiative (ERRI) Report of 2000 gives the root causes of these emissions is shown asTable 2.From the results, equipment failure, process upsets, human factors andStartup/Shutdown are the main sources of the episodic release. TAC Title 30 Chapter 101gives the new rules for process upset and scheduled maintenance, start up and shut downactivities.Table 2. Root Causes of Episodic Release [5]Root Causes of Release (No. of releases)%Equipment failureProcess UpsetsHuman FactorsStartup/ShutdownEquipment DesignProceduresOther (corrosion, instrument, seal etc)27141098824In reality upset emissions are the least understood because there are many unexpectedthings happening at the same time and process is in a special unsteady state mode, hencemany guesses have to be made for emission estimates. Sometimes, even the actualbeginning time of an upset and associated emission are difficult to pinpoint. And theannual emission inventory number is not an accurate measurement. Real-time emissionsinventory for upset event is necessary in order to have an accurate report. The real-timedata can also be used for further analysis and study to reduce the emission events.This application is focusing on the process-upset situation. An example of coolingwater failure in a de-pentanizer unit is used, as can be seen from the flow-diagram givenin Figure 3. When the cooling water failure is occurred, the temperature at the refluxcondenser goes up, eventually the vent valve opens and the alarm goes on. Usually, theoperator has to deal with this emergency situation. That is to cut down the steam to there-boiler and cut down the feed stream to the distillation column. Currently, the emission4
caused by this process upset is calculated manually. The decision for emission eventnotification to the regulatory agency will be made by the EHS (Environment, Health, andSafety) supervisor, and the report will be filed within two weeks after the event. Thisprocedure is very time consuming and could make mistakes. Therefore, the informationtechnology can be adapted to improve this emission calculations and reporting.Cooling waterfailure for thecondenserAlarmDCS or SensorsDatabaseReal-time & 24hourscumulativeemissions fromthe ventReportableor Not?Notificationor FinalReportVB ProgramFigure 3. Flow Diagram For Upset Emissions CalculationA computer module is developed here to transfer the process data from DCS(Distributed Control System) into the database for calculation. The real-time emissionscan be calculated by a VB program and compared with the permit limitation. Theoperator can have the real-time emission information on line and can decide whether thisis a reportable emission event or not. If this is a reportable event, notification and finalreport can be generated automatically by this module. Human mistakes can be avoided.ConclusionThe OMS tool is a powerful IT tool for the application of calculating the real-timeemission inventory in CPI (Chemical Process Industry). Human errors during thecalculation and reporting can be reduced by using OMS tool. OMS lab will help industryto implement self- regulated environmental management system. OMS tool willconsiderably reduce manpower associated with environmental compliance and at thesame time maintaining adequate records for analysis and trouble shooting.AcknowledgmentThe authors appreciate the financial support from the Texas Air Research Center (TARC)and the software contributions from SSI, PDC, and MocKingbird.References[1] http://www.epa.gov/oar/caa/contents.html[2] d/state/statehp.htm[3] Seinfeld, J. H. and S. N. Pandis “Atmospheric Chemistry and Physics”, John Wileyand Sons, Inc., New York (1998)5
[4] http://www.tnrcc.state.tx.us/oprd/rule lib/proposals/02046b115 pro.pdf[5] isodicEmissRedRpt.pdf6
emission rate calculation. The obtained emission factor is transferred to the Excel Spread Sheet for calculation. Based on the emission factor, the emission rate is calculated in the Excel spreadsheet using built-in macro when repair/leak is rectified. The flow-diagram of this real-time emissions calculation process can be seen from Figure 2.