Transcription
Towards Probabilistic Identificationof Zero-day Attack PathsXiaoyan Sun † , Jun Dai† , Peng Liu , Anoop Singhal‡ and John Yen PennsylvaniaState University, University Park, PA 16802, USAState University, Sacramento, CA 95819, USA‡ National Institute of Standards and Technology, Gaithersburg, MD 20899, USAEmail: {xzs5052, pliu, jyen}@ist.psu.edu, jun.dai@csus.edu, anoop.singhal@nist.gov† CaliforniaAbstract—Zero-day attacks continue to challenge the enterprise network security defense. A zero-day attack path isformed when a multi-step attack contains one or more zero-dayexploits. Detecting zero-day attack paths in time could enableearly disclosure of zero-day threats. In this paper, we proposea probabilistic approach to identify zero-day attack paths andimplement a prototype system named ZePro. An object instancegraph is first built from system calls to capture the intrusionpropagation. To further reveal the zero-day attack paths hidingin the instance graph, our system constructs an instance-graphbased Bayesian network. By leveraging intrusion evidence, theBayesian network can quantitatively compute the probabilities ofobject instances being infected. The object instances with highinfection probabilities reveal themselves and form the zero-dayattack paths. The experiment results show that our system caneffectively identify zero-day attack paths.I.I NTRODUCTIONDefending against zero-day attacks is one of the mostfundamentally challenging security problems yet to be solved.Zero-day attacks are usually enabled by unknown vulnerabilities. The information asymmetry between what the attackerknows and what the defender knows makes zero-day exploitsextremely hard to detect. Signature-based detection assumesthat a signature is already extracted from detected exploits.Anomaly detection [1]–[3] may detect zero-day exploits, butthis solution has to cope with high false positive rates.Considering the extreme difficulty of detecting individualzero-day exploits, a substantially more feasible strategy is toidentify zero-day attack paths. In real world, to achive theattack goal, attack campaigns rely on a chain of attack actions,which forms an attack path. Each attack chain is a partialorder of exploits and each exploit is exploiting a particularvulnerability. A zero-day attack path is a multi-step attack paththat includes one or more zero-day exploits. A key insight indealing with zero-day attack paths is to analyze the chainingeffect. Typically, it is not very likely for a zero-day attack chainto be 100% zero-day, namely having every exploit in the chainbe a zero-day exploit. Hence, defenders can assume that 1)the non-zero-day exploits in the chain are detectable; 2) thesedetectable exploits have certain chaining relationships with thezero-day exploits in the chain. As a result, connecting thedetected non-zero-day segments through a path is an effectiveway of revealing the zero-day segments in the same chain.Both alert correlation [4], [5] and attack graphs [6]–[9]are possible solutions for generating potential attack paths, butthey are limited in revealing the zero-day ones. They bothcan identify the non-zero-day segments (i.e., “islands”) of azero-day attack path; however, none of them can automaticallybridge all segments into a meaningful path and reveal the zeroday segments, especially when different segments may belongto totally irrelevant attack paths.To address these limitations, Dai et al. proposed a systemcalled Patrol [10] to identify real zero-day attack paths froma large set of suspicious intrusion propagation paths generatedthrough tracking dependencies between OS-level objects. Theset of suspicious dependency paths is usually very huge or evensuffers from serious path explosion problem. A root cause forsuch explosion is that dependencies introduced by legitimateactivities and dependencies introduced by zero-day attacks areoften tangled together. Hence, Patrol made an assumption thatextensive pre-knowledge are available to distinguish real zeroday attack paths from suspicious ones: common features orattack patterns of known exploitations can be extracted at theOS-level to help recognize future unknown exploitations ifsimilar features appear again. However, this assumption is toostrong in that 1) the acquirement of such pre-knowledge isquite difficult. It is a very ad hoc and effort consuming process.It relies heavily on the availability of the history for knownvulnerability exploitations; 2) Even if the history is available,investigating and crafting the common features at OS-levelfor all types of exploitations requires immeasurable amount ofhuman analysts’ efforts or even the whole community’s efforts.Therefore, in this paper, we propose a probabilistic approach to identify the zero-day attack paths. Our approach isto 1) establish an object instance graph to capture the intrusionpropagation, where an instance of an object is a “version”of the object with a specific timestamp; 2) build a Bayesiannetwork (BN) based on the instance graph to leverage theintrusion evidence collected from various information sources.Intrusion evidence can be the abnormal system and networkactivities that are noticed by human admins or security sensorssuch as Intrusion Detection Systems (IDSs). With the evidence,the instance-graph-based BN can quantitatively compute theprobabilities of object instances being infected. Connectedthrough dependency relations, the instances with high infectionprobabilities form a path, which can be viewed as a zero-dayattack path. This approach does not require any pre-knowledgefor the common features of known exploitations at OS-level.The significance of our approach is as follows: 1) Ourapproach is systematic because Bayesian networks can incorporate literally all kinds of knowledge the defender has aboutthe zero-day attack paths. The knowledge includes but is notlimited to alerts generated by security sensors such as IDS andTripwire, reports provided by vulnerability scanners, systemlogs, or even human inputs. 2) Our approach does not relyon particular assumptions or preconditions. Therefore, it is
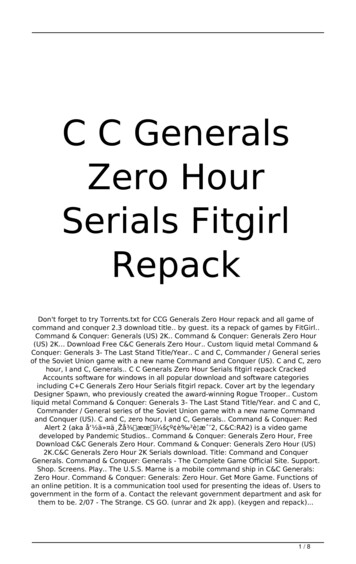
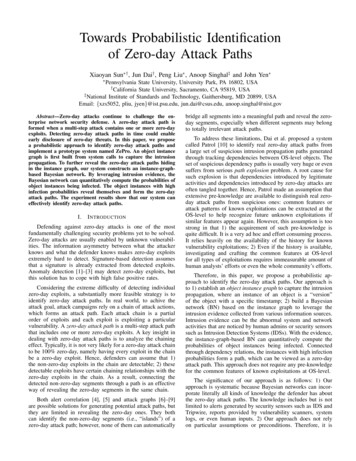
essprocessAAABCBreads file 1creates process Bcreates process Cwrites file 2writes file 1reads file 3(a) Simplified system call log in time-ordert1file 3process At6t2process B.file 1t3p1t5p3process Ct4file 2(b) SODGFigure 1: An SODG generated by parsing an example set of simplifiedsystem call log. The label on each edge shows the time associated with thecorresponding system call.applicable to almost all kinds of enterprise networks. 3) Ourapproach is elastic. Whenever new knowledge is gained aboutzero-day attacks, such new knowledge can be incorporated andthe effectiveness of our approach can be enhanced. Whenevererroneous knowledge is identified, our approach can easily getrid of the negative effects of the wrong knowledge. 4) The toolwe built is automated. Today’s security analysis relies largelyon the manual work of human security analysts. Our automatedtool can significantly save security analysts’ time and addressthe human resource challenge.To summarize, we made the following contributions. To the best of our knowledge, this work is the firstprobabilistic approach towards zero-day attack pathidentification. We proposed constructing Bayesian network at thesystem object level by introducing the object instancegraph. We have designed and implemented a system prototype named ZePro, which can effectively and automatically identify zero-day attack paths.II.p2R ATIONALES AND M ODELSThis paper classifies OS-level entities in UNIX-like systems into three types of objects: processes, files and sockets.The operating system performs a set of operations towardsthese objects via system calls such as read, write, etc. Forinstance, a process can read from a file as input, and then writeto a socket. Such interactions among system objects enableintrusions to propagate from one object to another. Generallyan intrusion starts with one or several seed objects that arecreated directly or indirectly by attackers. The intrusion seedscan be processes such as compromised service programs, orfiles such as viruses, or corrupted data, etc. As the intrusionseeds interact with other system objects via system call operations, the innocent objects can get infected. We call thisprocess as infection propagation. Therefore the intrusion willpropagate throughout the system, or even propagate to thenetwork through socket communications.To capture the intrusion propagation, previous work [14],[15] has explored constructing system level dependency graphsby parsing system call traces. This type of dependency graph isknown as System Object Dependency Graphs (SODGs). Eachsystem call is interpreted into three parts: a source object,a sink object, and a dependency relation between them. Theobjects and the dependencies respectively become nodes anddirected edges in SODGs. For example, a process reading afile in the system call read indicates that the process (sink)p4CPT at node p2p1 T p1 Fp2 T 0.9 0.01p2 F 0.1 0.99.Figure 2: An example Bayesian network.depends on the file (source). The dependency is denoted asfile!process. Similar rules as used in previous work [14],[15] can be adopted to generate such dependencies by parsingsystem calls such as read, write, fork, send, recv, and so on.Figure 1b is an example SODG generated by parsing thesimplified system call log shown in Figure 1a.A. Why use Bayesian Network?The BN is a probabilistic graphical model that representsthe cause-and-effect relations. It is formally defined as aDirected Acyclic Graph (DAG) that contains a set of nodesand directed edges, where a node denotes a variable of interest,and an edge denotes the causality relations between twonodes. The strength of such causality relation is indicatedusing a conditional probability table (CPT). Figure 2 showsan example BN and the CPT tables associated with p2 . Givenp1 is true, the probability of p2 being true is 0.9, which canbe represented with P (p2 T p1 T ) 0.9. Similarly, theprobability of p4 can be determined by the states of p2 andp3 according to a CPT table at p4 . BN is able to incorporatethe collected evidence by updating the posterior probabilitiesof interested variables. For example, after evidence p2 Tis observed, it can be incorporated by computing probabilityP (p1 T p2 T ).The BN can be applied on top of the system level dependency graph for the following benefits. First, BN is aneffective tool to incorporate intrusion evidence from a varietyof information sources. Alerts generated by different securitysensors are usually isolated from each other. As a unifiedplatform, BN is able to leverage these alerts as attack evidenceto aid the security analysis. Second, BN can quantitativelycompute the probabilities of objects being infected. The inferred probabilities are the key guidance to identify zeroday attack paths. By only focusing on the objects with highinfection probabilities, the set of suspicious objects can besignificantly narrowed down. The zero-day attack paths formedby the high-probability objects through dependency relationsis thus of manageable size.B. Problems of Constructing BN based on SODGSODG has the potential to serve as the base of BNconstruction. For one thing, BN has the capability of capturingcause-and-effect relations in infection propagation. For anotherthing, SODG reflects the dependency relations among systemobjects. Such dependencies imply and can be leveraged toconstruct the infection causalities in BN. For example, thedependency process A!file 1 in an SODG can be interpretedinto an infection causality relation in BN: file 1 is likely tobe infected if process A is already infected. In such a way,an SODG-based BN can be constructed by directly taking thestructure topology of SODG.However, several drawbacks of the SODG prevent it frombeing the base of BN. First, an SODG without time labels
cannot reflect the correct information flow according to thetime order of system call operations. This is a problem becausethe time labels cannot be preserved when constructing BNsbased on SODGs. Lack of time information will cause incorrect causality inference in the SODG-based BNs. For example,without the time labels, the dependencies in Figure 1b indicatesinfection causality relations existing among file 3, process Band file 2, meaning that if file 3 is infected, process B andfile 2 are likely to be infected by file 3. Nevertheless, the timeinformation shows that the system call operation “process Breads file 3” happens at time t6, which is after the operation“process B writes file 2” at time t4. This implies that thestatus of file 3 has no direct influence on the status of file 2.Second, the SODG contains cycles among nodes. For instance,file 1, process A and process C in Figure 1b form a cycle. Bydirectly adopting the topology of SODG, the SODG-based BNinevitably inherits cycles from SODG. However, the BN is anacyclic probabilistic graphical model that does not allow anycycles. Therefore, in this paper we propose a new type ofdependency graph, the object instance graph, to address theabove problems.C. Object Instance GraphIn the object instance graph, each node is not an object, butan instance of the object with a specific timestamp. Differentinstances are different “versions” of the same object at differenttime points, and can thus have different infection status.Definition 1. Object Instance GraphIf the system call trace in a time window T [tbegin , tend ] isdenoted as T and the set of system objects (mainly processes,files or sockets) involved in T is denoted as OT , then theobject instance graph is a directed graph GT (V , E), where: V is the set of nodes, and initialized to empty set ?; E is the set of directed edges, and initialized to emptyset ?; If a system call syscall 2 T is parsed into twosystem object instances srci , sinkj , i, j1, and adependency relation depc : srci !sinkj , where srciis the ith instance of system object src 2 OT , andsinkj is the j th instance of system object sink 2OT , then V V [ {srci , sinkj }, E E [ {depc }.The timestamps for syscall, depc , srci , and sinkj arerespectively denoted as t syscall, t depc , t srci , andt sinkj . The t depc inherits t syscall from syscall.The indexes i and j are determined before adding srciand sinkj into V by:For 8 srcm , sinkn 2 V , m, n 1, if imax andjmax are respectively the maximum indexes ofinstances for object src and sink, and;If 9 srck 2 V , k1, then i imax , andt srci stays the same; Otherwise, i 1, andt srci is updated to t syscall;If 9 sinkz 2 V , z1, then j jmax 1;Otherwise, j 1. In both cases t sinkj isupdated to t syscall; If j 2, then E E [{deps : sinkj 1 !sinkj }. If a!b 2 E and b!c 2 E, then c transitively dependson a.file 1 instance 1t1process A instance 1t2file 3 instance 1t6process B instance 2t3t5process B instance 1 process C instance 1t6t4file 2 instance 1t5file 1 instance 2Figure 3: An instance graph generated by parsing the same set of simplifiedsystem call log as in Figure 1a. The label on each edge shows the timeassociated with the corresponding system call operation. The dotted rectangleand ellipse are new instances of already existed objects. The solid edges andthe dotted edges respectively denote the contact dependencies and the statetransition dependencies.According to Definition 1, for src object, a new instanceis created only when no instances of src exist in the instancegraph. For sink object, however, a new instance is createdwhenever a src!sink dependency appears. The underlyinginsight is that the status of the src object will not be alteredby src!sink, while the status of sink will be influenced.Hence a new instance for an object should be created whenthe object has the possibility of being affected. A dependencydepc is added between the most recent instance of src andthe newly created instance of sink. We name depc as contactdependency because it is generated by the contact between twodifferent objects through a system call operation.In addition, when a new instance is created for an object,a new dependency relation deps is also added between themost recent instance and the new instance of the same object.This is necessary and reasonable because the status of the newinstance can be influenced by the status of the most recentinstance. We name deps as state transition dependency becauseit is caused by the state transition between different instancesof the same system object.The instance graph can well tackle the problems existingin the SODG for constructing BNs. It can be illustrated usingFigure 3, an instance graph created for the same simplifiedsystem call log as in Figure 1a. First, the instance graph isable to reflect correct information flows by implying timeinformation through creating object instances. For example,instead of parsing the system call at time t6 directly into file3!process B, Figure 3 parsed it into file 3 instance 1!processB instance 2. Comparing to Figure 1b in which file 3 hasindirect infection causality on file 2 through process B, theinstance graph in Figure 3 indicates that file 3 can only infectinstance 2 of process B but no previous instances. Hence in thisgraph file 3 does not have infection causality on file 2. Second,instance graphs can break the cycles contained in SODGs.Again, in Figure 3, the system call at time t5 is parsed intoprocess C instance 1!file 1 instance 2, rather than processC!file 1 as in Figure 1b. Therefore, instead of pointing backto file 1, the edge from process C is directed to a new instanceof file 1. As a result, the cycle formed by file 1, process A andprocess C is broken.III. I NSTANCE - GRAPH - BASED BAYESIAN N ETWORKSTo build a BN based on an instance graph and computeprobabilities for interested variables, two steps are required.First, the CPT tables have to be specified for each nodevia constructing proper infection propagation models. Second,
.sinkjsrcisinkj 1.CPT at node sinkj 1sinkj Infectedsinkj Uninfectedsrci Infected srci Uninfected srci Infected srci Uninfectedsinkj 1 Infected11sinkj 1 Uninfected0011.p1p2p4The rest of BNp5p3p6Actual State of an InstanceFigure 4: The infection propagation models.evidence from different information sources has to be incorporated into BN for subsequent probability inference.A. The Infection Propagation ModelsIn instance-graph-based BNs, each object instance has twopossible states, “infected” and “uninfected”. Our infectionpropagation models deal with two types of infection causalities, contact infection causalities and state transition infectioncausalities, which correspond to the contact dependencies andstate transition dependencies in instance graphs.Contact Infection Causality Model. This model capturesthe infection propagation between instances of two differentobjects. Contact infection causality is formed due to theinformation flow between the two objects in a system calloperation. Figure 4 shows a portion of BN constructed when adependency src!sink occurs and the CPT for sinkj 1 . Whensinkj is uninfected, the probability of sinkj 1 being infecteddepends on the infection status of srci , a contact infection rate and an intrinsic infection rate , 0 , 1.The intrinsic infection rate decides how likely sinkj 1gets infected given srci is uninfected. In this case, since srciis not the infection source of sinkj 1 , if sinkj 1 is infected,it should be caused by other factors. So can be determinedby the prior probabilities of an object being infected, which isusually a very small constant number.The contact infection rate determines how likely sinkj 1gets infected when srci is infected. The value of determinesto which extent the infection can be propagated within therange of an instance graph. In an extreme case where 1, all the object instances will get contaminated as long asthey have contact with the infected objects. In another extremecase where 0, the infection will be confined inside theinfected object and does not propagate to any other contactingobject instances. Our system allows security experts to tunethe value of based on their knowledge and experience. Wewill evaluate the impact of and in Section VI.State Transition Infection Causality Model. This modelcaptures the infection propagation between instances of thesame objects. We follow one rule to model this type of causalities: an object will never return to the state of “uninfected”from the state of “infected”1 . That is, once an instance ofan object gets infected, all future instances of this object willremain the infected state, regardless of the infection status ofother contacting object instances. This rule is enforced in theCPT exemplified in Figure 4. If sinkj is infected, the infectionprobability of sinkj 1 keeps to be 1, no matter whether srci isinfected or not. If sinkj is uninfected, the infection probabilityof sinkj 1 is decided by the infection status of srci accordingto the contact infection causality model.B. Evidence IncorporationBN is able to incorporate security alerts from a varietyof information sources as the evidence of attack occurrence.1 This rule is formulated based on the assumptions that no intrusion recoveryoperations are performed and attackers only conduct malicious activities.CPT at node Observationp7p8Observation TrueObservation FalseObservationActual Infected Actual si)ve&rate!Figure 5: Local observation model [19].In this paper, we adopt two ways to incorporate evidence.First, add evidence directly on a node by providing theinfection state of the instance. If human security experts havescrutinized an object and proven that an object is infected ata specific time, they can feed the evidence to the instancegraph-based BN by directly changing the infection statusof the corresponding instance into infected. Second, leverage the local observation model (LOM) [19] to model theuncertainty towards observations. Human security admins orsecurity sensors may notice suspicious activities that implyattack occurrence. Nonetheless, these observations often sufferfrom false rates. As shown in Figure 5, an observation nodecan be added as the direct child node to an object instance.The implicit causality relation is that the actual state of theinstance can likely affect the observation to be made. If theobservation comes from security alerts, the CPT inherentlyindicates the false rates of the security sensors. For example,P (Observation True Actual Uninfected) shows the falsepositive rate and P (Observation False Actual Infected)indicates the false negative rate.IV.S YSTEM D ESIGNFigure 6 shows the overall system design.System call auditing and filtering. System call auditing isperformed against all running processes and should preservesufficient OS-aware information. Subsequent system call reconstruction can thus accurately identify the processes and filesby their process IDs or file descriptors. The filtering processbasically prunes system calls that involve redundant and verylikely innocent objects, such as the dynamic linked library filesor some dummy objects. We conduct system call auditing atrun time towards each host in the enterprise network.System call parsing and dependency extraction. The collected system call traces are then sent to a central machinefor off-line analysis, where the dependency relations betweensystem objects are extracted.Graph generation. The extracted dependencies are thenanalyzed line by line for graph generation. The generatedgraph can be either host-wide or network-wide, dependingon the analysis scope. A network-wide instance graph canbe constructed by concatenating individual host-wide instancegraphs through instances of the communicating sockets.BN construction. The BN is constructed by taking thetopology of an instance graph. The instances and dependenciesin an instance graph become nodes and edges in BN. The nodesand the associated CPT tables are specified in a .net file, whichis one file type that can carry the instance-graph-based BN.Evidence incorporation and probability inference. Evidence is incorporated by either providing the infection state ofthe object instance directly, or constructing an local observation model (LOM) for the instance. After probability inference,each node in the instance graph receives a probability.
System ComponentsSystem Call Auditingand FilteringSystem Call Parsing andDependency ExtractionSystem Call TracesGraphGenerationDependenciesBN ConstructionInstance GraphsEvidence Incorporation andProbability InferenceInstance-graph-based BNInterim OutputsZero-day Attack PathIdentificationInstance Graphs with ProbabilitiesInputZero-day AttackPathsOutputFigure 6: System design.Zero-day attack paths identification. To reveal the zero-dayattack paths from the mess of instance graphs, the nodes withhigh probabilities are to be preserved, while the link betweenthem should not be broken. We implemented an algorithmbased on the depth-first search (DFS) algorithm to tag eachnode in the instance graph as either possessing high probabilityitself, or having both an ancestor and a descendant with highprobabilities. The tagged nodes are the ones that actuallypropagate the infection through the network, and thus shouldbe preserved in the final graph. Our system allows a probabilitythreshold to be tuned for recognizing high-probability nodes.For example, if the threshold is set at 80%, only instancesthat have the infection probabilities of 80% or higher will berecognized as the high-probability nodes.V. I MPLEMENTATIONThe whole system includes online system call auditing andoff-line data analysis. System call auditing is implemented witha loadable kernel module. For the off-line data analysis, ourprototype is implemented with approximately 2915 lines ofgawk code that constructs a .net file for the instance-graphbased BN and a dot-compatible file for visualizing the zeroday attack paths in Graphviz [21], and 145 lines of Java codefor probability inference, leveraging the API provided by theBN tool SamIam [20].An instance graph can be very large due to the introductionof instances. Therefore, in addition to system call filtering, wealso develop several ways to prune that instance graphs whilenot impede reflecting the major infection propagation process.One helpful way is to ignore the repeated dependencies. Itis common that the same dependency may happen between twosystem objects for a number of times, even through differentsystem call operations. For example, process A may writefile 1 for several times. In such cases, each time the writeoperation occurs, a new instance of file 1 is created and anew dependency is added between the most recent instanceof process A and the new instance of file 1. If the status ofprocess A is not affected by any other system objects duringthis time period, the infection status of file 1 will not changeneither. Hence the new instances of file 1 and the related newdependencies become redundant information in understandingthe infection propagation. Therefore, a repeated src!sinkdependency can be ignored if the src object is not influencedby other objects since the last time that the same src!sinkdependency appeared.Another way to prune an instance graph is to ignore theroot instances whose original objects have never appear as thesink object in a src!sink dependency during the time periodof being analyzed. For instance, file 3 in Figure 3 only appearsas the src object in the dependencies parsed from the systemcall log in Figure 1a, so file 3 instance 1 can be ignored in thesimplified instance graph. Such instances are not influencedby other objects in the specified time window, and thus arenot manipulated by attackers, neither. Hence ignoring theseroot instances does not break any routes of intrusion sequenceand will not hinder the understanding of infection propagation.This method is helpful for situations such as a process readinga large number of configuration or header files.A third way is to ignore some repeated mutual dependencies, in which two objects will keep affecting each otherthrough creating new instances. One situation is that a processcan frequently send and receive messages from a socket. Forexample, in one of our experiments, 107 new instances arecreated respectively for the process (pid:6706, pcmd:sshd) andthe socket (ip:192.168.101.5, port: 22) due to their interaction.Since no other objects are involved during this procedure, theinfection status of these two objects will keep the same throughall the new instances. Thus a simplified instance graph canpreserve the very first and last dependencies while neglect themiddle ones. Another situation is that a process can frequentlytake input from a file and then write the output to it again aftersome operations. The middle repeated mutual dependenciescould also be ignored in a similar way.VI.E XPERIMENTSA. Attack ScenarioTo demonstrate the merits of our system and compareexperiment results with Patrol [10], we implemented a similarattack scenario as in Patrol. We built a test-bed network andlaunched a three-step attack towards it. Figure 7 illustratesthe attack scenario. Step 1, the attacker exploits vulnerabilityCVE-2008-0166 [12] to gain root privilege on SSH Serverthrough a brute-force key guessing attack. Step 2, since theexport table on NFS Server is not set up appropriately, theattacker can upload a malicious executable file to a publicdirectory on NFS. The malicious file contains a Trojan-horsethat can exploit a vulnerability on a specific workstation. Thepublic directory is shared among all the hosts in the test-bednetwork so that a workstation may access and download thismalicious file. Step 3, once the malicious file is mounted andinstalled on the workstation, the attacker is able to executearbi
vulnerability. A zero-day attack path is a multi-step attack path that includes one or more zero-day exploits. A key insight in dealing with zero-day attack paths is to analyze the chaining effect. Typically, it is not very likely for a zero-day attack chain to be 100% zero-day, namely having every exploit in the chain be a zero-day exploit.