Transcription
APPLICATION NOTEVesicle Flow Cytometry (vFCTM) with theBeckman Coulter CytoFLEXJohn Nolan, PhD Cellarcus BiosciencesAbstractExtracellular Vesicles (EVs) are released by all cells and carry diverse cargo capable ofeliciting functional changes in nearby or distant cells. Measurement of EVs and their cargohas broad diagnostic applicability. Manipulation of EVs and their cargo promises therapeuticutility. However, progress in the field is stifiled by characteristic limitations of existing analysismethods that introduce serious uncertainty. Common methods such as nanoparticle trackinganalysis (NTA) have limited size resolution, no EV specificity, and cannot effectively measurecargo. Western blot and other methods used to measure EV cargo report total cargo insamples, not its presence on individual EVs.Flow cytometry stands out as a potentially ideal platform for single EV cargo analysis,but in the past, instrument sensitivity and poorly standardized, non-specific assays were alsoinsufficient for measurement of EVs. Recent advances in instrumentation, exemplified in theBeckman Coulter CytoFLEX, have resulted in significant improvement for the detection of dimsignals, which has promise for EV analysis. Parallel advances in assay design have built uponimproved instrumentation to enable standardized, specific, reproducible characterization ofEVs. In this article we will demonstrate use of Cellarcus’ Vesicle Flow Cytometry (vFC )assay to:1.Calibrate the instrument and determine performance across key metrics2. Sensitively detect EVs using the fluorogenic membrane probe vFRed andperform standardized measurement of EV concentration and size distribution3. Perform appropriately optimized, quantitative single- and multicolor EVcargo measurementPotential and challenges and for single EV analysisExtracellular vesicles (EVs) are released by all cells and can carry molecular cargo to nearbyor distant cells to affect their function. This makes EVs very interesting as mediators ofintercellular signaling, as well as potential targets for development of diagnostics andtherapeutics. Progress in the field to realize this potential faces a number of challenges1,most of which are limited by available methods to analyze EVs and their cargo, which tend tobe non-specific, low resolution, and slow.Every Event Matters 1
Review of the Minimum Information about Studies of EVs (MISEV)2 and EV-TRACK3(transparent reporting and centralizing knowledge in EV research), reveal that the mostcommon EV analysis methods combine ultracentrifugation (UC), which aims to enrich forsmall particles, with Western blotting to detect the presence of selected cargo. Often theUC pellet is subjected to nanoparticle tracking analysis (NTA) to estimate the concentrationand size distribution of nanoparticles present in the sample. Interpretation of such datais challenging, owing to the facts that UC can result in significant sample loss, aggregateformation, an co-precipitation of non-EV sample contaminants4. NTA’s light scatter-baseddetection approach has limited size resolution and no specificity for EVs, complicatingissues of UC and other enrichment methods. Bulk analysis methods such as Western blotreport only the total amount of cargo in a sample, and not its presence on individual EVs.These limitations of conventional EV analysis introduce serious uncertainty into attempts tomeasure EVs and their cargo, including whether cargo detected in EV-containing preps isassociated with EVs at all. Moreover, these methods are labor-, time-, and sample-intensive,limiting their usefulness in clinical applications.Progress in the field urgently demands new tools that can specifically measure cargo onindividual EVs with high resolution and throughput, ideally without the need for extensivesample processing.Standardization of EV flow cytometryFlow cytometry stands out as a potentially ideal platform for single EV cargo analysis, butseveral limitations have prevented widespread use5. First, most flow cytometers designedfor cell analysis lack the sensitivity needed to measure very dim EVs, and struggle to resolvesignals from noise. Second, most FC-based EV methods use light scatter to detect particles,an approach that lacks specificity and is challenged by very small signals compared to noise.Finally, a lack of understanding and use of the appropriate calibrators and controls rendersdata uninterpretable and hampers comparison of results between labs. New instrumentsoffer enhanced sensitivity and the possibility to detect EVs and other small particles.Built-for-purpose assays and reporting leverage enhanced instrument sensitivity to enableresearchers to make sensitive, specific, and quantitative measurements of individual EVs andtheir cargo. Detection of EVs and reproducible characterization that can be compared acrosslabs and time requires both instruments and assays to be successful.Recent advances in instrumentation have resulted in significant improvements in instrumentsensitivity useful for EV analysis. These advances are exemplified in the Beckman CoulterCytoFLEX, which features highly efficient light collection, spectral filtering, and detectors thatresults in significantly improved detection of dim signals6.Advances in assay design enable more effective EV measurement using sensitive flowcytometers. The Cellarcus Vesicle Flow Cytometry (vFCTM) assay uses a fluorogenicmembrane probe to selectively detect and size membrane vesicles, producing data similarto NTA or RPS, but with much greater specificity and throughput, as well as the abilityto make measurements of molecular cargo. vFC builds on efforts to standardize EVmeasurement which are led by the International Society for Extracellular Vesicles (ISEV)and the International Society for the Advancement of Cytometry (ISAC). These guidelines7aim to address the need for rigor and reproducibility in EV research and flow cytometryby developing consensus-driven recommendations for reporting on essential details.They specify a framework of controls and calibrators that are essential to facilitate comparisonof methods and results across labs, a critical requirement for advancement of EV research andclinical development, and those calibrators and controls are built into vFC assays.Every Event Matters 2
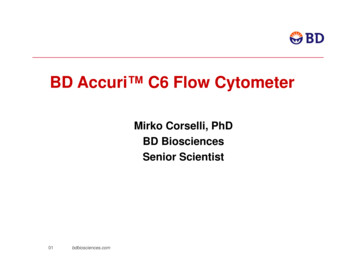
vFCTM: Specific and quantitative EV measurementThe vFCTM Assay (Figure 1) improves upon conventional FC approaches to EV detection byusing fluorescence from a membrane stain, vFRedTM, rather than light scatter, to selectivelydetect vesicles and estimate their size. Fluorescence-triggered EV detection offers improvedsensitivity and specificity compared to light scatter-based detection and simplifies samplepreparation, instrument setup, and data processing. The vFC assay design includes essentialcalibration and controls required for rigorous and reproducible analysis. Performed ona sensitive flow cytometer such as the CytoFLEX6, vFC provides sensitive and specificmeasurement of EV number, size, and molecular cargo in a reproducible and scalable manner.ABCDFigure 1. vFCTM assay workflow. (A) Sample (crude biofluid or enriched fractions) are diluted and (B) stained with vFRedTM and optimizedfluorescence markers. (C) Stained samples are then diluted and analyzed on a sensitive flow cytometer using vFRedTM fluorescence totrigger detection. (D) Data are then calibrated and reported.Instrument performance and calibrationInstrument performance characterization and calibration are key elements of rigorousand reproducible singe vesicle flow cytometry. Instrument optical detection performanceis characterized by the efficiency of light detection and the level of background noise,which generally determines the resolution of dim particles. Instrument fluidic performanceis characterized in terms of sample volumetric flow rate and linear velocity. Instrumentcalibration allows these measurements to be expressed in absolute units that can becompared between instruments and over time.The vFCTM Assay Kit includes calibrators and standards for instrument performancecharacterization and calibration. vCalTM nanoRainbow beads, sub-micron diameter multipeak,multifluorophore hard-dyed beads, enable rapid assessment of instrument performance. Laseralignment is assessed from the CV of the brightest bead, vFRed resolution is assessed by theseparation between the blank and dim beads, and the immunofluorescence channel intensitiescan be both assessed, and cross-calibrated against MESF or vCal calibrated antibodycapture beads to provide a robust calibration particle for routine use.Multipeak vCal calibrated antibody capture beads (Figure 2) enable quantitativeimmunofluorescence and multicolor measurements of EV cargo. Well characterized syntheticand cell-derived vesicles (Figure 2C) serve as standards for estimation of EV number,size, and molecular cargo. Together, these calibrators and standards enable quantitativemeasurements that can be compared across labs and over time.Every Event Matters 3
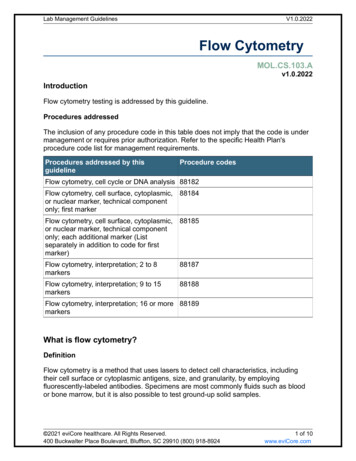
ABCFigure 2. Instrument performance characterization and calibration. Multi-peak, multifluorophore nanoRainbow beads allow assessmentof resolution in (A) vesicle detection (vFRedTM) and (B) immunofluorescence (PE) channels. nanoRainbow beads can be cross-calibratedagainst MESF beads (C) to provide an instrument-specific calibration bead set.vFCTM EV detection and sizingA typical vFC assay workflow is presented in (Figure 1). Sample is A) diluted to a particleconcentration that allows single EV analysis, B) stained with a fluorogenic membrane probe(vFRedTM) plus other probes (such as fluorescent antibodies), C) diluted and analyzed on theCytoFLEX, and the data is then D) loaded into the included data analysis template whichcalibrates and analyzes measurements to estimate EV size and cargo abundance. The entireassay takes place in a 96 well plate, can analyze EVs directly in biofluids or concentratedculture supernatants, and requires no wash steps or other sample processing.Experiment templates prepared using the CytExpert software contain information aboutfilter configuration, particle detection, and sample flow rate and acquisition time. For vFC ,the instrument is configured to trigger detection using vFRed fluorescence, and to recordvFRed pulse width. The filters are configured to enable detection of 405 nm light scatter(VSSC) without a neutral density filter, and each well is sampled for 120 seconds at 60 µL/min(High flow rate). Use of a standardized template ensures consistent instrument operation fromexperiment to experiment.Gating and data analysisvFC assay data is analyzed via a standardized analysis layout that facilitates reproducibleanalysis and data sharing. The analysis layout includes gating to exclude fluidic anomalies(Figure 3A) and background events while selecting events with characteristic fluorescenceand light scatter properties (Figure 3B).ABCFigure 3. vFCTM vesicle gating strategy. The standardized vFCTM gating involves (A) a time gate to eliminate fluidic artifacts resultingfrom sample boosting, (B) gating on vFRedTM pulse shape features (height and area) to eliminate low intensity background, and (C)gating on events with characteristic light scatter and vFRedTM fluorescence.Every Event Matters 4
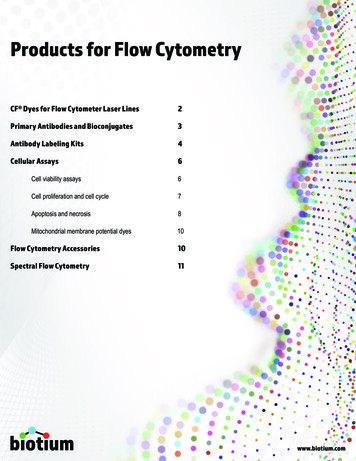
Vesicle size measurementIn vFC , vesicles are selectively detected via their vFRed fluorescence, which stainsmembranous particles with intensity proportional surface area. vFC takes advantage ofthese properties to estimate size from fluorescence. To illustrate, a synthetic membranevesicle preparation, Lipo100 , containing a population of vesicles ranging from 80-150 nm indiameter as measured by NTA or RPS (Figure 4B), is stained with vFRed and its fluorescencemeasured (Figure 4A). Plotting the Lipo100 surface area distribution (calculated fromdiameter measured from orthogonal methods and assuming a spherical shape) against thefluorescence distribution (Figure 4C), we find a linear relationship (Figure 4D) and can usethe slope of this line (which has units of Fluorescence unit/nm2) to estimate the Lipo100 sizefrom fluorescence intensity (Figure 4E,F). Thus, by using appropriate vesicle size standards,vFC provides EV size and concentration estimates similar to NTA or RPS, but with vesicleselectivity, which these methods lack.ABCEDFFigure 4. vFCTM size calibration. vFC size calibration uses a synthetic lipid vesicle (Lipo100), whose diameter (A) and surface area (B)has been estimated by an independent method such as NTA or RPS. The vFRed fluorescence distribution (C) is directly correlated withthe surface area distribution allowing the vFRed intensity/surface area (D) to be calculated, and used to express vFRed fluorescence asan equivalent surface area (E) or diameter (F).Specificity controlsThe vFCTM assay protocols include the necessary controls (Figure 5) to establish assaysensitivity and EV specificity. Buffer and reagent-only controls, incorporated throughout theplate, establish the background particle and signal levels that define sensitivity (Figure 5A).A typical vFC run, which analyzes 100 µL of stained and diluted sample, produces 1000background events in a buffer only control, and 2000 events in a vFRed -only control, whichresults in a conservative limit of detection (LOD, background mean 2 SD) /µL or 5000events, or 5e4/µL, after accounting for dilution steps during sample processing.A detergent control demonstrates the vesicular nature of detected events (Figure 5B).EVs and other vesicles are expected to be detergent sensitive and will be disruptedand solubilized by the addition of 0.1% detergent. Addition of detergent can increase thebackground slightly, as measured in a reagent-only control, but in a sample when theevents are vesicular in nature 90% of events will be eliminated. Most non-vesicular particles,including protein aggregates and lipoproteins are resistant to detergent treatment, andthe presence of detergent-resistant events are an indication of the presence of suchnon-vesicular contaminants.Every Event Matters 5
A dilution series control helps establish that the assay is measuring single particles(Figure 5C). When the number of EVs in a sample is within the linear range of the assay, thenumber of events in a sample decreases in proportion to dilution, but that the populationdistribution (and/or summary statistic such as median or mean) does not change significantly.For example, (Figure 5D) shows a linear decrease in number of events correspondingto dilution. The diameter distribution, however, remains constant. If the brightness of thepopulation (and median and means) also decreases significantly, this suggest that multipleparticles are being detectedACBDFigure 5. vFCTM Assay specificity controls. (A) Reagent-only controls allow estimation of the number of background events comparedto vesicle-containing samples. (B) Detergent sensitivity testing confirms the vesicular nature of the detected events. (C) Serial dilution ofsample establishes the dynamic range and sensitivity of the assay, and tests for the occurrence of coincidence (aka “swarm” detection).The dilution series control also establishes assay linearity and dynamic range, which typicallyextends from the background event counts from reagent only controls ( 2000/100 µL) to 500,000 events per 100 µL, above which point evidence of coincidence detection can oftenbe observed. In general, assays and standards are configured to detect 50,000 events/100 µL,with the assay working range extending a factor of 10 above and below this target.Every Event Matters 6
vFCTM EV cargo measurementsOne of the key limitations of other assays is inability to measure EV cargo at the single EVlevel. Single EV cargo measurement is required to fully understand EV heterogeneity andcharacterize EV subpopulations. Beyond specific and quantitative measurement of EV numberand size, vFC coupled with the exquisite sensitivity of the CytoFLEX enables no-wash,quantitative measurement of EV cargo. EV cargo can be labeled by several means includingfluorescent protein fusion expression, chemical or enzymatic labeling, or staining withfluorescently labeled antibodies with immunofluorescence being the most useful for measuringspecific proteins, especially on the membrane surface. Immunofluorescence of EVs usingvFC involves the same principles as immunofluorescence of cells, including the principles ofstaining optimization, specificity validation, panel design and fluorescence calibration.ABCDFigure 6. vFCTM Immunofluorescence. (A) Antibody titration on a positive control vesicle (PLT EVs) allows antibody staining conditionsto be optimized (B) for resolution from unstained controls (shaded histogram). (C) A vesicle lacking antigen (Lipo100) can serve as anegative control. (D) An irrelevant isotype control can reveal any Fc receptor-mediated binding of antibodies.Every Event Matters 7
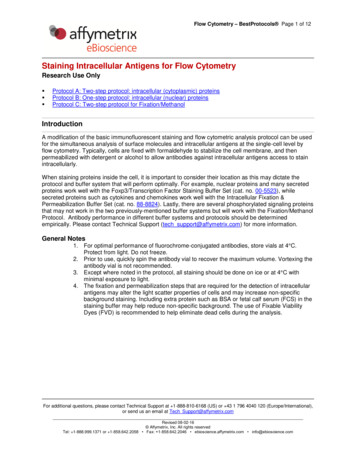
vFC ImmunofluorescenceEV surface cargo measurement depends on a calibrated instrument, validated antibodies,and optimized staining. Optimization and validation vFC immunofluorescence is bestaccomplished using appropriate calibration reagents with staining of known positive andnegative samples as reference materials to demonstrate appropriate specificity and sensitivity.For example, (Figure 6) shows the workflow for development of an anti-tetraspanin vTag antibody, the traditional positive EV marker run in vFC counting and sizing assays to complywith MISEV guidelines. This antibody cocktail contains multiple monoclonal antibodies withspecificity to the prominent tetraspanins CD9, CD63, and CD81. The binding properties ofeach antibody, as well of the mixture, and optimized via antibody titiraton and appropriatecontrols. Antibody titration identifies the saturating concentration that provides maximalbrightness while minimizing background. Specificity of staining is demonstrated using wellcharacterized human platelet (PLT) derived EVs as a positive control reference material, andLipo100TM vesicle standard, which bears no protein antigen, as a negative control. An isotypecontrol should be included to measure signal due to non-specific Fc interactions. A high signalin an isotype control necessitates pre-treatment with an Fc blocking reagent. The vTag anti-human TS cocktail has since been validated on EVs from dozens of sample types.Note: In single color staining experiments, PE is an excellent choice of a conjugate due to itsbrightness and wide availability. Additionally, availability of reference particles for calibrationof PE fluorescence into MESF units allows the data to be expressed in absolute units, whichequates with antibody molecules per vesicle for a singly labeled PE conjugate. Other colors aresuitable and may be used as dictated by proper panel design.Multicolor immunofluorescenceAs with flow cytometry of cells, extending single color immunofluorescence measurements toa multicolor panel requires consideration of tenets of proper panel design. EV surface cargo isoptimally measured using PE conjugates, as these are bright, widely available, and are readilycalibrated using commercial reagents as discussed above. However, measurement of multiplecargos requires the design and optimization of an appropriate multicolor staining panel. Keyconsiderations include, brightness of available conjugates, abundance of targets of interest,and expected co-expression of markers.To illustrate, we will consider a multicolor panel to stain EVs from PLTs red blood cells (RBCs),the two most abundant cell types in blood. RBCs bear abundant CD235 (glycophorin),which is restricted to RBCs and their parent reticulocytes, and is not expressed on platelets.CD41 (alpha II integrin), on the other hand, is highly expressed on platelets and their parentmegakaryocytes, but is absent from RBCs. (Figure 7) shows a multicolor vFC assaydesigned to identify platelet and RBC EVs by their respective cargo. Annexin V, which binds tothe procoagulant anionic phospholipid phosphatidylserine (PS) is used to stain EVs expressingsurface PS. As for panel design in cell analysis, panel design in vFCTM involves consideration ofantigen abundance, fluorophore brightness, spectral resolution, and availability. PE is brightand widely available, and is used here as a label for CD235, while CD41 and annexin V arelabeled with BV421 and PECy5, which are also very bright and spectrally distinct, respectively.Staining antibody capture beads allows the resolution provided by the different conjugatesto be assessed (a PECy5 antibody was used because annexin V is not an antibody) and theintensity to be reported in antibodies (or annexin V) bound per vesicle (ABV). Staining of EVpreparations made from washed PLTs and RBCs demonstrates the specificity of CD235 andCD41 staining, as well as revealing the both PLT and RBC EVs express PS on their surface,although at 10-fold low levels on RBC EVs compared to PLT EVs.Every Event Matters 8
ABCFigure 7. vFCTM multicolor immunofluorescence. (A) The brightness of fluorescence conjugates used in multi-marker panels canbe measured and calibrated using vCalTM antibody capture nanobeads, which enable immunofluorescence to be expressed in termsof antibodies bound per vesicle (ABV). This enables the specificity and abundance of cell-specific and generic EV markers to bedemonstrated and calibrated, for example the expression of (B) CD41 and annexin V on PLT-derived EVs and (C) CD235 and annexinV on RBC-derived EVs.Summary and ProspectsEVs are attracting increasing interest as intercellular signaling vehicles, disease biomarkers,and therapeutic agents, but progress in all of these areas is limited by our ability to makesensitive, quantitative, and reproducible measurements of individual EVs1. Flow cytometryis a potentially powerful approach to EV measurement, but conventional flow instrumentsand assays lack sensitivity and specificity5. vFCTM is an assay that takes advantage of thenew generation of highly sensitive flow cytometers, exemplified by the Beckman CoulterCytoFLEX6, to enable sensitive and specific measurement of EV number, size, and cargo.By combining optimized reagents and sample preparation and analysis protocols withsensitive measurement of EV fluorescence and light scatter, vFCTM on the CytoFLEX enablesdetection of EVs to 75 nm and detection of EV surface antibodies to 25 molecules pervesicle. Using optimally designed and validated multicolor staining panels, we can begin tounravel the unique EV surface signatures that inform on cell of origin, possible target cells,and the potential function. These data will be key to developing informative biomarkers,therapeutic strategies, and a better understanding of the mechanisms by which these diverseentities are formed and exert their effects.Every Event Matters 9
References1. M argolis, L.; Sadovsky, Y., The biology of extracellular vesicles: The known unknowns.PLOS Biology 2019, 17 (7), e3000363.2. Théry, C.; Witwer, K. W.; Aikawa, E.; Alcaraz, M. J.; Anderson, J. D.; Andriantsitohaina, R.;Antoniou, A.; Arab, T.; Archer, F.; Atkin-Smith, G. K.; Ayre, D. C.; Bach, J.-M.; Bachurski, D.;Baharvand, H.; Balaj, L.; Baldacchino, S.; Bauer, N. N.; Baxter, A. A.; Bebawy, M.; Beckham,C.; Bedina Zavec, A.; Benmoussa, A.; Berardi, A. C.; Bergese, P.; Bielska, E.; Blenkiron,C.; Bobis-Wozowicz, S.; Boilard, E.; Boireau, W.; Bongiovanni, A.; Borràs, F. E.; Bosch, S.;Boulanger, C. M.; Breakefield, X.; Breglio, A. M.; Brennan, M. Á.; Brigstock, D. R.; Brisson,A.; Broekman, M. L. D.; Bromberg, J. F.; Bryl-Górecka, P.; Buch, S.; Buck, A. H.; Burger, D.;Busatto, S.; Buschmann, D.; Bussolati, B.; Buzás, E. I.; Byrd, J. B.; Camussi, G.; Carter, D. R.F.; Caruso, S.; Chamley, L. W.; Chang, Y.-T.; Chaudhuri, A. D.; Chen, C.; Chen, S.; Cheng, L.;Chin, A. R.; Clayton, A.; Clerici, S. P.; Cocks, A.; Cocucci, E.; Coffey, R. J.; Cordeiro-da-Silva,A.; Couch, Y.; Coumans, F. A. W.; Coyle, B.; Crescitelli, R.; Criado, M. F.; D’Souza-Schorey,C.; Das, S.; de Candia, P.; De Santana, E. F.; De Wever, O.; del Portillo, H. A.; Demaret,T.; Deville, S.; Devitt, A.; Dhondt, B.; Di Vizio, D.; Dieterich, L. C.; Dolo, V.; DominguezRubio, A. P.; Dominici, M.; Dourado, M. R.; Driedonks, T. A. P.; Duarte, F. V.; Duncan, H. M.;Eichenberger, R. M.; Ekström, K.; El Andaloussi, S.; Elie-Caille, C.; Erdbrügger, U.;Falcón-Pérez, J. M.; Fatima, F.; Fish, J. E.; Flores-Bellver, M.; Försönits, A.; Frelet-Barrand,A.; Fricke, F.; Fuhrmann, G.; Gabrielsson, S.; Gámez-Valero, A.; Gardiner, C.; Gärtner,K.; Gaudin, R.; Gho, Y. S.; Giebel, B.; Gilbert, C.; Gimona, M.; Giusti, I.; Goberdhan, D. C.I.; Görgens, A.; Gorski, S. M.; Greening, D. W.; Gross, J. C.; Gualerzi, A.; Gupta, G. N.;Gustafson, D.; Handberg, A.; Haraszti, R. A.; Harrison, P.; Hegyesi, H.; Hendrix, A.; Hill, A. F.;Hochberg, F. H.; Hoffmann, K. F.; Holder, B.; Holthofer, H.; Hosseinkhani, B.; Hu, G.; Huang,Y.; Huber, V.; Hunt, S.; Ibrahim, A. G.-E.; Ikezu, T.; Inal, J. M.; Isin, M.; Ivanova, A.; Jackson, H.K.; Jacobsen, S.; Jay, S. M.; Jayachandran, M.; Jenster, G.; Jiang, L.; Johnson, S. M.; Jones,J. C.; Jong, A.; Jovanovic-Talisman, T.; Jung, S.; Kalluri, R.; Kano, S.-i.; Kaur, S.; Kawamura,Y.; Keller, E. T.; Khamari, D.; Khomyakova, E.; Khvorova, A.; Kierulf, P.; Kim, K. P.; Kislinger,T.; Klingeborn, M.; Klinke, D. J.; Kornek, M.; Kosanović, M. M.; Kovács, Á. F.; Krämer-Albers,E.-M.; Krasemann, S.; Krause, M.; Kurochkin, I. V.; Kusuma, G. D.; Kuypers, S.; Laitinen, S.;Langevin, S. M.; Languino, L. R.; Lannigan, J.; Lässer, C.; Laurent, L. C.; Lavieu, G.; LázaroIbáñez, E.; Le Lay, S.; Lee, M.-S.; Lee, Y. X. F.; Lemos, D. S.; Lenassi, M.; Leszczynska, A.; Li,I. T. S.; Liao, K.; Libregts, S. F.; Ligeti, E.; Lim, R.; Lim, S. K.; Linē, A.; Linnemannstöns, K.;Llorente, A.; Lombard, C. A.; Lorenowicz, M. J.; Lörincz, Á. M.; Lötvall, J.; Lovett, J.; Lowry,M. C.; Loyer, X.; Lu, Q.; Lukomska, B.; Lunavat, T. R.; Maas, S. L. N.; Malhi, H.; Marcilla, A.;Mariani, J.; Mariscal, J.; Martens-Uzunova, E. S.; Martin-Jaular, L.; Martinez, M. C.; Martins,V. R.; Mathieu, M.; Mathivanan, S.; Maugeri, M.; McGinnis, L. K.; McVey, M. J.; Meckes, D.G.; Meehan, K. L.; Mertens, I.; Minciacchi, V. R.; Möller, A.; Møller Jørgensen, M.; MoralesKastresana, A.; Morhayim, J.; Mullier, F.; Muraca, M.; Musante, L.; Mussack, V.; Muth, D.C.; Myburgh, K. H.; Najrana, T.; Nawaz, M.; Nazarenko, I.; Nejsum, P.; Neri, C.; Neri, T.;Nieuwland, R.; Nimrichter, L.; Nolan, J. P.; Nolte-’t Hoen, E. N. M.; Hooten, N. N.; O’Driscoll,L.; O’Grady, T.; O’Loghlen, A.; Ochiya, T.; Olivier, M.; Ortiz, A.; Ortiz, L. A.; Osteikoetxea,X.; Ostegaard, O.; Ostrowski, M.; Park, J.; Pegtel, D. M.; Peinado, H.; Perut, F.; Pfaffl, M.W.; Phinney, D. G.; Pieters, B. C. H.; Pink, R. C.; Pisetsky, D. S.; Pogge von Strandmann,E.; Polakovicova, I.; Poon, I. K. H.; Powell, B. H.; Prada, I.; Pulliam, L.; Quesenberry, P.;Radeghieri, A.; Raffai, R. L.; Raimondo, S.; Rak, J.; Ramirez, M. I.; Raposo, G.; Rayyan, M. S.;Regev-Rudzki, N.; Ricklefs, F. L.; Robbins, P. D.; Roberts, D. D.; Rodrigues, S. C.; Rohde, E.;Rome, S.; Rouschop, K. M. A.; Rughetti, A.; Russell, A. E.; Saá, P.; Sahoo, S.; Salas-Huenuleo,E.; Sánchez, C.; Saugstad, J. A.; Saul, M. J.; Schiffelers, R. M.; Schneider, R.; Schøyen, T.Every Event Matters 10
H.; Scott, A.; Shahaj, E.; Sharma, S.; Shatnyeva, O.; Shekari, F.; Shelke, G. V.; Shetty, A. K.;Shiba, K.; Siljander, P. R. M.; Silva, A. M.; Skowronek, A.; Snyder, O. L.; Soares, R. P.; Sódar,B. W.; Soekmadji, C.; Sotillo, J.; Stahl, P. D.; Stoorvogel, W.; Stott, S. L.; Strasser, E. F.; Swift,S.; Tahara, H.; Tewari, M.; Timms, K.; Tiwari, S.; Tixeira, R.; Tkach, M.; Toh, W. S.; Tomasini,R.; Torrecilhas, A. C.; Tosar, J. P.; Toxavidis, V.; Urbanelli, L.; Vader, P.; van Balkom, B. W. M.;van der Grein, S. G.; Van Deun, J.; van Herwijnen, M. J. C.; Van Keuren-Jensen, K.; van Niel,G.; van Royen, M. E.; van Wijnen, A. J.; Vasconcelos, M. H.; Vechetti, I. J.; Veit, T. D.; Vella,L. J.; Velot, É.; Verweij, F. J.; Vestad, B.; Viñas, J. L.; Visnovitz, T.; Vukman, K. V.; Wahlgren,J.; Watson, D. C.; Wauben, M. H. M.; Weaver, A.; Webber, J. P.; Weber, V.; Wehman, A.M.; Weiss, D. J.; Welsh, J. A.; Wendt, S.; Wheelock, A. M.; Wiener, Z.; Witte, L.; Wolfram,J.; Xagorari, A.; Xander, P.; Xu, J.; Yan, X.; Yáñez-Mó, M.; Yin, H.; Yuana, Y.; Zappulli, V.;Zarubova, J.; Žėkas, V.; Zhang, J.-y.; Zhao, Z.; Zheng, L.; Zheutlin, A. R.; Zickler, A. M.;Zimmermann, P.; Zivkovic, A. M.; Zocco, D.; Zuba-Surma, E. K., Minimal information forstudies of extracellular vesicles 2018 (MISEV2018): a position statement of the InternationalSociety for Extracellular Vesicles and update of the MISEV2014 guidelines. Journal ofExtracellular Vesicles 2019, 8 (1), 1535750.3. Van Deun, J.; Mestdagh, P.; Agostinis, P.; Akay, Ö.; Anand, S.; Anckaert, J.; Martinez, Z. A.;Baetens, T.; Beghein, E.; Bertier, L., EV-TRACK: transparent reporting and centralizingknowledge in extracellular vesicle research. Nature Methods 2017, 14 (3), 228-232.4. L inares, R.; Tan, S.; Gounou, C.; Arraud, N.; Brisson, A. R., High-speed centrifugationinduces aggregation of extracellular vesicles. Journal of Extracellular Vesicles 2015, 4.5. Nolan, J. P., Flow Cytometry of Extracellular Vesicles: Potential, Pitfalls, and Prospects.Current Protocols in Cytometry 2015, 73 (1), 13.14.1-13.14.16.6. Brittain, G. C.; Chen, Y. Q.; Martinez, E.; Tang, V. A.; Renner, T. M.; Langlois, M.-A.; Gulnik, S.,A Novel Semiconductor-Based Flow Cytometer with Enhanced Light-Scatter Sensitivityfor the Analysis of Biological Nanoparticles. Scientific Reports 2019, 9 (1), 16039.7. W elsh, J. A.; Van Der Pol, E.; Arkesteijn, G. J. A.; Bremer, M.; Brisson, A.; Coumans, F.;Dignat-George, F.; Duggan, E.; Ghiran, I.; Giebel, B.; Gorgens, A.; Hendrix, A.; Lacroix, R.;Lannigan, J.; Libregts, S.; Lozano-Andres, E.; Morales-Kastresana, A.; Robert, S.; De Rond,L.; Tertel, T.; Tigges, J.; D
In this article we will demonstrate use of Cellarcus' Vesicle Flow Cytometry (vFC ) assay to: 1. Calibrate the instrument and determine performance across key metrics 2. Sensitively detect EVs using the fluorogenic membrane probe vFRed and perform standardized measurement of EV concentration and size distribution 3.