Transcription
J Risk Uncertainty (2006) 33:55–72DOI 10.1007/s11166-006-0171-zThe catastrophic effects of natural disasterson insurance marketsPatricia Born · W. Kip Viscusi CSpringer Science Business Media, LLC 2006Abstract Natural disasters often have catastrophic risks on insurance companies as wellas on the insured. Using a very large dataset on homeowners’ insurance coverage by state,by firm, and by year for the 1984 to 2004 period, this paper documents the positive effecton losses and loss ratios of both unexpected catastrophes as well as large events that theauthors term “blockbuster catastrophes.” Insurers adapt to these catastrophic risks by raisinginsurance rates, leading to lower loss ratios after the catastrophic event. There is a widespreadevent of unexpected catastrophes and blockbuster catastrophes that reduces total premiumsearned in the state, reduces the total number writing insurance coverage in the state, and leadsto the exit of firms from the state. Firms with low levels of homeowners’ premiums are mostadversely affected by the catastrophes.Keywords Catastrophic risks . Homeowners’ insurance . Natural disastersJEL Classification D8 . G22 . K13In conventional insurance markets, such as for automobile insurance, the insurer faces a largenumber of independent risks that tend to follow a fairly predictable pattern across time. Bycharging premiums that the firm can invest and earn a return on before paying off the losses,the firm will be able to run a profitable insurance business.Catastrophic losses caused by natural disasters are much more problematic from an insurance standpoint. Rather than a large number of risks that on average follow a quite predictableyear-to-year pattern, catastrophic losses tend to be lumpy. In fact, the situation parallels thatP. BornDepartment of Finance, Real Estate & Insurance, College of Business and Economics, California StateUniversity – Northridge, 18111 Nordhoff Street, Northridge, CA 91330-8379e-mail: patricia.born@csun.eduW. K. Viscusi ( )University Distinguished Professor of Law, Economics, and Management, Vanderbilt University,131 21st Ave. South, Nashville, TN 37203e-mail: kip.viscusi@vanderbilt.eduSpringer
56J Risk Uncertainty (2006) 33:55–72in an automobile insurance case in which there is not a large number of independent trialsbut rather a single draw for highly correlated risks so that either every auto or no autos areinvolved in an accident that year.Catastrophic risks consequently pose a variety of problems for insurers. First, because thelosses arise from a small number of lumpy events, the insurer may not have sufficient resourcesto cover the losses. Less dramatically, the firm may suffer losses well in excess of the valueof the premiums that it charged for the coverage. In the absence of adequate reinsurance, thefirm may go bankrupt or may choose to exit a state in which there is a substantial exposureto such catastrophic risks. In response to losses incurred following Hurricane Katrina, whichaccounted for over 38 billion in insured losses last year, one major insurer, Allstate, hasexited several coastal states while another, State Farm, has chosen not to renew some policiesin these areas.1 The fourth-largest personal insurer in Florida, Poe Financial, went bankrupt.2The second ramification of catastrophic losses is that they will influence the rate structureeven for firms that remain quite viable in the presence of natural disasters. Suppose that aninsurer is writing coverage in a very high-risk state that experiences a major disaster onceevery decade. In that disaster year, the firm will suffer losses well in excess of premiums. Forit to be profitable for the insurer to write coverage in the state, it will consequently have tocharge more for insurance in the other years in which there are no catastrophes than it wouldif there were not the threat of catastrophic risks. Thus, one would expect to observe very highloss ratios in the catastrophic risk states in years in which a catastrophe has occurred andexpect especially low loss ratios in the non-catastrophe years as compared to the loss ratiosin states not subject to such catastrophic risks.A third phenomenon linked to natural disasters is that of learning about the risks overtime. The distribution of losses due to catastrophes may change over time for a variety ofreasons. Locational patterns may have shifted over time, as reflected in increased constructionin high-risk beachfront locales. There also may be shifts in weather patterns, as evidenced inthe recent speculation that catastrophic losses from Hurricane Katrina are likely to increasein the presence of global warming. The hurricane season in the period 1995–2005 averaged15 named storms per year, up from an average of 8.5 named storms from 1971–1994.3 To theextent that insurers are rational Bayesian decision makers, one would expect them to updatetheir risk beliefs over time when writing insurance coverage.Somewhat surprisingly, there is no econometric analysis whatsoever that addresses theseand other fundamental aspects of how catastrophic risks affect insurance markets. Therehave, of course, been extensive discussions of a conceptual nature as well as analyses of thepotential role of reinsurance, but there has been no empirical examination of how catastrophicrisks affect insurance company behavior.4This paper will provide a detailed empirical examination of how catastrophic risks affectthe performance of the market for homeowners’ insurance. The dataset that we use is unprecedented in the homeowners’ insurance literature in terms of its level of detail. In particular, we1 “ThePrice of Sunshine,” The Economist, June 8, 2006, p. 76.2 Ibid.More specifically, the article concluded: “In April Poe Financial, Florida’s fourth-largest personalinsurer, collapsed, leaving 316,000 policyholders in need of coverage.”3 NationalOceanic and Atmospheric Administration (2006).4 Examples of previous treatments of the insurance of catastrophic risks include special issues of the Journal ofRisk and Insurance (December 1996) and the Geneva Papers on Risk and Insurance (April 1997). Representative articles are those by Grace, Klein and Kleindorfer (2004), Angbazo and Narayanan (1996), Gollier (1997),Kleffner and Doherty (1996), and Zeckhauser (1995). More generally see Viscusi (1993), which focused onliability insurance ratemaking in response to the surge in tort liability.Springer
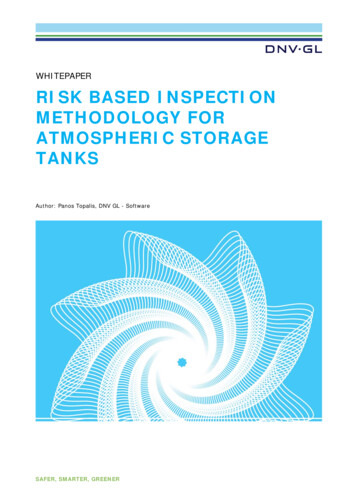
J Risk Uncertainty (2006) 33:55–7257use information on losses and premiums by firm and by state over a 21-year period from 1984to 2004. This quite-comprehensive dataset enables us to analyze the effect of catastrophicevents of differing magnitude and to explore the effects over time in how these catastrophicevents affected insurance company behavior in subsequent years.Section 1 provides some background information regarding catastrophic events arising from natural disasters. That there might be hurricanes in Florida and tornadoes in theMidwest should not take insurance companies entirely by surprise. Thus, we calculate theaverage number of catastrophic events by state, where the number of such events is typically not great, but they are not extremely rare events either. That section also exploreswhat we term “blockbuster” catastrophes, which are the twenty most costly natural catastrophes that occurred from 1984 to 2004. These blockbuster events may have particularly direconsequences for insurance companies to the extent that these very large losses were notanticipated.After reviewing the data sources and the variables used in our analysis in Section 2, inSection 3 we estimate the effect of catastrophic risks on loss ratios, the losses incurred by theinsurer, and the premiums earned by the insurer. This analysis will indicate that insurers doin fact suffer catastrophic losses in response to catastrophic events, but that they also respondby altering their premium structure in the non-catastrophe years.In Section 4 of the article, we examine the effects of these catastrophic risks on the sizeof the market in any given state. Do natural disasters lead firms to exit the market, and whatis their effect on the total number of firms writing insurance coverage in the state? Are somefirms particularly vulnerable to the risks of catastrophes, and what are the characteristics ofthese firms that are most at risk? Section 5 concludes the paper.1 Catastrophic eventsThe focus of our empirical analysis is on a series of measures of catastrophic events. Weanalyze the period from 1984 to 2004, which is the 21-year span covered by our dataset onhomeowners’ insurance that will be the reference point for our empirical analysis. The catastrophic events were compiled from Swiss Re Sigma Reports dating from 1985 to 2005. TheseSwiss Re figures were in turn based on data from the Property Claims Service (PCS), whichis a division of the Insurance Services Office (ISO). The PCS currently defines catastrophesas “events that cause 25 million or more in direct insured losses to property that affect asignificant number of policy holders and insurers.”We restrict the definition of catastrophes to natural catastrophes; that is, events whichare caused by natural forces. Thus, for example, the consequences of terrorism attacks arenot included. Because our concern is with homeowners’ exposure, we exclude those naturalcatastrophes which are more likely to have an impact on commercial lines. Specifically, weaccount for floods, storms, fires, and earthquakes, but we do not include drought and coldwaves. We also do not include man-made disasters, such as aviation accidents and explosions,because most of these disasters involve commercial exposures or affect only a very limitedspace. These events also likely involve only a small number of insurance policies as well.Our accounting for catastrophic events consequently relies on the selection criteria usedby Swiss Re. The threshold for losses included in the Sigma Reports is adjusted annually toaccount for inflation in the United States so that our annual tally of catastrophic events overthe two-decade period is in comparable inflation-adjusted terms.Figure 1 summarizes the number of catastrophic events by year for the 1984 to 2004 period.Although catastrophes are not as frequent as, for example, automobile accidents, they areSpringer
58J Risk Uncertainty (2006) 33:55–72250200150Numberof Events1005001984 1985 1986 1987 1988 1989 1990 1991 1992 1993 1994 1995 1996 1997 1998 1999 2000 2001 2002 2003 2004YearFig. 1 State-level catastrophic events, 1984–2004not extremely rare events. In 1996, there were over 200 state-level catastrophic events thatmet the damages threshold.5 Moreover, in just over half of the years shown in the figure,there were more than 100 catastrophic events throughout the country. Note that there wasalso an upward trend in the number of catastrophic events over time. This trend suggests thateither there is increased vulnerability to catastrophic events, or that the underlying climaticconditions generating these events now pose a greater risk than they did two decades ago.The frequency of these catastrophic events varies considerably across different states.Table 1 summarizes the average number of catastrophic events per year for each of thesestates. The 21-year period for the analysis provides a reliable long-term perspective on thefrequency of these risks and is much more informative than, for example, focusing on theresults of a single year. Even comparatively safe states, such as Alaska and Hawaii, experience0.14 catastrophic events per year. Put somewhat differently, these states experienced threecatastrophic events over the 21-year period shown in the table.At the high end of the spectrum is the state of Texas, which averages 7.43 catastrophicevents annually. This figure translates into a total of 156 natural disasters over the 21-yearperiod, as Texas is very vulnerable to tropical storms as well as tornadoes.Insurance companies should have a general sense of the average frequency of catastrophicevents by state, such as these statistics in Table 1. Thus, the main concern for insurers aswell as for subsequent empirical analysis will be the extent to which there is a departurein the experience of a particular state from this longer-term average. If, for example, Texascontinued to have seven or eight catastrophic events every year and there was no variation inthis amount, then insurance pricing would be much more stable than if there was a pronouncedupward trend in the number of catastrophic events.5 Since we focus on insurers’ state-level performance, we account for catastrophes at the state level. Thus, ahurricane affecting three states is counted as three catastrophic events, once in each of the three states affected.Springer
J Risk Uncertainty (2006) 33:55–7259Table 1 Average annual catastrophic events by state, : Swiss Re Sigma Reports, 1985–2005.The twenty most devastating of these natural catastrophes are those that we term blockbuster catastrophes. Table 2 lists the twenty most costly natural catastrophes over the1984–2004 period. Although the losses associated with Hurricane Katrina dwarf those for thecatastrophic events shown in Table 2, these disasters also were quite costly. The most costlyof the catastrophes was Hurricane Andrew in 1992, which led to an insured loss of 21.5billion. The 1994 Northridge earthquake was not far behind, with a loss of 17.8 billion.Every one of the twenty blockbuster catastrophes shown in Table 2 created a loss of 1.7billion or more. While these losses were often spread across several states, it is noteworthythat some states have a prominent role in many of these events. Florida, for example, isrepresented in eleven of the twenty blockbuster catastrophes.Our empirical conjecture is that the incidence of these blockbuster catastrophes will notbe fully anticipated by the insurers. As a consequence, we expect there to be a major effect ofblockbuster events on insurance pricing as well as exit of insurance companies from the state.Blockbuster events by their very nature should be unexpected in terms of their severity. Thereconsequently should be a twofold effect resulting from both a one-time major financial shockas well as a longer-term effect as insurance companies revise their risk assessments for thecoverage that they are writing in these states that are susceptible to blockbuster catastrophes.2 Data sourcesThe core database that we use for our empirical analysis consists of the state-level homeowners’ insurance operations for all U.S. insurers from 1984 to 2004. We obtained the directpremiums earned and losses incurred statistics from the State Pages of insurers’ annual filings with the National Association of Insurance Commissioners for all insurers with positivepremiums in the homeowners’ line. This dataset is also the source of our information ontotal premiums earned in a state, organizational form, and the number of states in which theinsurer writes homeowners’ coverage.Springer
SpringerHurricane InikiHurricane FranSpring Storms/TornadoesHurricane IsabelSeries of Tornadoes in MidwestSep. 1992Sep. 1996Apr. 2002Sep. 2003May 1999Source: Swiss Re.Hurricane AndrewNorthridge EarthquakeHurricane IvanHurricane CharleyHurricane HugoHurricane FrancesHurricane GeorgesHurricane JeanneTropical Storm AllisonHailstorms/Tornadoes/ FloodsHurricane FloydHurricane OpalOakland, CA FiresHail/Floods/TornadoesWinter StormPerilAug. 1992Jan. 1994Sep. 2004Aug. 2004Sep. 1989Aug. 2004Sep. 1998Sep. 2004May 2001May 2003Sep. 1999Oct. 1995Oct. 1991Apr. 2001Mar. 3.43.32.72.62.42.32.3Insured loss( Billions 2004 dollars)FL, LACAAL, DE, FL, GA, LA, MD, MS, NC, NJ, NY, OH, PA, TN, VA, WVFL, NC, SCNC, SCFL, GA, NC, NY, SCAL, FL, MS, LADE, FL, GA, MD, NC, NJ, NY, PA, SC, VAFL, LA, GA, MS, NC, NJ, PA, SC, TXAL, AR, CO, GA, IA, IL, IN, KS, KY, MO, MS, NC, NE, OK, SC, SD, TNCT, FL, DE, GA, MA, MD, ME, NC, NH, NJ, NY, PA, RI, SC, VT, VAAL, FL, GA, MS, NC, SC, TNCAAR, KS, MO, MS, OK, TXAL, CT, DE, FL, GA, KY, LA, MA, MD, ME, MS, NC, NH,NJ, NY, OH, PA, RI, SC, TN, TX, VA, VT, WVHIMD, NC, OH, PA, SC, VA, WVGA, IL, IN, KS, KY, MD, MO, NY, OH, PA, TN, VA, WVDE, MD, NC, NJ, NY, PA, VA, WVAL, AR, FL, GA, IL, IN, KS, KY, LA, MO, MS, NC, NE, OH, OK, SC, TN, TXStates affectedTable 2 Blockbuster catastrophes: The twenty most costly natural catastrophes for U.S. property insurers, 1984–200460J Risk Uncertainty (2006) 33:55–72
J Risk Uncertainty (2006) 33:55–7261The number of firm-state units in the dataset declines steadily through the time periodanalyzed. Whereas there were 9,644 observations in 1984, by 2004 there were only 6,596firm-state units in the dataset. The number of unique firms in the sample ranges from a high of1,103 in 1990 to a low of 961 in 2004. These figures suggest that firms offering homeowners’coverage have consolidated their operations, electing to provide coverage in fewer and fewerstates over time, but not exiting the U.S. market.Our analysis links an insurer’s state-level homeowners’ experience to catastrophic eventsin the state. The compilation of catastrophic events at the state level revealed that some statesare affected by catastrophes on a regular basis. Anticipated catastrophic events would bereflected in premiums if insurers are rational. Likewise, insurer underwriting performanceshould not be adversely affected by catastrophic events that are anticipated, but would beadversely affected by a greater-than-anticipated number of events, and enhanced by a lowerthan-anticipated number of events. To capture this relationship, we create a variable byyear and by state called Unexpected Catastrophes. This variable is defined as the differencebetween the number of actual catastrophic events in a given year and the average number ofcatastrophic events in that state over the 1984–2004 period.The second set of catastrophic variables used are what we call Blockbuster Catastrophes.This variable is the number of blockbuster catastrophe events from Table 2 that occurred in thatstate in that particular year. While all catastrophic events were counted equally in the creationof the Unexpected Catastrophes variable, we expect that these blockbuster catastrophes mayhave a differential effect. Because these events have a more profound effect on insurers’performance, this variable equals the number of blockbuster catastrophic events in the statein which the insurer operates for a given year.The next set of variables pertains to organizational form. We have separate variables todistinguish whether the firm had a Mutual insurance structure, a Lloyd’s insurance structure,or was a Reciprocal firm. The omitted category is that of stock firms.6We also included four variables that reflect the overall size of the insurance companies’operations. The three national measures are the Number of States in which the insurer operates,the Total Homeowners’ Premiums written by the insurance company throughout the country,and the Total National Premiums written by the insurance company in all lines of insurance.We also include Total Premiums in State as a measure of the scale of the firm’s operationswithin the state. One would expect smaller firms to be more susceptible to shocks than largerfirms. Moreover, one would expect firms with a substantial presence in the state to be morereluctant to leave the state after a catastrophic event because of the losses associated withother lines.The final variable we include is a 0–1 variable for Restrictive Rate Regulation. In thesestates, the firm must obtain prior approval before changing its homeowners’ insurance rates.We expect that a more restrictive state regulatory regime would hinder an insurer’s ability torecover financially following a catastrophic event.7A major concern in the literature on insurance is how premiums are adjusted over time inresponse to fluctuations in interest rates. This phenomenon, which is known in the literatureas the underwriting cycle, is often captured in empirical analyses of insurance markets byincluding some type of interest rate variable. Our subsequent regression analysis will be moregeneral, in that we include time-specific indicator variables for each year in the sample, thus6 For a review of the effect of organizational form on insurer performance see Born, Gentry, Viscusi, andZeckhauser (1998).7 Fora discussion of the effects of rate regulation on property and casualty insurers, see Born (2001).Springer
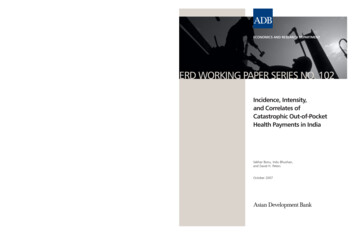
62J Risk Uncertainty (2006) 33:55–721.210.8Loss0.6Ratio0.40.201984 1985 1986 1987 1988 1989 1990 1991 1992 1993 1994 1995 1996 1997 1998 1999 2000 2001 2002 2003 2004YearAll InsurersFloridaCaliforniaTexasFig. 2 Average “Firm-State” loss ratios in homeowners’ insurance, 1984–2004sweeping out all time-dependent influences such as interest rate fluctuations and temporaltrends in the number of firms writing homeowners insurance, as well as any other temporaleffects.3 Insurance market consequences of catastrophes: Loss ratios, premiums,and lossesTo explore the effects of catastrophic risks, we present a series of regression analyses of theeffect of these various variables on loss ratios, premiums, and losses. The loss ratio is the firstmeasure that we consider, which is the ratio of losses incurred divided by premiums earned.The inverse of the loss ratio is the most widely accepted measure of insurance companyprofitability.Figure 2 presents the loss ratio pattern for all homeowners’ insurers over the 1984–2004period as well as the pattern for states that are particularly vulnerable to catastrophic risks:Florida, California, and Texas. As one might expect, in these high-risk states, there are oftenspikes in loss ratios that greatly exceed the loss ratios in the homeowners’ lines more generally.However, in the years in which there are no big spikes, it is also noteworthy that in thesehigh-risk states, the loss ratios are very low. Indeed, for the states of Florida, California,and Texas, in most years of the last decade, shown in Figure 2, the loss ratios in thesestates are substantially below the average loss ratios for homeowners’ insurance generally.Our hypothesis is that insurers that experience these catastrophic losses and blockbusterevents will adjust their pricing practices so that the insurance they write in the years inwhich catastrophic events do not occur will be more profitable than insurance written instates not subject to a large number of catastrophes. This additional profitability is neededto compensate for the increased losses that these firms experience during the years in whichmajor catastrophes occur.Table 3 presents the regression of the natural logarithm of loss ratio on the series ofexplanatory variables. Specifically, we estimate:Springer
J Risk Uncertainty (2006) 33:55–7263LossRatioist α1 β1 UnexpCatist β2 UnexpCatis,t 1 β3 UnexpCatis,t 2 β4 Blockbusterist β5 Blockbusteris,t 1 β6 Blockbusteris,t 2 β7 Mutuali β8 Lloyd’si β9 Reciprocali β10 LnNumstsit β11 LnHOPremsit β12 LnStatePremsist β13 LnNatPremsit β14 RateRegist 20 Yi ε1t .(1)j 1for firm i in state s at time t, and where Y j is a dummy variable for each year j 1985–2004.The main hypotheses are that unexpected catastrophes and blockbuster catastrophes shouldTable 3 Insurer loss ratio regressionsaExplanatory variableInterceptUnexpected Catastrophes tUnexpected Catastrophes t 1Unexpected Catastrophes t 2Blockbuster CatastrophestBlockbuster Catastrophes t 1Blockbuster Catastrophes t 2MutualLloyd’sReciprocalLn(No. of states in which insurer operates)Ln(Homeowners Premiums)Ln(Total Premiums in State)Ln(Total National Premiums)Restrictive Rate RegulationAdjusted R 2Coefficient(Std. error) 0.910 (0.043)0.060 (0.002)0.019 (0.002) 0.002(0.002)0.120 (0.008)0.004(0.011) 0.085 (0.012)0.019 (0.008) 0.038(0.043)0.115 (0.019) 0.075 (0.005) 0.015 (0.002)0.051 (0.003) 0.005 (0.003)0.034 (0.007)0.031Regression includes 20 year dummies, which are not shown.a Dependent variable Ln(Loss Ratio). , , and denote significance at the 90%, 95% and 99% level, two-tailed test.Springer
64J Risk Uncertainty (2006) 33:55–72substantially boost the loss ratios that firms experience in the catastrophe years and lowerloss ratios in the non-catastrophe years.This basic set of predictions is in fact borne out in the results in Table 3. There is theexpected positive effect of the current value of the catastrophe variable as well as the valuelagged one year. Notably, two years after the unexpected catastrophe, there is a negativeeffect that is roughly the same size as the estimated standard error. Thus, the UnexpectedCatastrophe variable lagged two years is consistent with our pricing hypothesis, but there isno statistically significant evidence of such an effect.The subsequent loss ratio offset is more pronounced for blockbuster catastrophes. Theeffect of blockbuster catastrophes is to boost the loss ratio during the year of the blockbustercatastrophe, but there is an opposite and almost offsetting effect two years later. This result isconsistent with our hypothesis that after a blockbuster event, firms will raise their insurancepremiums in order to provide sufficient coverage in case of future blockbuster catastrophes.These premium adjustments lead to lower future loss ratios during the years in which ablockbuster catastrophe does not strike. The evidence for such adjustments is much strongerfor blockbuster catastrophes than for catastrophes more generally.Table 4 presents the regression of the log of premiums earned against our set of explanatoryvariables. Specifically,LnHOPremsist α1 β1 LnHOPremsis,t 1 β2 UnexpCatist β3 UnexpCatis,t 1 β4 UnexpCatis,t 2 β5 Blockbusterist β6 Blockbusteris,t 1 β7 Blockbusteris,t 2 β8 Mutuali β9 Lloyd’si β10 Reciprocali β11 LnNumstsit β12 RateRegst β13 LnStatePremsist β14 LnNatPremsit 20 δ j Y j εist .(2)j 1Premiums reflect both the price of insurance as well as the quantity of insurance, so inmany respects are a less instructive measure than the loss ratio, which serves as an ex-postmeasure of insurer profitability. We include a measure of the one-period-lagged homeowners’premiums in the analysis as well to capture the fact that there is a strong autoregressivecharacter to insurance underwriting, as firms that write a large number of premiums in thestate in a given year will tend to continue to do so in subsequent years. Indeed, the elasticityof premiums earned to homeowners’ premiums earned in the previous year is 0.973.Catastrophic events have a mixed effect on insurance premiums. One would expect theseunexpected catastrophes or blockbuster events to raise the rate that firms charge for insurance.Thus, for any given number of policies written, the total premiums will rise. However, thesemajor catastrophes also may reduce the quantity of insurance written, both because of thehigher rates and insurance rationing, as well as exiting of firms from the state.The regression results in Table 4 indicate that the negative quantity effect is dominant.Unexpected catastrophes have a negative effect on premiums earned, both in the year of thecatastrophe as well as in the subsequent year. Similarly, the blockbuster catastrophes areinfluential as well with a significant negative effect both in the current year as well as twoyears after the catastrophic event.The most easily predictable results are those pertaining to losses incurred. These majorcatastrophes should clearly boost the losses incurred by the insurance company, controllingSpringer
J Risk Uncertainty (2006) 33:55–7265Table 4 Regression results for insurer premiumsaCoefficient(Std. error)Explanatory variableInterceptLn(Homeowners Premiums) t 1Unexpected Catastrophes tUnexpected Catastrophes t 1Unexpected Catastrophes t 2Blockbuster CatastrophestBlockbuster Catastrophes t 1Blockbuster Catastrophes t 2MutualLloyd’sReciprocalLn(No. of states in which insurer operates)Restrictive Rate RegulationLn(Total Premiums in State)Ln(Total National Premiums)Adjusted R 2 0.976 (0.035)0.973 (0.001) 0.027 (0.002) 0.022 (0.002) 0.023 (0.002) 0.033 (0.007)0.013(0.009) 0.029 (0.010)0.156 (0.007)0.241 (0.037)0.225 (0.017)0.088 (0.004) 0.015 (0.006)0.109 (0.002) 0.041 (0.003)0.896Regression includes 20 year dummies, which are not shown.a Dependent variable Ln(Premiums Earned). , , and denote significance at the 90%, 95% and 99% level, two-tailed test.for the scale of the company’s operations, which we do by including the lagged value of thehomeowners’ premiums written by the company in that state. We estimate:LnHOLossesist α1 β1 LnHOPremsis,t 1 β2 UnexpCatist β3 UnexpCatis,t 1 β4 UnexpCatis,t 2 β5 Blockbusterist β6 Blockbusteris,t 1 β7 Blockbusteris,t 2 β8 Mutuali β9 Lloyd’si β10 Reciprocali β11 LnNumstsit β12 RateRegist β13 LnStatePremsist β14 LnNatPremsit 20 δ j Yi εist .(3)j 1Springer
66J Risk Uncertainty (2006) 33:55–72Table 5 Regression results: Effect of unexpected catastrophic events on insurer lossesaExplanatory variableInterceptLn(Homeowners Premiums) t 1Unexpected Catastrophes tUnexpected Catastrophes t 1Unexpected Catastrophes t 2Blockbuster CatastrophestBlockbuster Catastrophes t 1Blockbuster Catastrophes t 2MutualLloyd’sReciprocalLn(No. of states in which insurer operates)Restrictive Rate RegulationLn(Total Premiums in State)Ln(Total National Premiums)Adjusted R 2Coefficient(Std. error) 0.910 (0.043)0.98
J Risk Uncertainty (2006) 33:55-72 DOI 10.1007/s11166-006-0171-z The catastrophic effects of natural disasters on insurance markets Patricia Born · W. Kip Viscusi Springer ScienceC Business Media, LLC 2006 Abstract Natural disasters often have catastrophic risks on insurance companies as well as on the insured.