Transcription
Chi et al. BMC Cardiovascular Disorders(2019) ARCH ARTICLEOpen AccessIdentification of hypertriglyceridemia basedon bone density, body fat mass, andanthropometry in a Korean populationJeong Hee Chi1, Moon Sun Shin2 and Bum Ju Lee3*AbstractBackground: Hypertriglyceridemia is strongly associated with the risks of cardiovascular disease, coronary heartdisease, and metabolic syndrome. The relationship between hypertriglyceridemia or high triglyceride levels andbone mineral density remains controversial. Furthermore, to date, no study has simultaneously examined theassociation among hypertriglyceridemia, bone area, bone mineral content, bone mineral density, body fat mass,and anthropometrics. The present study aimed to evaluate the association among hypertriglyceridemia,anthropometrics and various bone density and body fat composition variables to identify the best indicator ofhypertriglyceridemia in a Korean population.Methods: The data were obtained from the fifth Korea National Health and Nutrition Examination Survey. In total,3918 subjects aged 20–80 years participated in this study. In the variable analysis of the waist circumference (WC),trunk fat mass (Trk-Ft), body mass index, etc., a binary logistic regression analysis was performed to examine thesignificance of the differences between the normal group and hypertriglyceridemia groups.Results: In both men and women, the WC showed the strongest association with hypertriglyceridemia in thecrude analysis (odds ratio (OR) 1.738 [confidence interval 1.529–1.976] and OR 2.075 [1.797–2.397]), butthe Trk-Ft was the most strongly associated with the disease after adjusting for age and body mass index(adjusted OR 1.565 [1.262–1.941] and adjusted OR 1.730 [1.291–2.319]). In particular, the Pelvis area (Plv-A)was the most significant among the bone variables in women (adjusted OR 0.641 [0.515–0.796]). In the predictivepower analysis, the best indicator of hypertriglyceridemia was WC in women (the area under the receiver operatingcharacteristic curve (AUC) 0.718 [0.685–0.751]) and Trk-Ft in men (AUC 0.672 [0.643–0.702]). The WC was also themost predictive among the anthropometric variables in men (AUC 0.670 [0.641–0.700]). The strength of theassociation and predictive power was stronger in women than in men.Conclusions: The WC in women and Trk-Ft in men exhibited the best predictive power for hypertriglyceridemia. Ourfindings support the use of basic information for the identification of hypertriglyceridemia or high triglyceride levels ininitial health screening efforts.Keywords: Hypertriglyceridemia, Bone mineral density, Anthropometric characteristics, Triglyceride, Body fat mass,Public health* Correspondence: bjlee@kiom.re.kr3Future Medicine Division, Korea Institute of Oriental Medicine, 1672Yuseongdae-ro, Yuseong-gu, Deajeon 305-811, Republic of KoreaFull list of author information is available at the end of the article The Author(s). 2019 Open Access This article is distributed under the terms of the Creative Commons Attribution 4.0International License (http://creativecommons.org/licenses/by/4.0/), which permits unrestricted use, distribution, andreproduction in any medium, provided you give appropriate credit to the original author(s) and the source, provide a link tothe Creative Commons license, and indicate if changes were made. The Creative Commons Public Domain Dedication o/1.0/) applies to the data made available in this article, unless otherwise stated.
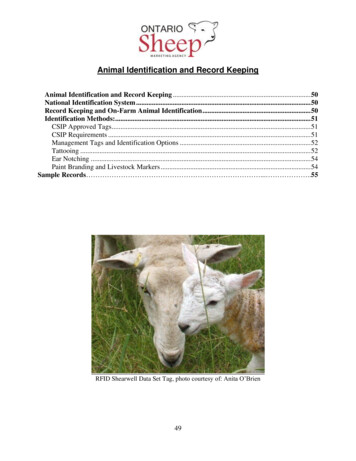
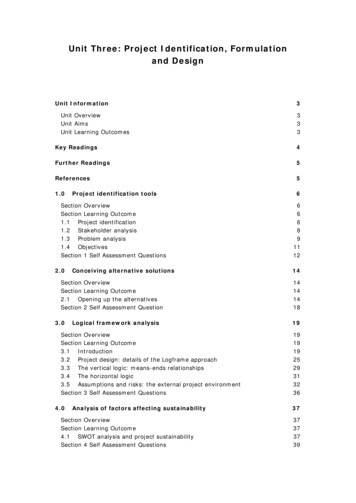
Chi et al. BMC Cardiovascular Disorders(2019) 19:66BackgroundHypertriglyceridemia is a well-known vascular risk factorthat is strongly correlated with the risks of cardiovasculardisease (CVD) [1–4] and coronary heart disease (CHD)[5–7]. High triglyceride (TG) levels are also associatedwith insulin resistance syndrome and metabolic syndrome,as they represent a vascular risk factor [8]. Numerousstudies have reported correlations between TG levels andmetabolic syndrome [9–11], insulin resistance syndrome[12–14], and abdominal obesity [9, 12, 15–17].Hypertriglyceridemia is related to many chronic diseases and is a relatively common disorder; 33.2% of thegeneral population in the 2007 Korean National Survey[18] and 33% of adults in the United States [19] have TGlevels above 150 mg/dL. For decades, numerous studieshave investigated the best indicators of hypertriglyceridemia, and high TG levels, i.e., hypertriglyceridemia,are strongly associated with anthropometric measures,such as waist circumference (WC) [20–22], thewaist-to-hip ratio (WHR) [20], the waist-to-height ratio(WHtR) [23, 24], and the rib-to-forehead circumferenceratio (RFcR) [24].Several recent studies have used dual energy X-ray absorptiometry (DXA) to measure body composition andinvestigate the association between hypertriglyceridemiaand bone mineral density and body fat mass. In particular, the association between body fat distribution and TGlevels differs according to ethnicity and race [13, 25]. Forexample, the relationship between body fat distributionvariables and TG levels differed among black, white andHispanic women [25] and between black and whiteSouth African women [13]. Some studies have also reported an association between TG levels and the amountof body fat in the upper body [12, 15, 26], particularlytrunk fat [4, 27]. Many studies also report a relationshipbetween hypertriglyceridemia or TG levels and bonemineral density (BMD) [16, 28–34]. TG levels are associated with BMD at the trochanter site [32], lumbar spine[33–35], total femoral region [33, 36], and hip region[16]. However, the relationship between hypertriglyceridemia or high TG levels and BMD remains controversial. Some studies have not reported an associationbetween TG levels and BMD at any skeletal sites [37–41].Many studies have attempted to identify the best indicators of hypertriglyceridemia, but these studies werebased only on partial information, such as anthropometrics, BMD, and body fat mass. Most studies investigatingbone density consider only BMD, which is calculated asthe ratio of the bone mineral content (BMC) and bonearea (BA). An accurate indicator must be identifiedusing measurements based on more detailed variables,such as BMC and BA, which affect BMD at all bodysites. The primary hypothesis of this study was that anthropometric measures, body fat mas, and BMD arePage 2 of 12associated with hypertriglyceridemia or TG levels. In thepresent study, our objective is to comparatively evaluateanthropometric measures, bone density and body fatmass indices as discriminators of hypertriglyceridemia inKorean adults to identify the best indicator of hypertriglyceridemia. Our study simultaneously examined theassociation among hypertriglyceridemia, BMD, body fatmass, and anthropometrics. The results of this studymay aid in the identification of hypertriglyceridemia ininitial health screening efforts and the establishment of amodel for more precise identification based on a combination of BMD, anthropometrics, and body fat massdata. To the best of our knowledge, no previous studieshave analyzed the associations between detailed bonedensity and body composition variables measured usingDXA with hypertriglyceridemia in Korean adults.MethodsStudy population and data sourceThe data used in this study were obtained from the fifthKorea National Health and Nutrition Examination Survey (KNHANES V-1) conducted in 2010, which is a prospective, cross-sectional, nationally representative surveystudy conducted by the Korea Centers for Disease Control and Prevention [42]. The KNHANES V-1 was approved by the Korea Ministry of Health and Welfare(2010-02CON-21-C). The Institutional Review Boards ofKonkuk University and the Korea Institute of OrientalMedicine also approved the access and analysis of opensource data from the KNHANES in the present studywith a waiver of documentation of informed consent(IRB No. 7001355–201,802-E-063 and I-1805/003–001).The KNHANES V-1 included 7043 subjects over theage of 10 years who underwent blood, bone densitometryand body fat composition tests. The National Cholesterol Education Program (NCEP) recommends a measurement of the fasting lipid panel in adults over the ageof 20 to evaluate hypertriglyceridemia [43]. We followedthe NCEP recommendation. The sample selection procedure included 5915 subjects aged 20–80 years and excluded 1412 subjects who did not fast for 12 h beforethe health survey. In total, 585 subjects with missingvalues for the WC, bone density and body fat composition variables were excluded, and data from 3918 subjects were ultimately collected. The final data setconsisted of 2285 females (normal: 2080, hypertriglyceridemia: 205) and 1633 males (normal: 1281, hypertriglyceridemia: 352). Figure 1 shows a detailed schematicof the data preprocessing procedure.DefinitionHypertriglyceridemia is defined as abnormal TG levelsin the blood and is associated with other lipid and metabolic derangements [43]. Hypertriglyceridemia is defined
Chi et al. BMC Cardiovascular Disorders(2019) 19:66Page 3 of 12Fig. 1 Sample selection procedure. HTG, Hypertriglyceridemiaas fasting TG levels 200 mg/dL according to therecommendation of the NCEP and previous studies[24, 44, 45]. Therefore, in this study, hypertriglyceridemia was defined as fasting TG levels 200 mg/dL.MeasurementAll anthropometric measurements, such as height,weight, and WC, were recorded using standard methods.Weight was measured with an accuracy of 0.1 kg usingan electronic scale (GL-6000-20; Caskorea, Seoul,Korea), and height was measured to the nearest 0.1 cmusing a portable stadiometer (Seca 225; Seca, Hamburg,Germany). WC was measured at the midline betweenthe lower rib margin and iliac chest to the nearest 0.1cm. The body mass index (BMI) was calculated as theweight (kg)/square of height (m2). Blood samples werecollected from all participants after a 12-h fast. The totalcholesterol (TC), high density lipoprotein cholesterol(HDL-C), low density lipoprotein cholesterol (LDL-C),and triglyceride (TG) levels were analyzed using enzymatic methods (Hitachi Automatic Analyzer 7600, Hitachi,Tokyo, Japan). The bone area, BMC, and BMD of thetotal femur, trochanter, intertrochanter, femoral neck,ward’s triangle, lumbar spine, left arm, right arm, left rib,right rib, thoracic spin, pelvis, left leg, right leg andwhole body excluding the head were measured usingDXA (DISCOVERY QDR-4500 W fan-beam densitometer, Hologic, Inc., Bedford, MA, USA). The body fatcomposition was measured using the same equipmentand methods used to measure the BMD. The body fatmass, lean body mass, weight (mass) and body fat percentage were measured in the head, left arm, right arm,trunk, left leg, and right leg.Statistical analysisThe statistical analyses were performed using SPSS 21for Windows (SPSS Inc., Chicago, IL, USA). A binary logistic regression analysis was performed in the crudeanalyses, and the analyses were adjusted for age andBMI to identify the differences between the normal andhypertriglyceridemia groups after applying standardizedtransformations to the data sets. Independent two-sample t-tests were performed to statistically assess the gender differences in characteristics. Table 1 provides adetailed description of the demographic characteristicsand values of all study variables per group. The areaunder the receiver operating characteristic curve (AUC)is a major criterion for comparisons of the predictiveability of individual measures.ResultsAssociations among hypertriglyceridemia, bone densityand body fat massTables 2 and 3 list the associations between hypertriglyceridemia and the anthropometric, bone density and bodyfat composition measurements in women and men.Among all variables examined in this study, WC displayed the strongest association with hypertriglyceridemia among women in the crude analysis (odds ratio(OR) 2.075 [confidence interval 1.797–2.397]), andthe association remained highly significant afteradjusting for age and BMI (adjusted OR 1.615 [1.202–2.171]). The trunk fat mass (Trk-Ft) was highly associatedwith hypertriglyceridemia in the crude analysis (OR 1.940 [1.691–1.226]) and remained the variable moststrongly associated with hypertriglyceridemia after adjusting for confounders (adjusted OR 1.730 [1.291–2.319]).
Chi et al. BMC Cardiovascular Disorders(2019) 19:66Page 4 of 12Table 1 Demographic characteristics and values of all study variables in the two 2Bone area (cm )169.8 (6.46)HeightWeightWC (cm)†78.00 (9.57)84.45 (8.82)Waist circumferenceBMI (kg/m2)†23.31 (3.39)24.06 (3.08)Body mass indexWd-A1.18 (0.10)1.18 (0.08)Ward’s triangle areaLRb-A†128.4 (19.47)145 (22.23)Left rib areaRRb-A137.4 (24.67)153.3 (26.83)Right rib areaLS-A†53.13 (7.94)61.26 (8.28)Lumbar spine areaPlv-A†171.8 (32.53)213.5 (32.92)Pelvis areaWd-BMC†0.67 (0.21)0.72 (0.21)Ward’s triangle BMCLRb-BMC79.65 (16.75)100.8 (20.84)Left rib BMCRRb-BMC†85.88 (18.47)107.1 (23.55)Right rib BMCLS-BMC55.12 (14.72)65.92 (14.91)Lumbar spine BMCPlv-BMC†181.2 (48.61)242.5 (60.49)Pelvis BMCWd-BMD0.57 (0.16)0.61 (0.16)Ward’s triangle BMDLRb-BMD†0.62 (0.07)0.69 (0.08)Left rib BMDRRb-BMD0.62 (0.07)0.70 (0.08)Right rib BMDLS-BMD†1.03 (0.17)1.07 (0.16)Lumbar spine BMDPlv-BMD1.04 (0.14)1.12 (0.15)Pelvis BMDLArm-Ft†1181 (359.1)847.4 (299.5)Left arm fat mass††RArm-Ft1193 (367.7)863.6 (308.4)Right arm fat massTrk-Ft†10,102 (3450)9169 (3448)Trunk fat massWBT-Ft†19,835 (5324)16,469 (5486)Whole body total fat massLArm-Ln†1711 (274.5)2952 (486.4)Left arm lean mass†Mass (g)Age69.49 (10.68)†Lean mass (g)49.23 (15.05)57.39 (8.68)†Fat mass (g)48.02 (14.64)157 (6.14)†Bone mineral density (g/cm )DescriptionNumber of subjectsHeight (cm)†2Men1633Weight (kg)††Bone mineral content (g)Women2285RArm-Ln1822 (290.6)3090 (495.8)Right arm lean massTrk-Ln†18,489 (2382)25,170 (3358)Trunk lean massWBT-Ln†37,204 (4616)52,528 (6827)Whole body total lean massLArm-Ms†2893 (522.8)3800 (639.5)Left arm mass†RArm-Ms3015 (536.7)3954 (646.9)Right arm massTrk-Ms†28,592 (5044)34,339 (5853)Trunk massWBT-Ms†57,040 (8565)68,998 (10534)Whole body total massThese results reveal significant differences between men and women by independent two-samples t-tests [means (standard deviations)]. Ward’s triangle is thespace formed at the femoral neck by the intersection of three trabecular bundles, namely, the principal compressive, the secondary compressive, and the tensiletrabecular [53]SD standard deviation, BMC bone mineral content, BMD,bone mineral density*p 0.05; † p 0.001Of the bone density variables, the pelvis area (Plv-A)displayed the greatest negative association withhypertriglyceridemia in both the crude (OR 0.487[0.415–0.571]) and adjusted analyses (adjusted OR 0.641 (0.515–.796)). Among the body fat variables,Trk-Ft displayed the most significant association withhypertriglyceridemia in both the crude and adjustedanalyses.In men, among all variables, WC exhibited the strongestassociation with hypertriglyceridemia in the crude analysis(OR 1.738 [1.529–1.976]), but after adjusting for age andBMI, Trk-Ft exhibited the strongest association withhypertriglyceridemia (adjusted OR 1.565 [1.262–1.941]).Of the bone density variables, the left rib area (LRb-A) displayed the strongest association with hypertriglyceridemia(OR 1.566 [1.388–1.767]) in the crude analysis, and this
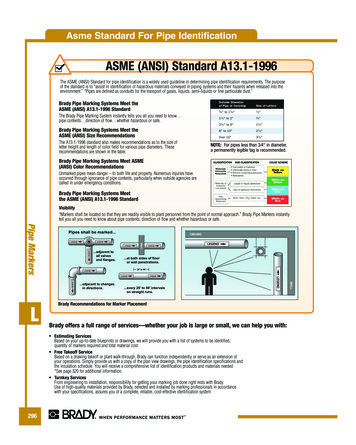
Chi et al. BMC Cardiovascular Disorders(2019) 19:66Page 5 of 12Table 2 Associations between hypertriglyceridemia and bone density and body fat mass in womenVariableMean (SD)CrudeAdjustedNormal groupPatient grouppORpAge47.17 (14.53)56.59 (12.89) 0.0011.957 (1.676–2.285)–OR–Height157.2 (6.098)154.8 (6.158) 0.0010.676 (0.585–0.780)0.7160.968 (0.812–1.154)Weight57.05 (8.528)60.76 (9.442) 0.0011.467 (1.288–1.672)0.9511.010 (0.736–1.386)WC77.35 (9.391)84.61 (8.807) 0.0012.075 (1.797–2.397)0.0011.615 (1.202–2.171)BMI23.11 (3.337)25.32 (3.273) 0.0011.777 (1.558–2.027)––Wd-A1.179 (0.103)1.175 (0.094)0.5480.957 (0.829–1.105)0.3451.083 (0.918–1.277)LRb-A127.7 (19.07)135.6 (22.02) 0.0011.473 (1.281–1.694)0.0081.272 (1.065–1.520)RRb-A136.2 (24.40)149.4 (24.27) 0.0011.684 (1.460–1.942)0.0981.172 (0.971–1.415)LS-A53.25 (7.868)51.93 (8.587)0.0240.846 (0.731–0.978)0.2531.097 (0.936–1.286)Plv-A173.7 (32.39)152.2 (27.05) 0.0010.487 (0.415–0.571) 0.0010.641 (0.515–0.796)Wd-BMC0.680 (0.212)0.603 (0.210) 0.0010.677 (0.579–0.791)0.6781.047 (0.844–1.298)LRb-BMC79.24 (16.37)83.76 (19.77) 0.0011.293 (1.127–1.482)0.0071.291 (1.071–1.556)RRb-BMC85.23 (18.25)92.38 (19.48) 0.0011.448 (1.261–1.662)0.1281.158 (0.959–1.399)LS-BMC55.48 (14.65)51.41 (15.00) 0.0010.746 (0.641–0.869)0.9481.006 (0.845–1.198)Plv-BMC183.1 (48.14)161.3 (49.06) 0.0010.620 (0.531–0.723)0.0690.827 (0.674–1.015)LRb-BMD0.574 (0.160)0.512 (0.166)0.3620.935 (0.809–1.080)0.4681.067 (0.896–1.270)Wd-BMD0.618 (0.069)0.613 (0.075) 0.0010.671 (0.577–0.780)0.7841.031 (0.829–1.282)RRb-BMD0.625 (0.069)0.617 (0.077)0.1260.892 (0.771–1.032)0.7921.023 (0.862–1.215)LS-BMD1.031 (0.174)0.977 (0.179) 0.0010.717 (0.615–0.836)0.2910.910 (0.764–1.084)1.119 (0.947–1.322)Plv-BMD1.04 (0.139)1.040 (0.158)0.7290.975 (0.844–1.126)0.187LArm-Ft1167 (356.2)1327 (357.1) 0.0011.487 (1.305–1.694)0.6420.947 (0.751–1.193)RArm-Ft1177 (364.5)1349 (364.2) 0.0011.522 (1.335–1.736)0.8410.976 (0.772–1.235)Trk-Ft9880 (3408)12,365(3049) 0.0011.940 (1.691–2.226) 0.0011.730 (1.291–2.319)WBT-Ft19,601 (5306)22,208 (4935) 0.0011.560 (1.367–1.782)0.7720.958 (0.717–1.280)LArm-Ln1705 (268.4)1771 (325.1)0.0011.254 (1.095–1.437)0.9511.005 (0.857–1.179)RArm-Ln1815 (285.0)1895 (335.1) 0.0011.293 (1.130–1.479)0.2711.093 (0.933–1.280)Trk-Ln18,430 (2325)19,098 (2833) 0.0011.300 (1.136–1.488)0.7661.030 (0.849–1.249)WBT-Ln37,112 (4513)38,144 (5484)0.0021.236 (1.078–1.416)0.8351.021 (0.840–1.242)LArm-Ms2873 (511.0)3098 (594.1) 0.0011.459 (1.284–1.658)0.7920.970 (0.776–1.213)RArm-Ms2993 (525.8)3244 (591.1) 0.0011.507 (1.326–1.714)0.4721.087 (0.866–1.365)Trk-Ms28,309 (4935)31,464 (5248) 0.0011.740 (1.526–1.985)0.0031.594 (1.166–2.181)WBT-Ms56,714 (8426)60,352 (9262) 0.0011.465 (1.285–1.669)0.9870.997 (0.727–1.368)The results of the crude analysis and analyses adjusted for age and BMI were obtained using a binary logistic regressionSD Standard deviation, OR Odds ratio, WC Waist circumference, BMI Body mass index, Wd-A Ward’s triangle area, LRb-A Left rib area,RRb-A Rightrib area, LS-A Lumbar spine area, Plv-A Pelvis area, Wd-BMC Ward’s triangle bone mineral content, LRb-BMC Left rib bone mineral content, RRbBMC Right rib bone mineral content, LS-BMC Lumbar spine bone mineral content, Plv-BMC Pelvis bone mineral content, LRb-BMD Ward’s trianglebone mineral density, Wd-BMD Left rib bone mineral density, RRb-BMD Right rib bone mineral density, LS-BMD Lumbar spine bone mineraldensity, Plv-BMD Pelvis bone mineral density, LArm-Ft Left arm fat mass, RArm-Ft Right arm fat mass, Trk-Ft Trunk fat mass, WBT-Ft Whole bodytotal fat mass, LArm-Ln Left arm lean mass, RArm-Ln Right arm lean mass, Trk-Ln Trunk lean mass, WBT-Ln Whole body total lean mass, LArm-MsLeft arm mass, RArm-Ms Right arm mass, Trk-Ms Trunk mass, WBT-Ms Whole body total massassociation remained highly significant after adjusting forconfounders (OR 1.332 [1.144–1.550]). Plv-A displayed astrong negative association with hypertriglyceridemia (adjusted OR 0.661[0.573–0.763]). In the present study,Trk-Ft exhibited the strongest associations with hypertriglyceridemia in both men (OR 1.565 [1.262–1.941]) andwomen (OR 1.730 [1.291–2.319]) in the adjusted analysis.Power of bone density and body fat mass in theidentification of hypertriglyceridemiaTable 4 lists the predictive power of all variables in identifying hypertriglyceridemia. WC exhibited the highestAUC value (AUC 0.718 [0.685–0.751]) in women.Among the bone density variables, Plv-A exhibited astrong predictive power (AUC 0.696 [0.660–0.731]),
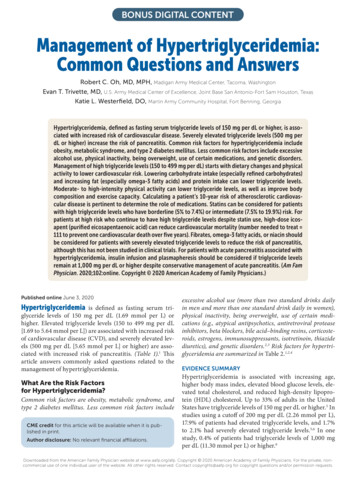
Chi et al. BMC Cardiovascular Disorders(2019) 19:66Page 6 of 12Table 3 Associations between hypertriglyceridemia and bone density and body fat mass in menVariableMean (SD)CrudeAdjustedNormal groupPatient grouppORpORAge49.04 (15.49)49.89 (13.32)0.3471.058 (0.941–1.191)––Height167.0 (6.450)169.2 (6.473)0.0420.884 (0.786–0.996)0.0550.873 (0.760–1.003)Weight68.68 (10.63)72.43 (10.39) 0.0011.411 (1.255–1.587)0.0840.788 (0.602–1.033)WC83.43 (8.954)88.14 (7.212) 0.0011.738 (1.529–1.976)0.0011.482 (1.171–1.877)BMI23.73 (3.090)25.24 (2.757) 0.0011.629 (1.443–1.839)––Wd-A1.175 (0.085)1.183 (0.084)0.1191.098 (0.976–1.234)0.1651.090 (0.965–1.230)LRb-A142.9 (21.90)152.8 (21.72) 0.0011.566 (1.388–1.767) 0.0011.332 (1.144–1.550)RRb-A150.9 (26.28)161.9 (27.08) 0.0011.501 (1.332–1.690)0.0111.217 (1.046–1.416)LS-A61.22 (8.233)61.42 (8.447)0.6921.024 (0.910–1.152)0.9651.003 (0.888–1.133)Plv-A215.8 (32.97)205.1 (31.39) 0.0010.714 (0.632–0.808) 0.0010.661 (0.573–0.763)Wd-BMC0.718 (0.211)0.715 (0.193)0.8230.987 (0.877–1.111)0.2990.920 (0.787–1.076)LRb-BMC99.24 (20.82)106.3 (20.00) 0.0011.390 (1.237–1.563)0.3221.082 (0.926–1.264)RRb-BMC105.3 (23.10)113.6 (24.06) 0.0011.411 (1.255–1.587)0.3651.076 (0.918–1.261)LS-BMC65.91 (15.07)65.97 (14.33)0.9501.004 (0.892–1.129)0.2720.933 (0.825–1.056)Plv-BMC243.6 (61.02)238.2 (58.38)0.1320.912 (0.809–1.028)0.0010.792 (0.687–0.913)LRb-BMD0.609 (0.161)0.603 (0.148)0.5450.964 (0.856–1.085)0.1140.877 (0.746–1.032)Wd-BMD0.692 (0.081)0.694 (0.071)0.7681.018 (0.905–1.144)0.0110.838 (0.731–0.960)RRb-BMD0.696 (0.077)0.699 (0.073)0.4301.048 (0.932–1.179)0.0500.878 (0.771–1.000)LS-BMD1.071 (0.167)1.069 (0.151)0.8300.987 (0.877–1.111)0.0990.901 (0.797–1.020)Plv-BMD1.117 (0.154)1.150 (0.153) 0.0011.228 (1.094–1.379)0.5591.041 (0.910–1.191)LArm-Ft820.2 (303.0)946.3 (264.2) 0.0011.502 (1.336–1.689)0.1621.139 (0.949–1.368)RArm-Ft837.3 (311.1)959.3(278.7) 0.0011.466 (1.304–1.648)0.5241.061 (0.884–1.274)Trk-Ft8759 (3452)10,662 (3000) 0.0011.729 (1.530–1.953) 0.0011.565 (1.262–1.941)WBT-Ft15,920 (5522)18,469 (4865) 0.0011.576 (1.399–1.776)0.0521.229 (0.998–1.512)LArm-Ln2942 (480.6)2991 (505.7)0.1001.103 (0.981–1.239)0.0340.850 (0.732–0.988)RArm-Ln3083 (489.2)3118 (519.1)0.2391.073 (0.954–1.206)0.0120.823 (0.708–0.958)Trk-Ln25,010 (3301)25,754 (3506) 0.0011.244 (1.107–1.398)0.0220.814 (0.683–0.971)WBT-Ln52,277 (6721)53,444 (7135)0.0051.185 (1.054–1.332)0.0030.756 (0.630–0.907)LArm-Ms3763 (634.5)3937 (639.9) 0.0011.304 (1.161–1.464)0.1560.869 (0.716–1.055)RArm-Ms3920 (642.0)4078 (650.5) 0.0011.269 (1.129–1.425)0.0270.800 (0.657–0.975)Trk-Ms33,770 (5803)36,416 (5567) 0.0011.559 (1.384–1.755)0.3211.144 (0.877–1.491)WBT-Ms68,197 (10473)71,913 (10253) 0.0011.414 (1.257–1.590)0.1060.801 (0.613–1.048)The results of the crude analysis and analyses adjusted for age and BMI were obtained using a binary logistic regressionSD Standard deviation,OR Odds ratio, WC Waist circumference, BMI Body mass index, Wd-A Ward’s triangle area, LRb-A Left rib area, RRb-A Right rib area, LS-ALumbar spine area, Plv-A Pelvis area, Wd-BMC Ward’s triangle bone mineral content, LRb-BMC Left rib bone mineral content, RRb-BMC Right rib bone mineralcontent, LS-BMC Lumbar spine bone mineral content, Plv-BMC Pelvis bone mineral content, LRb-BMD Ward’s triangle bone mineral density, Wd-BMD Left rib bonemineral density, RRb-BMD Right rib bone mineral density, LS-BMD Lumbar spine bone mineral density, Plv-BMD Pelvis bone mineral density, LArm-Ft Left arm fatmass, RArm-Ft Right arm fat mass, Trk-Ft Trunk fat mass, WBT-Ft Whole body total fat mass, LArm-Ln Left arm lean mass, RArm-Ln Right arm lean mass, Trk-LnTrunk lean mass, WBT-Ln Whole body total lean mass, LArm-Ms Left arm mass, RArm-Ms Right arm mass, Trk-Ms Trunk mass, WBT-Ms Whole body total massand among the body fat variables, Trk-Ft exhibited substantial predictive power (AUC 0.715 [0.684–0.747]).In men, Trk-Ft exhibited the highest AUC value amongall body fat variables (AUC 0.672 [0.643–0.702]). Ofthe bone density variables, LRb-A exhibited a strongpredictive power (AUC 0.633 [0.601–0.665]). Theseresults clearly revealed gender differences. Among allvariables, WC was the highest overall indicator ofhypertriglyceridemia in women, and Trk-Ft was thehighest overall indicator in men. The bone density variable Plv-A exhibited the strongest predictive power inwomen, and LRb-A was the strongest indicator in men.
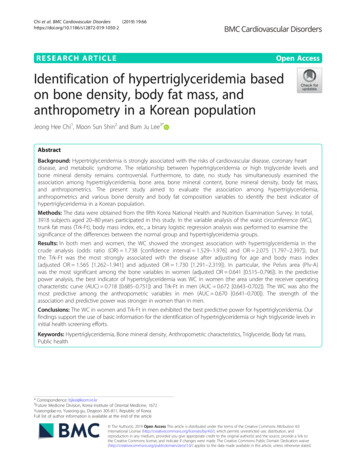
Chi et al. BMC Cardiovascular Disorders(2019) 19:66Table 4 Analysis of the predictive power of the individualmeasures using AUCsVariablesWomenMenAge0.687 (0.652–0.722)0.517 (0.485–0.548)Height0.614 (0.574–0.654)0.539 (0.505–0.572)Weight0.622 (0.581–0.662)0.606 (0.574–0.639)WC0.718 (0.685–0.751)0.670 (0.641–0.700)BMI0.695 (0.661–0.730)0.652 (0.621–0.683)Wd-A0.504 (0.466–0.543)0.531 (0.496–0.565)LRb-A0.607 (0.565–0.649)0.633 (0.601–0.665)RRb-A0.653 (0.614–0.691)0.619 (0.586–0.651)LS-A0.541 (0.497–0.584)0.505 (0.471–0.540)Plv-A0.696 (0.660–0.731)0.596 (0.564–0.629)Wd-BMC0.609 (0.569–0.649)0.492 (0.458–0.525)LRb-BMC0.564 (0.521–0.607)0.605 (0.573–0.637)RRb-BMC0.609 (0.568–0.650)0.601 (0.568–0.634)LS-BMC0.579 (0.537–0.622)0.508 (0.474–0.541)Plv-BMC0.637 (0.596–0.678)0.528 (0.494–0.561)Wd-BMD0.614 (0.573–0.655)0.500 (0.467–0.534)LRb-BMD0.530 (0.487–0.573)0.509 (0.476–0.542)RRb-BMD0.548 (0.504–0.592)0.516 (0.483–0.549)LS-BMD0.602 (0.560–0.644)0.495 (0.462–0.528)Plv-BMD0.508 (0.464–0.551)0.560 (0.527–0.593)LArm-Ft0.629 (0.590–0.667)0.639 (0.608–0.670)RArm-Ft0.638 (0.599–0.676)0.626 (0.594–0.657)Trk-Ft0.715 (0.684–0.747)0.672 (0.643–0.702)WBT-Ft0.650 (0.614–0.686)0.647 (0.616–0.677)LArm-Ln0.553 (0.509–0.598)0.529 (0.494–0.563)RArm-Ln0.569 (0.526–0.612)0.521 (0.486–0.555)Trk-Ln0.569 (0.524–0.613)0.559 (0.525–0.593)WBT-Ln0.552 (0.508–0.596)0.545 (0.511–0.580)LArm-Ms0.618 (0.576–0.660)0.582 (0.549–0.615)RArm-Ms0.631 (0.590–0.672)0.574 (0.540–0.607)Trk-Ms0.678 (0.641–0.714)0.637 (0.605–0.669)WBT-Ms0.621 (0.580–0.661)0.606 (0.573–0.639)AUC Area under the receiver operating characteristic curve. AUC values werecalculated by creating ROC curves using SPSS. WC Waist circumferencem, BMIBody mass index, Wd-A Ward’s triangle area, LRb-A Left rib area, RRb-A Rightrib area, LS-A Lumbar spine area, Plv-A Pelvis area, Wd-BMC Ward’s trianglebone mineral content, LRb-BMC Left rib bone mineral content, RRb-BMC Rightrib bone mineral content, LS-BMC Lumbar spine bone mineral content,Plv-BMC Pelvis bone mineral content, LRb-BMD Ward’s triangle bone mineraldensity, Wd-BMD Left rib bone mineral density, RRb-BMD Right rib bonemineral density, LS-BMD Lumbar spine bone mineral density, Plv-BMD Pelvisbone mineral density, LArm-Ft Left arm fat mass, RArm-Ft Right arm fat mass,Trk-Ft Trunk fat mass, WBT-Ft Whole body total fat mass, LArm-Ln Left arm leanmass, RArm-Ln Right arm lean mass, Trk-Ln Trunk lean mass, WBT-Ln Wholebody total lean mass, LArm-Ms Left arm mass, RArm-Ms Right arm mass, Trk-MsTrunk mass, WBT-Ms Whole body total massPage 7 of 12The predictive power of these variables in women wasstronger than that in men. Figures 2 and 3 show a comparison of the predictive power of several variables basedon the AUCs in men and women.DiscussionHigh TG levels are clearly associated with various diseases, such as CVD [2–4], CHD [5–7], insulin resistancesyndrome [12, 13], metabolic syndrome [8–11], and abdominal obesity [9, 12, 15–17].Numerous studies have investigated the best indicatorsof hypertriglyceridemia. Hypertriglyceridemia or TGlevels are associated with anthropometric measures. Asshown in a study conducted by Ghosh et al. [20], WCand the WHR are significantly and positively correlatedwith TG levels in middle-aged Bengalee Hindu men.According to Sharp et al. [21], WC is the single best indicator of the risk of disease, including CVD, in Hispanicand Caucasian adolescents. In a study conducted by Leeet al. [22], WC exhibited the best predictive power forhypertriglyceridemia in Korean adults. Lee et al. [23] alsoreported that the WHtR was the best discriminator ofdyslipidemia in both men and women. Moreover,women in whom dyslipidemia was identified tended tohave higher AUCs than men, which is consistent withthe results of the present study. Based on the results reported by Lee et al. [24], age is the highest risk factor inwomen, and the anthropometric measures of WHtR inwomen and the RFcR in men are the strongest indicatorsof hypertriglyceridemia. Most previous studies using anthropometric measures have revealed that the WC orWHtR is an important indicator of hypertriglyceridemiaor CVD. Our findings are consistent with the results ofsome previous studies [20–22] indicating that WC is animportant risk factor for hypertriglyceridemia in women.Many studies have also revealed a strong correlationbetween BMD and TG levels. According to Muhlen etal. [28], men and women with metabolic syndrome exhibit higher total hip BMDs than subjects without metabolic syndrome in an age-adjusted analysis. Men withmetabolic syndrome also exhibit higher femoral neckBMDs. Akira et al. [29] revealed a correlation betweenosteoporosis and hypertriglyceridemia in postmenopausal women. As reported in a study conducted byLawlor et al. [30], TG levels are positively associatedwith BMD, BMC, and BA in male but not female adolescents. Son et al. [31] reported that TG levels are positively correlated with bone density T-values, and asignificant positive correlation was observed in healthyKorean men after correcting for age and BMI. In a studyconducted by Cui et al. [32], the TG levels were significantly and positively correlated with the BMD at the trochanter site in postmenopausal women, andpremenopausal women with TG levels in the higher
Chi et al. BMC Cardiovascular Disorders(2019) 19:66Page 8 of 12Fig. 2 Comparison of the predictive power based on AUCs (the area under a receiver operating characteristic curve) among men. WC, Waistcircumference; BMI, Body mass index; Trk-Ft
findings support the use of basic information for the identification of hypertriglyceridemia or high triglyceride levels in initial health screening efforts. Keywords: Hypertriglyceridemia, Bone mineral density, Anthropometric characteristics, Triglyceride, Body fat mass, Public health