Transcription
Mon. Not. R. Astron. Soc. 000, ?–? (2012)Printed 15 January 2013(MN LATEX style file v2.2)arXiv:1208.1409v2 [astro-ph.CO] 14 Jan 2013Hα Kinematics of S4G spiral galaxies-I. NGC 864Santiago Erroz-Ferrer,1,2? Johan H. Knapen,1,2 Joan Font,1,2 John E. Beckman,1,2Jesús Falcón-Barroso,1,2 José Ramón Sánchez-Gallego,1,2 E. Athanassoula,3Albert Bosma,3 Dimitri A. Gadotti,4 Juan Carlos Muñoz-Mateos,5 Kartik Sheth,5,6,7Ronald J. Buta,8 Sébastien Comerón,9 Armando Gil de Paz,10 Joannah L. Hinz,11Luis C. Ho,12 Taehyun Kim,4,5,13 Jarkko Laine,14 Eija Laurikainen,14,15Barry F. Madore,12 Karı́n Menéndez-Delmestre,16 Trisha Mizusawa,5,6,7MichaelW. Regan,17 Heikki Salo 14 and Mark Seibert121Instituto de Astrofı́sica de Canarias, Vı́a Láctea s/n 38205 La Laguna, Spainde Astrofı́sica, Universidad de La Laguna, 38206 La Laguna, Spain3 Aix Marseille Université CNRS, LAM (Laboratoire d’Astrophysique de Marseille) UMR 7326, 13388, Marseille, France4 European Southern Observatory, Casilla 19001, Santiago 19, Chile5 National Radio Astronomy Observatory / NAASC, 520 Edgemont Road, Charlottesville, VA 22903, USA6 Spitzer Science Center, 1200 East California Boulevard, Pasadena, CA 91125, USA7 California Institute of Technology, 1200 East California Boulevard, Pasadena, CA 91125, USA8 Department of Physics and Astronomy, University of Alabama, Box 870324, Tuscaloosa, AL 35487, USA9 Korea Astronomy and Space Science Institute, 61-1 Hwaam-dong, Yuseong-gu, Daejeon 305-348, Republic of Korea10 Departamento de Astrofı́sica, Universidad Complutense de Madrid, Madrid 28040, Spain11 Steward Observatory, University of Arizona, 933 N. Cherry Ave, Tucson, AZ 85721, USA12 The Observatories of the Carnegie Institution for Science, 813 Santa Barbara Street, Pasadena, CA 91101, USA13 Astronomy Program, Department of Physics and Astronomy, Seoul National University, Seoul 151-742, Republic of Korea14 Division of Astronomy, Department of Physical Sciences, University of Oulu, Oulu, FIN-90014, Finland15 Finnish Centre of Astronomy with ESO (FINCA), University of Turku, Väisäläntie 20, FI-21500, Piikkiö, Finland16 Universidade Federal do Rio de Janeiro, Observatório do Valongo, Ladeira Pedro Antônio, 43, CEP 20080-090, Rio de Janeiro, Brazil17 Space Telescope Science Institute, 3700 San Martin Drive, Baltimore, MD 21218, USA2 DepartamentoAccepted 2012 July 23. Received 2012 July 9; in original form 2012 June 5ABSTRACTWe present a study of the kinematics of the isolated spiral galaxy NGC 864, usingHα Fabry-Perot data obtained with the Galaxy Hα Fabry-Perot System (GHαFaS)instrument at the William Herschel Telescope in La Palma, complemented with imagesat 3.6 µm, in the R band and in Hα filter, and integral-field spectroscopic data. Theresulting data cubes and velocity maps allow the study of the kinematics of the galaxy,including in-depth investigations of the rotation curve, velocity moment maps, velocityresidual maps, gradient maps and position-velocity diagrams. We find asymmetries inthe velocity field in the bar zone, caused by non-circular motions, probably in responseto the potential of the bar. We also find a flat-profile bar, in agreement with the strongbar, with the grand design spiral pattern, and with the gap between the ends of thebar and the start of the spiral arms. We quantify the rate of massive star formation,which is concentrated in the two spiral arms.Key words: galaxies : individuals : NGC 864 - galaxies: kinematics and dynamics galaxies: spiral galaxies: star formation.1INTRODUCTIONGalaxies are the basic building blocks of the Universe andtheir formation and evolution are of great interest in cur?Email: serroz@iac.esrent astrophysical research. Their dynamics and morphologyare the result of both externally driven (e.g. galaxy mergers) and secular evolution (e.g. bar or spiral pattern driven).Disentangling the different early evolutionary tracks is complicated by redshift, distance and dust absorption. Alterna-
2S. Erroz-Ferrer et al.tively one can explore the fossil record of evolution throughdetailed observations of the end product, nearby galaxies.One of the most important drivers of this internal secular evolution is the flow of gas into the central regions.This is the result of angular momentum loss in shocks induced by non-axisymmetric potentials, as generated by abar, interactions, minor mergers or even by minor deviations from axisymmetry such as ovals, lenses, lopsidednessor spiral arms (e.g. Schwarz 1984; Shlosman, Frank & Begelman 1989; Shlosman, Begelman & Frank 1990; Knapen et al.1995; Rix & Zaritsky 1995; Kormendy & Kennicutt 2004;Comerón et al. 2010). Around two-thirds of local galaxiesexhibit at least one bar (de Vaucouleurs et al. 1991; Sellwood & Wilkinson 1993; Moles, Marquez & Perez 1995;Ho, Filippenko & Sargent 1997; Mulchaey & Regan 1997,Hunt & Malkan 1999; Knapen, Shlosman & Peletier 2000;Eskridge et al. 2000; Laine et al. 2002; Laurikainen, Salo& Buta 2004; Menéndez-Delmestre et al. 2007; Marinova& Jogee 2007; Sheth et al. 2008; Laurikainen et al. 2009),so potential drivers of secular evolution are common. Lowmass discs acquired their bars later than more massive ones(Sheth et al. 2008), implying that the bar-driven secular evolution is expected to be different depending on each galaxy’smass.To study the influence of the past evolution of a galaxyon the observed morphology, kinematic information is essential. The study of velocity fields in spirals has mostlybeen done using the 21 -cm HI line, primarily because thisemission can be traced far out, often three or four timesbeyond the visible disc. Rots (1975), van der Hulst (1979),Bosma (1981), Gottesman (1982) and others demonstratedthe power of this technique in deriving the total mass distribution of disc galaxies. Since the beam sizes associatedwith 21 cm observations were typically at least as large asthe disc scale length of the galaxy, little small-scale structure in the velocity field was detected in this manner. TheHI Nearby Galaxy Survey (THINGS; Walter et al. 2008)presents some of the highest spatial resolution ( 600 ) 21-cmHI observations of nearby galaxies to date, using the VeryLarge Array (VLA) of the National Radio Astronomy Observatory (NRAO).The best candidate technique to yield two-dimensionalkinematical maps across a whole galaxy with good arcsecond spatial resolution is Hα. Due to the cosmic abundanceof hydrogen, Hα is often the brightest emission line in thevisible wavelength range. In spiral galaxies, this line tracesprimarily the ionized gas in HII regions around young massive stars. Traditional long-slit spectra with optical emission lines are valuable for deducing the rotation curve of agalaxy (e.g., Rubin, Ford & . Thonnard 1980, Rubin et al.1982, Rubin et al. 1985, Amram et al. 1992, Amram et al.1994, or ?), and the rotation curves can be extended to verylarge radii using Hα (e.g. Christlein & Zaritsky 2008). Hαobservations using Fabry-Perot (FP) instruments have beenused for some 40 years now (Tully 1974; Deharveng & Pellet 1975, Dubout et al. 1976 or de Vaucouleurs & Pence1980), and have since been employed to create high signalto-noise ratio (S/N) rotation curves for many spiral galaxies(e.g., Marcelin, Boulesteix & Georgelin 1985; Bonnarel et al.1988; Pence, Taylor & Atherton 1990; Corradi & Capaccioli1991; Cecil, Wilson & Tully 1992; Sicotte, Carignan & Durand 1996; Ryder et al. 1998; Jiménez-Vicente et al. 1999;Garrido et al. 2002, Epinat, Amram & Marcelin 2008, andmany more).Using the Infrared Array Camera (IRAC; Fazio et al.2004) operating at 3.6 and 4.5 µm, the Spitzer Survey ofStellar Structure in Galaxies (S4 G; Sheth et al. 2010) targets over 2300 galaxies. The sample is volume-, magnitudeand size-limited (d 40 Mpc, mb 15.5, D25 1 arcmin). Thecornerstone of the survey is the quantitative analysis of photometric parameters, enabling a variety of studies on secularevolution, outer disc and halo formation, galaxy morphologyetc. The new images, much deeper than traditional groundbased near-IR observations, will allow a comprehensive anddefinitive study of galaxy structure not only as a function ofstellar mass, but also as a function of environment, vital totest cosmological simulations predicting the mass propertiesof present day galaxies.We have designed an observing programme to obtainHα FP kinematic data sets of over 40 spiral galaxies thatare included in the S4 G sample. The observation of NGC864 is part of this wider programme using the instrumentGalaxy Hα Fabry-Perot System (GHαFaS) at the WilliamHerschel Telescope (WHT) in La Palma. NGC 864 is usedto illustrate the data and methods, and discuss the kinds ofresults the main survey will give.2TARGET SELECTIONThe galaxies in our FP programme had to satisfy the following requirements: first of all, the galaxy should fit well in theGHαFaS field of view (FOV) of 3.4 3.4 arcmin. Therefore,galaxies with diameters between 2.7 and 3.4 arcmin were selected. The declination should be higher than -10 so thatthe altitude in the sky can be enough at the time of theobservation in La Palma, the Hubble type should be laterthan Sab (T 2; RC3, de Vaucouleurs et al. 1991) to ensureHα emission, and only galaxies with inclinations between 0 and 70 were selected.These criteria yielded a sample of 108 S4 G galaxies,from which the observed sample was selected by requiringa spread in morphological type, galaxy mass (from absolutemagnitude; ten galaxies in each of four bins), bar presence,visibility on the sky and finally, the availability of ancillarydata (interferometric CO, HI, ultraviolet, Spitzer mid-IR orHerschel ). The galaxies observed in our first observing runwere NGC 428, NGC 864, NGC 918, NGC 1073 and NGC7479. This paper will concentrate on the galaxy NGC 864.NGC 864 is a spiral galaxy, well isolated from nearby,similar-sized companions [Catalog of Isolated Galaxies(CIG); Karachentseva 1973], although it is a radial-velocityconfirmed member of a small group (?), including UGC 1670(v 1601 km/s; M 3.12 mag; 84 arcmin or 5.7 Mpcaway from NGC 864) and UGC 1803 (v 1624 km/s; M 3.0 mag; 89 arcmin or 6.1 Mpc away from NGC 864);all these values taken from the NASA/IPAC ExtragalacticDatabase (NED). NGC 864 is classified as SAB(rs)c by Thede Vaucouleurs Atlas of Galaxies (Buta, Corwin & Odewahn 2007). Buta et al. (2005) found a maximum relativebar torque Qb 0.321, implying that the bar is fairly strongin spite of its apparent weakness in blue light. The maincharacteristics of the galaxy are presented in Table 1.This galaxy has been observed and analysed by many
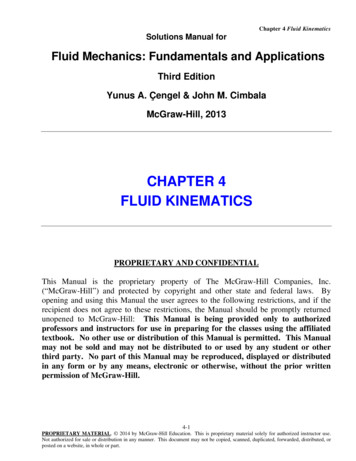
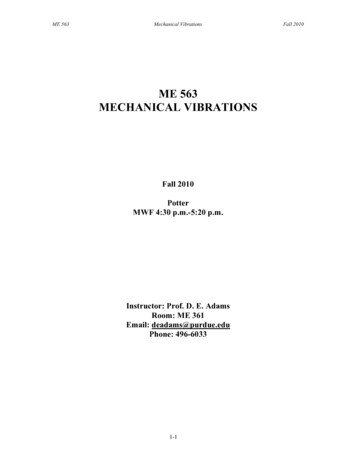
Hα Kinematics of NGC 864Table 1. Galaxy global properties. (1) The centre position wasfixed to the position of the optical centre from Leon & VerdesMontenegro (2003). (2) The systemic velocity is listed as the central velocity of the HI spectrum measured at the 20% level, fromEspada et al. (2005). (3) Distance calculated after applying theVirgo, GA and Shapley corrections, with H0 73 5 km s 1Mpc 1 , from NASA/IPAC Extragalactic Database (NED). (4)Morphological type from The de Vaucouleurs Atlas of Galaxies,(Buta, Corwin & Odewahn 2007). (5) B magnitude from TheThird Reference Catalogue of Bright Galaxies (RC3; de Vaucouleurs et al. 1991). (6) Bar and Spiral Arm torques, from Butaet al. (2005). (7) Disc inclination and position angle (PA) of thekinematic major axis, from the RC3. (8) Disc inclination andPA obtained from the 25.5 mag/arcsec2 isophote with the S4 G3.6 µm image, calculations and uncertainties explained and tobe published in Muñoz-Mateos et al. (2012, in prep). (9) Discinclination and PA from our Hα FP data (Section 4.2.1). (10)Luminosity and Star Formation Rate (SFR) of the whole galaxymeasured from our Hα images (Section 4.3).NameNGC 864CommentsαJ2000.0δJ2000.0vsys (km s 1 )D (Mpc)TypemB (mag)QbQsiRC3i3.6µmiHαPARC3PA3.6µmPAHαL(Hα) (erg s 1 )SFR (M yr 1 )2h 15m 27.6s 06 000 09.1001561.620.9 1.5SAB(rs)c11.62 0.210.3210.13443 44.6 28.2 20.4 20 22.0 25.3 6.7 (4.0 1.6) · 10412.19 (10)3OBSERVATIONS AND DATA REDUCTIONThe data for NGC 864 have been taken at different epochsusing three different instruments of the 4.2-m WHT on theRoque de Los Muchachos Observatory in La Palma: theGHαFaS instrument, the Auxiliary port CAMera (ACAM)and the Spectrographic Areal Unit for Research on OpticalNebulae (SAURON) integral field spectrograph. These dataare complemented with a 3.6 µm Spitzer image from theS4 G survey.3.1ACAMOne of the motivations of this paper is to develop a methodto flux-calibrate GHαFaS Fabry-Perot data cubes. To dothis, we have obtained narrow-band imaging of the galaxynearly simultaneously with the GHαFaS data. NGC 864 wasobserved on 2010 September 4 with the ACAM instrument,permanently mounted at a folded-Cassegrain focus of theWHT (Benn, Dee & Agócs 2008). The FOV in imaging modeis 8 arcmin, with a pixel size of 0.25 arcsec.Two images were taken with ACAM: a 30 s exposureimage using a Johnson filter R, with central wavelength 6228Å and FWHM 1322 Å; and an Hα image, with an exposuretime of 300 s, using a narrow filter having a central wavelength 6589 Å and FWHM 15 Å. The [NII]-6548 line fallsinto the narrow filter transmission range (at 6582 Å), witha similar throughput to the Hα line (which lies in 6597 Å).However, the contribution of the [NII] line is not important,as in the majority of star forming regions in galaxy discs the[NII] fraction is small or negligible (James et al. 2005).The basic reduction of these images was performedmainly using IRAF. Firstly, bias and flat corrections weremade. Then, the continuum was subtracted following theprocedures outlined in Knapen et al. (2004) and the imagewas photometrically calibrated. To perform the continuumsubtraction, the R-band image was scaled by a factor of0.0109 and subtracted from the Hα image. The resultingimages are shown in Figure 1.3.2other authors, whose work we summarise here. Martini et al.(2003) studied visible and near-IR Hubble Space Telescope(HST) images and color maps of NGC 864, identifyingbright star formation rings. One of these is a small circumnuclear star-forming ring with a radius of less than 100 pc,confirmed by the Atlas of Images of NUclear Rings (AINUR;Comerón et al. 2010). Epinat, Amram & Marcelin (2008) described the analysis of Hα FP cubes of 97 galaxies includedin their GHASP survey of 207 spiral galaxies, presenting therotation curve of every galaxy, including NGC 864. Buta &Zhang (2009) found three corotation radii in the galaxy: onelies within the bar, the next is located slightly beyond wherethe bar ends and the third is within the inner spiral arms.Espada et al. (2005) provide the most extensive and significant study of NGC 864, via HI observations. They measure large-scale asymmetries in the two-dimensional kinematics, finding that the galaxy’s profiles are symmetric invelocity but asymmetric in intensity. These asymmetries arefound in the outer parts of the disc, beyond the extent ofour new data.33.2.1GHαFaSObservations and data reductionThe galaxy was observed for 4 hours on the same night as theACAM images with GHαFaS (?), situated in the Nasmythfocus of the WHT. GHαFaS is a Fabry-Perot imaging interferometer that provides high spectral resolution Hα imageswith a seeing-limited spatial resolution within a 3.0 4 3.0 4FOV. The instrument is composed of a focal reducer, a filterwheel, a Fabry-Perot etalon, an image photon-counting system (IPCS) camera, and a calibration lamp (neon source).The etalon employed works at an interference order of 765and a Free Spectral Range (FSR) of 391.9 km s 1 . Eachobservational cycle consists of stepping through the etalonfor 10 seconds per channel. In the observation of NGC 864,29 cycles of 48 channels/cycle were observed in total. Thehigh spatial resolution mode was used, achieving a 8.167km/s velocity resolution with 0.00 2/pix scale in 1k 1k pixelimages.As a proper de-rotator at the Nasmyth focus of the telescope is not provided for GHαFaS, the Fabry-Perot cubes
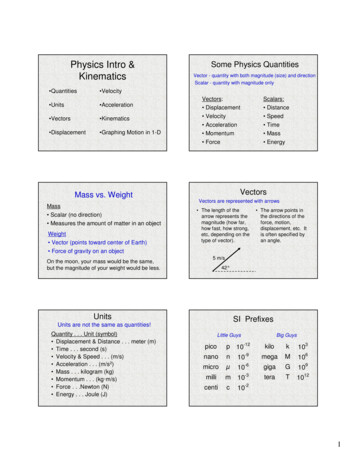
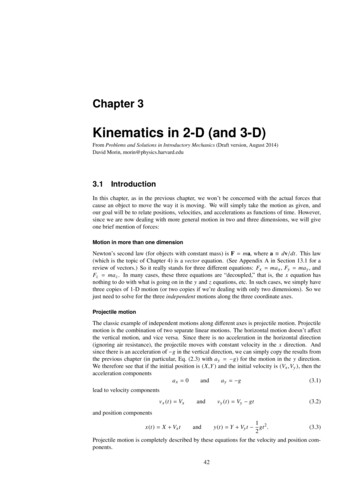
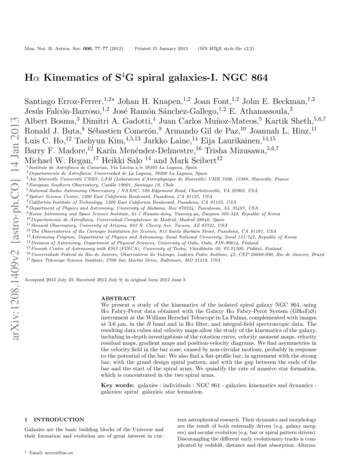
4S. Erroz-Ferrer et al.30.001:00.0Dec .0 2:15:30.0 28.026.024.022.0RA (J2000)30.001:00.0Dec (J2000)30.0night was around 1.00 2, with stages of 0.00 8 during the 4 hoursof observation). The cube was smoothed to different resolutions with the GIPSY task SMOOTH. We have workedat two different spatial resolutions. A first slight smoothingwas done so that the image loses very little spatial resolution,hence taking advantage of the high spatial resolution of theinstrument (high-resolution cube hereafter, with a FWHMof 1.00 65 1.00 56). Then, a 300 300 smoothing was performed inorder to get continuous spatial information and to highlightlow-emission regions, facilitating the computation of, for instance, the rotation curve (hereafter low-resolution cube).After the spatial smoothing, the continuum was subtractedusing CONREM of GIPSY, which estimates the continuumlevel from the line-free frames (the first three channels andthe last seven in this case).To create moment maps, the GIPSY task MOMENTSwas used. The moment maps start from the smoothed andcontinuum-subtracted cubes. We imposed two conditions:the signal has to be higher than 3σ, in at least three adjacent channels. The resulting moment maps are presentedin Figure 2. There is a little leakage from the neighbouring [NII]-6548 line, that has to be taken into account whencalibrating the flux. However, whenever a second peak ispresent, the task MOMENTS does not take it into accountbecause it only uses the main 0 2:15:30.0 28.026.024.022.0RA (J2000)Figure 1. R-band (top) and continuum-subtracted Hα (bottom)images of NGC 864, taken with ACAM.need to be de-rotated before being further reduced. To dothis, we have followed the work done by ?. Two fixed pointsin the field are selected in every image (ideally stars), andused to de-rotate each plane. Lamp exposures are used tocalibrate the observations in wavelength (see ?). Due to thenature of the Fabry-Perot data, any two-dimensional transformation (translation or rotation) of the raw images has tobe done three-dimensionally (including the third spectral dimension), and thus wavelength calibration and de-rotationmust be performed simultaneously. The resulting de-rotatedand wavelength-calibrated data cube is then imported intoGIPSY (Groningen Image Processing System; van der Hulstet al. 1992). The data are placed on an astrometrically correct spatial grid by comparing the positions of stars in theACAM images, yielding a data cube of 48 planes of 1001 1001 pixels each. A very bright star nearby, approximately atRA 2h 15m 30s and DEC 05 590 4900 , was masked out withthe GIPSY task BLOT.De-rotating blurs the image somewhat, and the FWHMafter the de-rotation was determined to be 1.00 56 along theRA-axis and 1.00 4 along the DEC-axis (the worst seeing thatFlux calibrationThis paper presents the first attempt to flux-calibrate aGHαFaS data cube. Previous observations with the instrument were used for kinematic studies and therefore did notneed to be flux-calibrated. The continuum-subtracted andflux-calibrated ACAM Hα image was used to perform theflux calibration of the GHαFaS data. Fluxes from selectedHII regions in both the GHαFaS cube and the ACAM image were measured, and then compared. The transmission ofthe filter has to be taken into account, assuming a Gaussianprofile. As explained before, the ACAM Hα image containsa little leakage coming from the [NII]-6548 line, and theFP also used a filter that allowed light from that [NII]-lineto come in. It is thus necessary to correct for these leaks,and the correction applied is of 3% following the proceduresof James et al. (2005). Figure 3 presents the linear fit todata points corresponding to a set of HII regions from theGHαFaS and ACAM data.The uncertainty in the flux calibration is 10% to 20%,arising mainly from the use of galaxy distance in the calibration of the ACAM image, and to a lesser degree from themethod described above.3.3SAURONNGC 864 was also observed with the two-dimensionalintegral-field spectrograph SAURON (Bacon et al. 2001),and these data of NGC 864 were presented in Ganda et al.(2006). SAURON delivers a spectral resolution of 4.2 ÅFWHM, spatial sampling of 0.96 arcsec and covers the narrow spectral range 4800-5380 Å (1.1 Å pixel 1 ). This wavelength range includes a number of important stellar absorption lines (e.g. Hβ, Fe, Mgb) and potential emission lines aswell (Hβ, [OIII], [NI]). The field of view, of 33 41 arcsec2 ,
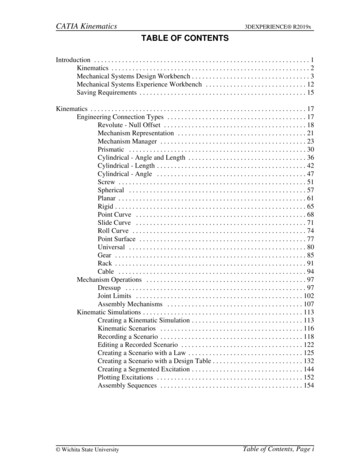
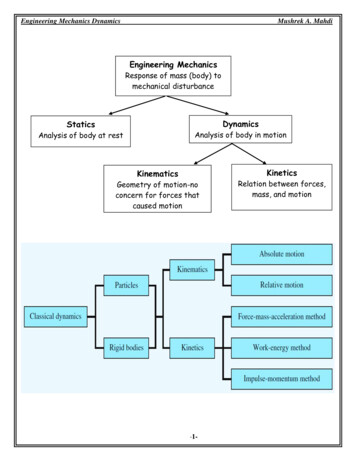
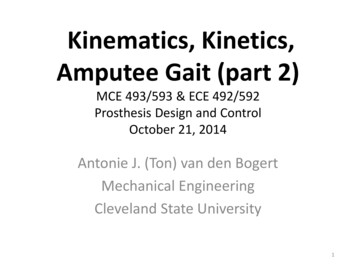
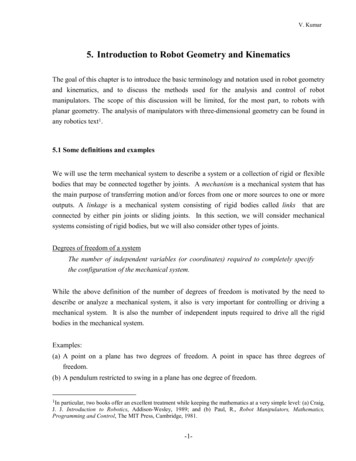
Hα Kinematics of NGC 8645Figure 2. a) Intensity map for the high-resolution data. The centre is marked with A. B is the brightest HII region, located at the endof the western arm. C and D refer to other regions of massive star formation, found at the ends of the bar, and near the beginning ofthe arms. b) Velocity map for the high-resolution data. c) Dispersion velocity map for the high-resolution data. d) Intensity map for thelow-resolution data. e) Velocity map for the low-resolution data. f ) Dispersion velocity map for the low-resolution data. The centre ofthe galaxy is indicated with a cross, calibrated colours are labelled in the vertical colour bars.Figure 3. Linear fit for the flux calibration. With squares, fluxesof some HII regions measured in ACAM Hα image presented versus the fluxes of the same regions measured in the GHαFaS Hαintensity map, whereas the straight line represents the line fittedto the data.The data for this galaxy were taken in 2004 January 20-26.Four exposures of 1800 s each were obtained using the lowspatial resolution mode of SAURON, with the FOV mentioned before.Ganda et al. (2006) reduced the data using the dedicated software XSAURON, including bias and dark subtraction, rotation of all the frames, extraction of the spectrausing the fitted mask model, wavelength calibration, lowfrequency flat-fielding and cosmic ray removal. Ater that,the data reduction consisted of homogenization of the spectral resolution over the FOV, sky subtraction, and finallyflux calibration of the spectra, although the data were notnecessarily collected under photometric conditions. In Figure 4, the velocity maps for gas (Hβ) and stars (computedusing the wavelength region that contains the Hβ, Fe5015and Mgb absorption lines; see Ganda et al. 2006 for moredetails) are presented.3.4is much smaller than those of GHαFaS or ACAM, but theinstrument delivers stellar as well as ionized gas kinematicinformation simultaneously.Ganda et al. (2006) presented the stellar and gas kinematics of 18 nearby late-type galaxies, including NGC 864.S4 G imageIn order to derive geometric galaxy parameters and to studyspecific galaxy features, a 3.6 µm image from the S4 G survey has been used. This image was observed in the warmmission phase of Spitzer. As the galaxy diameter is lowerthan 3.0 3 and the Spitzer FOV is 5’, the galaxy was mappedusing a single pointing, following a standard cycling small
6S. Erroz-Ferrer et al.Figure 4. a) Velocity map of the stars in NGC 864, observedwith SAURON. b) Velocity map of the gas (Hβ) observed withSAURON. The kinematic minor axis (PA 20) is plotted with adotted line, whereas the straight line shows the derived systemicvelocity (see Section 4.2.1). The centre is indicated with a cross.dither pattern with 4 exposures of 30 seconds each in twoseparate Astronomical Observation Requests (AORs). Theimage has a pixel scale of 0.00 75, with an angular resolutionof 1.00 7. The reduction pipeline is described in detail in Shethet al. (2010).44.1RESULTSMorphologyNGC 864 is a late-type barred spiral galaxy, with strongemission in the centre. In blue light, the type is SAB(rs)c(The de Vaucouleurs Atlas of Galaxies; Buta, Corwin &Odewahn 2007), but the mid-IR type is more like SAB(rs)bor bc. The bar does look stronger in the S4 G image (Figure5), but not as strong as in type SB. The bar is foreshortened, which undoubtedly contributes to its weak projectedappearance.The bar and some dust lanes can be distinguished in theACAM R-band image (Figure 1). The bar presents brightregions of massive star formation at the ends, where twoFigure 5. Top: 3.6 µm S4 G image. Bottom: the same with Hαcontours at 1.1 · 1036 erg/s, taken from the ACAM image.asymmetric arms arise. The arms do not, as is usually thecase in galaxies, start at the end of the bar, but in fact overshoot that position, leading to a mismatch between the startof the spiral arms and the ends of the bar. We measure fromthe S4 G image that the eastern arm starts 0.89 0.07 kpcaway from the eastern end of the bar, while the western armarises 0.96 0.07 kpc from the western end of the bar. Thisgap between the end of the bar and the start of the spiralarms may be the space between the inner resonances andcorotation, as spiral arms may be excited only beyond corotation [like Elmegreen & Elmegreen (1985) found in someflat-profile bar spirals].The arms make less than a half-turn before disappearing. The outer spiral pattern is more flocculent than a twoarmed spiral, but not as flocculent as e.g. NGC 2841 (Block,Elmegreen & Wainscoat 1996). This was also noticed byElmegreen & Elmegreen (1987), as they classified NGC 864to be a grand design galaxy with Arm class 5, i.e. two symmetric, short arms in the inner regions and irregular outerarms.The skewed appearance of the bar in NGC 864 seemsto be a result of projection effects. It is possible to distinguish both the outer flat part of the bar (i.e. the part of thebar coplanar with the disc) and the inner vertically thick-
Hα Kinematics of NGC 864ened part of the bar (usually referred to as a box/peanut’bulge’). Athanassoula & Beaton (2006) presented N -bodysimulations of barred galaxies explaining how projection effects can lead to the same configuration in the case of M31.In NGC 864, the flat outer part of the bar has a positionangle (PA) of about 90-100 degrees (counter clockwise fromNorth), whereas the inner part of the bar has a PA of around70-80 degrees.Alternatively, the skewed appearance of the bar mightbe real. If we inspect the bar starting from the galaxy centre, it looks straight initially and then curls a little likean open spiral, although the overshoot of the main armscould contribute to this. In addition, the inner section lookslike a twisted oval, and not much like a box with a subtleX-pattern. In the de Vaucouleurs Atlas of Galaxies (Buta,Corwin & Odewahn 2007), clearer cases of low inclinationexamples of this are present.We have performed a bulge/disc/bar 2D decompositionof the S4 G 3.6µm image of NGC 864, using budda (deSouza, Gadotti & dos Anjos 2004; Gadotti 2008), in orderto check whether the light profile along the bar is exponential or rather flat. Elmegreen & Elmegreen (1985) found thatbars in galaxies with morphological types later than Sc showexponential light profiles, whereas bars in galaxies with earlier types show flat profiles. The RC3 classification of NGC864 is Sc, and thus it is clearly a borderline case. The fit iscomplicated by the projection effects mentioned above andthe rather unusual start position of the spiral arms. We findthat the Sérsic index of the bar is 0.24, meaning that the barprofile is flat, and even somewhat brightening at the ends,although this is likely an effect of an enhanced luminosityat the ends due to a pair of bar ansae and the beginningof the spiral arms. Nevertheless, the bar profile is certainlynot exponential. To verify the robustness of these results,several fits were performed with varying initial parameters.Although the results of each of these fits show variations fora few parameters, the bar Sérsic index is always lower than0.5, confirming a flat light profile, with high confidence.Elmegreen et al. (2011) present a study of spiral armproperties of 46 galaxies in the S4 G sample, which in effect forms a modern-day extension of the pioneering work ofElmegreen & Elmegreen (1985). In their sample, all of theflocculent barred galaxies have exponential bars, while all ofthe grand design barred galaxies have flat bars. NGC 864 isa grand design galaxy with a flat profile and thus fits intothis picture.Athanassoula & Misiriotis (2002) showed that flat profiles are found in strong bars and exponential ones in weakerbars. This fits in with the results as presented by Combes& Elmegreen (1993), who found from simulations that flatand exponential bars are linked to the shape of the rotationcurve and halo concentration, finding that flat bars tend tooccur in galaxies with sharply rising inner rotation curves(as we find in NGC 864 - see Section 4.2), while exponentialbars tend to occur in galaxies with slowly rising rotationcurves. Athanassoula (2003) showed that this is due to thefact that sharply rising rotation curves are linked to a strongspheroidal component in the inner parts, and a considerableamount of spheroidal mass around the main resonances. Thisleads to significant angular momentum exchange within thegalaxy, which in turn can lead to strong bars. This was further discussed by Athanassoula et al. (2009), who modeled7the two bar types and compared them to observations madeby Gadotti et al. (2007).NGC 864 is a clear case where a flat-profile bar is foundin a two-armed spiral with a strong bar. The fact that thereis a gap between the ends of the bar and the beginningof the spiral arms is also consistent with flat-profile bars(Elmegreen & Elmegreen 1985). The bar does indeed appearto be of the ansae type, which is very unusual for a late-typegalaxy (Martinez-Valpuesta, Knapen & Buta 2007). Thismeans that NGC 864 is an example of an early-type bar ina late-type galaxy. Its spiral structure, however, is not verygrand design even in the mid-IR. Also, it is not an ansaetype in the typical manner since it looks like an open spiral.The moment 0 maps (left plots in Fig
H FP kinematic data sets of over 40 spiral galaxies that are included in the S4G sample. The observation of NGC 864 is part of this wider programme using the instrument Galaxy H Fabry-Perot System (GH FaS) at the William Herschel Telescope (WHT) in La Palma. NGC 864 is used to illustrate the data and methods, and discuss the kinds of