Transcription
AGILE: GIScience Series, 3, 72, 2022. dings of the 25th AGILE Conference on Geographic Information Science, 2022.Editors: E. Parseliunas, A. Mansourian, P. Partsinevelos, and J. Suziedelyte-Visockiene.This contribution underwent peer review based on a full paper submission. Author(s) 2022. This work is distributed under the Creative Commons Attribution 4.0 License.Enriching geospatial data with computer vision to identify urbanenvironment determinants of social interactionsFrancisco Garrido-Valenzuela1,2, Sander van Cranenburgh1, and Oded Cats21Transport and Logistics Group, Department of Engineering Systems and Services, Faculty of Technology, Policy, andManagement, Delft University of Technology, Delft, the Netherlands2Transport and Planning, Faculty of Civil Engineering and Geosciences, Delft University of Technology, theNetherlandsCorrespondence: Francisco Garrido-Valenzuela (f.o.garrido-valenzuela@tudelft.nl)Abstract. Characteristics of urban space (co-)determinehuman behaviour, including their social interactionpatterns. However, despite numerous studies that haveexamined how the urban space impacts socialinteractions, their relationships are still poorlyunderstood. Recent developments in computer vision andmachine learning fields offer promising new ways toanalyse and collect data on social interactions. This studyproposes a new computer vision-based approach to studyhow the urban space impacts social interactions. Theproposed method uses pre-trained object detection modelsto detect social interactions (including their geo-locations)from street-view imagery. After that, it regresses urbanspace characteristics –which are also detected usingobject detection models – on social interactions. For thisstudy, 294,852 street-level images from three Dutch citiesare analysed. Results from linear regression analysis showthat for these three Dutch cities people tend to meet inplaces with a strong presence of recreational attractionsand bicycles. Also, the results of data collection and imageprocessing can be used to identify the areas most likely toproduce social interactions in urban space to conducturban studies.Keywords. social interaction, object recognition, urbandesign, computer vision1 IntroductionCharacteristics of the urban space define the patterns ofhow people socially interact with others in cities. Socialinteraction – defined as reciprocal stimulation amongindividuals – is a complex behaviour where cities'appearance, amenities, and form have significant impacts(Lebel et al., 2012). Urban space concerns all city spacesbetween buildings in the open air (Krier & Rowe, 1979).It can be described using a variety of variables, includingthe road network, traffic volumes, street furniture, landuses, etc. For instance, it is expected that interactionsbetween people tend to take place in locations with betterwalking accessibility (Sheng et al., 2021; Abass &Tucker, 2021), greenery neighbourhoods (Abass &Tucker, 2016; Krellenberg et al., 2014), places with slowmoving traffic or limited parking (Uslu et al., 2010), andneighbourhoods with a shorter distance to the city centre,mixed land-uses, and higher densities (Mouratidis, 2018).These hypothesised relations imply that specificcharacteristics of the urban space are more likely topromote social interactions between individuals thanothers.A thorough understanding of the relationships anddynamics between urban space and social interactions isessential for society. The COVID-19 pandemic hasreduced the possibilities for face-to-face interactionbetween individuals. This has highlighted the harmfuleffects of the lack of it on people's well-being, which hasincreased cases of mental disorders, suicides, domesticviolence, and disease-related deaths (Holt-Lunstad,2021). By reshaping the urban space, policymakers andurban planners could stimulate the number of socialinteractions and decrease the undue adverse effectscaused by the lack thereof. A deep understanding of thisrelationship will help policymakers to consider theimpacts of urban-related projects on social interactionsand prioritise or define projects positively impacting thissocial behaviour.The relationship between urban space characteristics andsocial interactions is still poorly understood. While aconsiderable body of research is devoted to identifying theeffects of social factors on social interactions, only a few1 of 5
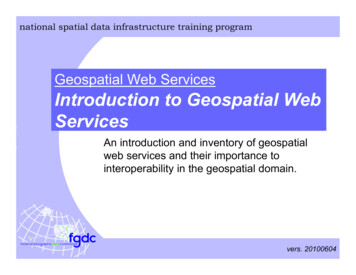
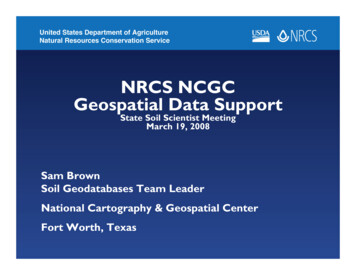
studies have considered the impact of urban space onhuman interactions (Abass et al., 2020). Moreover,contradicting findings are reported. For instance, whilesome studies claim that higher density areas cause socialproblems such as a lack of a sense of safety and fewersocial interactions (Soltani et al., 2019), other reportsevidence pointing in the opposite direction (Mouratidis,2018). The small number of studies and the sometimescontradictory results may be partly explained by thedifficulty of collecting high-quality data on socialinteractions. The state of practice in social interaction datacollection is based on questionnaires (Sugiyama &Thompson, 2006), surveys (Abass and Tucker, 2021),field observations (Lipovská et al., 2013) and other paperdiary methods (Mossong et al., 2008). These practices areoften slow, inaccurate, expensive, or intrusive.Consequently, data on social interactions are scarce –hindering studying the phenomenon (McCall, 2015).Recent development in machine learning and computervision offer promising ways to analyse and collect urbanand social interaction data. Several computer visionstudies have developed models to infer social interactionsbased on so-called F-formations (Zhang & Hung, 2016;).Additionally, object recognition models have beendeveloped that can accurately detect objects, such asbuildings, amenities, and vehicles in images (Howard,2019). These developments in computer vision, combinedwith the widespread availability of geo-tagged images(e.g., from Google street-view), enable creating highresolution datasets of social interaction and studyingsocial interaction in more profound ways.The objective of this study is twofold. The substantive aimis to deepen understanding of the relationship between theurban space and the places where people have socialinteractions. The methodological aim is to develop acomputer-vision-based method to analyse the areas mostlikely to produce social interactions in urban space. Thisstudy ultimately aims to enable planners to design moreliveable cities that promote social interactions.2 Methodologycoordinates are stored. The Geographic InformationSystem (GIS) data are composed of urban-relatedconcepts such as network topology, locations of differentshops or facilities, or polygons of parks, and are retrievedfrom OSM. A program was developed in Python usingGeoPandas and was executed using a Core i5 8GB ramLinux Mint machine.2.2 Social interaction and object detection usingcomputer visionGSV images are analysed to identify people as well asurban-related factors. This study uses the number ofpeople as a proxy for the frequency of social interactions.Therefore, the GSV images are processed with an objectrecognition model – a machine learning method used torecognise objects in images – for people identification.More specifically, we use SSDMobileNetV3 (Howard,2019). Finally, since each image is geo-located, thepropensity of social interactions can be mapped. Inaddition, the GSV images are exploited to identify urbanrelated variables and characteristics to complement theGIS data collected from OSM. We extract from theimages the presence of vehicles, bikes, etc.; urbanamenities, such as bus stops, benches, bike racks,children's playgrounds, etc.; and land use, such as offices,shops, residential zones, etc. To do so, we use the sameobject-recognition model as we used to identify people.2.3 Establish relations between social interactions andurban-related dataThis study applies linear regression to identifyrelationships between the number and locations of socialinteractions (i.e., number and location of people) andtransport factors. Social interaction is the dependentvariable, and all urban-related variables (e.g., networktopology, presence of vehicles, bus stops, benches, orshops) are the independent ones. Next, we apply a spatialauto-correlation model. This model allows studying thespatial relationships between the locations of, e.g.,vehicles and social interactions. Both approaches aim atidentifying what urban variables and characteristicscorrelate with the location of social interactions.2.1 Data and software availabilityThis study uses street-level images and geographicinformation from Google and Open Street Map (OSM).The data are collected per city and obtained within theiradministrative boundaries. Images come from GoogleStreet View (GSV) by querying for different coordinates.Each GSV image corresponds to a 360-degree panoramaview from which four independent images of 90-degreesview are obtained. In addition, for each image, the datewhen the picture was taken (month and year) and its exact3 Results3.1 Data collectionWe analyzed GSV images and collected GIS data for threecities in the Netherlands: Delft, Gouda, and Katwijk. Weretrieved 294,852 street-level images for the years 2015to 2021. In addition, the traffic network and data of someamenities such as the location of restaurants, schools, orpubs are obtained from OSM. For illustration, Fig. 1AGILE: GIScience Series, 3, 72, 2022 https://doi.org/10.5194/agile-giss-3-72-20222 of 5
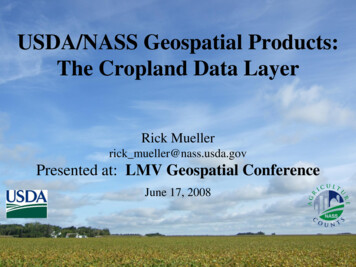
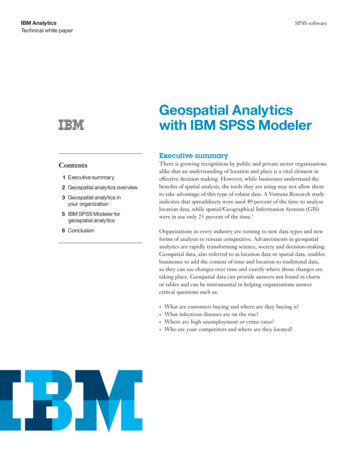
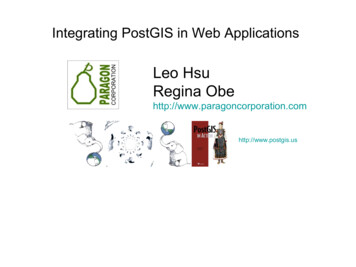
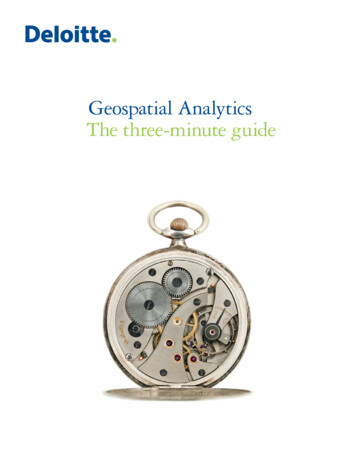
shows the location of the images collected in red dots, theamenities in dark stars and the underlying traffic networkfor Gouda.Figure 1. Data collected for the city of Gouda, the Netherlands.Red dots are the location of GSV images, dark stars indicateamenities such as restaurants, libraries, bars, schools, etc., andthe lines correspond to the traffic network.3.2 Street view imagery processWe illustrate the results of the image processing approachfor the city centre of Delft, see Fig. 2. The left-hand sidemap shows the number of people per hexagon; the righthand side map shows the number of vehicles per hexagon.To create these maps, 8,840 street-level images from 2018are used. Using SSDMobileNetV3, we identify and countthe number of people and private vehicles. Finally, weaggregate the counts to 30 meter-side hexagons.models, the dependent variable is the average number ofpeople per image in a hexagon; the independent variablesare the number of cars, bicycles, buses per hexagon (ascounted from the images), the number of amenities for therespective hexagon, such as restaurants, pubs, or cinemas(recreational); services such as banks, libraries, schools,etc. (data from OSM); the number of intersections; andthe total meters of streets inside each hexagon.As shown in Tab. 1, the number of people present in theurban space is highly correlated with the location ofrecreational amenities and places with more bikes. Inaddition, the relationship with motorcycles is similar tothat of bicycles, which makes sense in the case of theNetherlands, where some motorcycles can use bike lanes.In addition, our results indicate that people tend to be inplaces with more intersections and denser in terms ofstreet length. Even though a visual inspection of Figure 2may suggest a negative relation between the presence ofpeople and cars, no statistically significant relationship isfound.4 Conclusions and next stepsThe use of images at the street level as input data canprovide information to improve the understanding of therelationship between the urban space and the places wherepeople have social interactions. Also, the results of datacollection and image processing with a computer-visionbased method can be used to identify the areas most likelyto produce social interactions in urban space. TheFigure 2. (a) People presence and (b) vehicle counts in the city centre of Delft. 8,840 street-level images from GoogleStreet View were collected, and data is aggregated in 30-meter-side hexagons.3.3 Establish relations between social interactions andurban environment dataTab. 1 shows the results of the linear regression modelsfor each city and all cities combined. In the regressionpotential of the proposed measurement and analysismethod. The linear regression results indicate that forthese three Dutch cities people tend to meet in places witha strong presence of recreational attractions and bicycles.Our study demonstrates how street-level images canAGILE: GIScience Series, 3, 72, 2022 https://doi.org/10.5194/agile-giss-3-72-20223 of 5
Table 1. Linear regression results for the three cities and all cities together. Columns Coef. and Test-t show thecoeficients of each variable in the linear regression and test-t value, respectively.provide useful information to perform spatial analysis incities. Object detection in urban images can be applied indifferent fields to understand patterns of urban design,residents' and visitors' behaviour, and municipaloperations.As part of ongoing work, we conduct a statistical analysisof the number of people per spatial unit across cities. Ournext step is to advance our methods toward socialinteractions using F-Formations. Furthermore, we intendto enhance our regression techniques, e.g., by applyingmore advanced methods and ML techniques that accountfor spatial-autocorrelation and test different urbanenvironment variables to identify the key determinants ofthe location of social interactions.AcknowledgementsThis work is supported by TU Delft AI Labs programme.ReferencesAbass, Z. I. and Tucker, R. (2016). Fifty shades of green:tree coverage and neighbourhood attachment inrelation to social interaction in australian suburbs. InASA 2016: Revisiting the Role of ArchitecturalScience in Design and Practice: Proceedings of the50th International Conference of the ArchitecturalScience Association, pages 259–268. University ofAdelaide.Abass, Z. I. and Tucker, R. (2021). Talk on the street:the impact of good streetscape de- sign onneighbourhood experience in low-density suburbs.Housing, Theory and Society, 38(2):204–227.Abass, Z. I., Andrews, F., and Tucker, R. (2020).Socialising in the suburbs: relationships be- tweenneighbourhood design and social interaction in low-density housing contexts. Journal of urban design,25(1):108–133.Howard, A., Sandler, M., Chu, G., Chen, L.-C., Chen,B., Tan, M., Wang, W., Zhu, Y., Pang, R.,Vasudevan, V., et al. (2019). Searching formobilenetv3. In Proceedings of the IEEE/CVFInternational Conference on Computer Vision, pages1314–1324.Barrat, A., Cattuto, C., Colizza, V., Pinton, J.-F., Broeck,W. V. d., and Vespignani, A. (2008). High resolutiondynamical mapping of social interactions with activerfid. arXiv preprint arXiv:0811.4170.Bramley, G., Dempsey, N., Power, S., and Brown, C.(2006). What is ‘social sustainability’, and how doour existing urban forms perform in nurturing it. InSustainable Communities and Green Futures’Conference, Bartlett School of Planning, UniversityCollege London, London.Cristani, M., Bazzani, L., Paggetti, G., Fossati, A.,Tosato, D., Del Bue, A., Menegaz, G., and Murino,V. (2011). Social interaction discovery by statisticalanalysis of f-formations. In BMVC, volume 2, page4. Citeseer.Eagle, N. and Pentland, A. S. (2006). Reality mining:sensing complex social systems. Personal andubiquitous computing, 10(4):255–268.Holt-Lunstad, J. (2021). A pandemic of social isolation?World Psychiatry, 20(1):55.Howard, A., Sandler, M., Chu, G., Chen, L.-C., Chen,B., Tan, M., Wang, W., Zhu, Y., Pang, R.,Vasudevan, V., et al. (2019). Searching formobilenetv3. In Proceedings of the IEEE/CVFInternational Conference on Computer Vision, pages1314–1324.AGILE: GIScience Series, 3, 72, 2022 https://doi.org/10.5194/agile-giss-3-72-20224 of 5
Kendon, A. (1990). Conducting interaction: Patterns ofbehavior in focused encounters, vol- ume 7. CUPArchive.Krellenberg, K., Welz, J., and Reyes-Päcke, S. (2014).Urban green areas and their potential for socialinteraction–a case study of a socio-economicallymixed neighbourhood in santiago de chile. HabitatInternational, 44:11–21.Krier, R. and Rowe, C. (1979). Urban space. Academyeditions London.Lebel, L., Krittasudthacheewa, C., Salamanca, A., andSriyasak, P. (2012). Lifestyles and consumption incities and the links with health and well-being: thecase of obesity. Current opinion in environmentalsustainability, 4(4):405–413.Lipovská, B. et al. (2013). Assessing observationmethods for landscape planning practice in ruralvillages. Current Urban Studies, 1(04):102.Aided Architectural Design Futures, pages 264–278.Springer.Sugiyama, T. and Thompson, C. W. (2006).Environmental support for outdoor activities andolder people’s quality of life. Journal of Housing forthe Elderly, 19(3-4):167–185.Tran, K. N., Yan, X., Kakadiaris, I. A., and Shah, S. K.(2015). A group contextual model for activityrecognition in crowded scenes. In VISAPP (2), pages5–12.Uslu, A. et al. (2010). Social interaction in urbantransformation areas and the characteristics of urbanoutdoor spaces: a case study from turkey. AfricanJournal of Agricultural Research, 5(20):2801–2810.Zhang, L. and Hung, H. (2016). Beyond f-formations:Determining social involvement in free standingconversing groups from static images. InProceedings of the IEEE conference on computervision and pattern recognition, pages 1086–1095.Maslow, A. H. (1943). A theory of human motivation.Psychological review, 50(4):370.McCall, C. (2015). Mapping social interactions: thescience of proxemics. Social Behavior from Rodentsto Humans, pages 295–308.Mossong, J., Hens, N., Jit, M., Beutels, P., Auranen, K.,Mikolajczyk, R., Massari, M., Salmaso, S., Tomba,G. S., Wallinga, J., et al. (2008). Social contacts andmixing patterns relevant to the spread of infectiousdiseases. PLoS medicine, 5(3):e74.Mouratidis, K. (2018). Built environment and socialwell-being: How does urban form affect social lifeand personal relationships? Cities, 74:7–20.Newman, P. (2014). Density, the sustainabilitymultiplier: Some myths and truths with appli- cationto perth, australia. Sustainability, 6(9):6467–6487.Setti, F., Lanz, O., Ferrario, R., Murino, V., and Cristani,M. (2013). Multi-scale f-formation discovery forgroup detection. In 2013 IEEE InternationalConference on Image Processing, pages 3547–3551.IEEE.Sheng, Q., Wan, D., and Yu, B. (2021). Effect of spaceconfigurational attributes on social interactions inurban parks. Sustainability, 13(14):7805.Soltani, S., Gu, N., Paniagua, J. O., Sivam, A., andMcGinley, T. (2019). Investigating the social impactsof high-density neighbourhoods through spatialanalysis. In International Conference on Computer-AGILE: GIScience Series, 3, 72, 2022 https://doi.org/10.5194/agile-giss-3-72-20225 of 5
Enriching geospatial data with computer vision to identify urban environment determinants of social interactions Francisco Garrido-Valenzuela1,2, Sander van Cranenburgh1, and Oded Cats2 1 Transport and Logistics Group, Department of Engineering Systems and Services, Faculty of Technology, Policy, and Management, Delft University of Technology, Delft, the Netherlands