Transcription
APS Contract #52372Q100APS: Gila Bend Cluster 2010 Q1Q2 SISQ100 Cluster Addendum1. INTRODUCTIONThis Interconnection Customer (IC), submitted a Small Generator Interconnection Request (IR)to Arizona Public Service Company (APS) for their proposed project, located near theintersection of 363rd Avenue and W. Dobbins Road in Buckeye, Arizona. The InterconnectionCustomer (IC) requested Energy Resource Interconnection Service (ERIS), and plans to install20 MW of photovoltaic solar generation with a requested In-Service Date of October 31, 2012.The project’s requested Point of Interconnection (POI) is the Arlington-Wintersburg 69 kV line.The project is Queue Position 100 (Q100) in the APS FERC generation interconnection queue.On August 23, 2010, Arizona Public Service Company (APS) filed a request for a one-timewaiver of the current study order of Interconnection Requests (IR) to allow a cluster study basedin the Gila Bend area. This geographically targeted one-time waiver request of APS’ currentinterconnection queue procedure was changed to: 1) allow APS to study all SGIP and LGIPprojects submitted in the Gila Bend area in first and second quarter of 2010 as a single cluster,2) the clustered IRs will share the cost of common upgrades on a pro-rata basis, 3) each projectsubject to the cluster was given a one-time opportunity to opt out of the cluster, and 4) APS willevaluate projects outside of the cluster as if the clustering never occurred. On September 29,2010, the Federal Energy Regulatory Commission (FERC) granted this waiver. Q100 is one ofthe projects in the cluster. General cluster results are captured in the general cluster SIS report.This addendum addresses project specific details and results.The Interconnection Customer has chosen to interconnect as an ERIS. With an EnergyResource Interconnection Service request, delivery of the Q100 output beyond the POI wouldbe on an “as-available” basis only and would be subject to the firm or non-firm transmissioncapacity that may be available when a transmission service request is made. Nothing in thisreport constitutes an offer of transmission service or confers upon the InterconnectionCustomer, any right to receive transmission service. APS may not have the Available TransferCapability (ATC) to support the Transmission Service for the interconnection described in thisreport.It should also be noted that the results in this SIS are dependent upon the assumed topologyand timing of new projects in the Gila Bend area, which are subject to change. The APStransmission and sub-transmission systems are continuously being evaluated. The plannedreinforcements and their in-service dates are often revised depending upon local area loadforecasts.A summary of the Interconnection costs and schedule estimates are shown below in Tables 1.1and 1.2.Table 1.1: Summary of Interconnection Cost and Schedule EstimatesFacilityCostsTimelineLocal Network Upgrades (LNUs)Transmission Provider'sInterconnection Facilities 2,111,00016 Months 141,00012 MonthsTotal 2,252,00016 MonthsPage 1 of 10
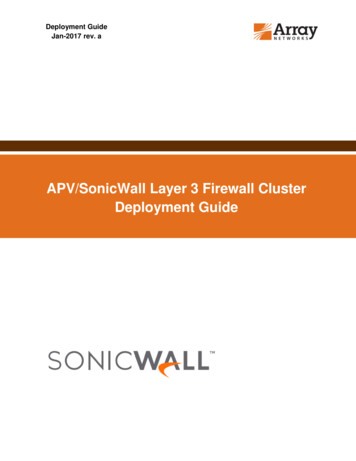
APS Contract #52372Q100APS: Gila Bend Cluster 2010 Q1Q2 SISTable 1.2: Pro-Rata Share of System Network Upgrade Costs and Schedule EstimateFacilityCostsTimelineQ100 Pro-Rata Share of System Network Upgrades (SNUs) 7,656,56143 - 49 MonthsTotal 7,656,56143 - 49 MonthsThe interconnection costs shown in Table 1.1 above are specifically to interconnect Q100 intothe APS transmission system. The System Network Upgrades (SNUs), as described in themain report, are shown in Table 1.2 above. The total cost to interconnect Q100 into the APSsystem is 9,908,561.The total estimated completion time for interconnecting the Q100 project is 43 – 49 Months dueto the construction of the SNUs. The actual start of construction would occur when the ICprovides written authorization to proceed, provided all interconnection studies are complete, andagreements and funding arrangements are in place. Therefore, the requested In-Service Dateof October 31, 2012 cannot be met. Q100 will be given the first available In-Service Date oncethe Interconnection Agreement has been signed, which will be based on the Network Upgradesrequired at that time.Figure 1.2 below shows a general depiction of the 69 kV system around Q100’s proposed POI.The other Cluster projects are not shown, however higher queued projects are shown, as wellas any non-FERC 12 kV projects.Figure 1.2: Project Location and 69 kV SystemDesert artesso TempSubstationWintersburgSubstationQ100230/69kV100 MVAPOI#1Lower RiverSubstation20ArlingtonSubstation230/69kV167 MVABaselineSubstationValenciaSubstation69 kVRobbinsButteSubstation69kV bus69kV line69kV breakerNew 69 kV ring busCluster generatorNon-cluster generatorNote: The numbers within the circles represent MW values.Page 2 of 10
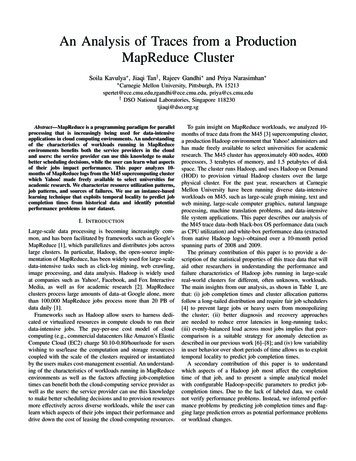
APS Contract #52372Q100APS: Gila Bend Cluster 2010 Q1Q2 SIS2. RESULTSThe Cluster report details the overall results. Individual project results will only be noted in theproject specific appendix if something is deemed confidential from the remainder of the Clusteror if it specifically affects the project or project model. All other results are included in the mainCluster report.Thermal: The Q100 33/0.80 kV transformer showed N-0 loading levels between 100-101% inall cases.Transient Stability: Two N-1 contingencies resulted in undamped behavior of most projectoutput variables. In addition, the frequency and voltage of nearby buses were affected andshowed similar undamped behavior.As noted in the main Cluster report: Although multiple inverter models were affected, and thelarger variable was location, further testing indicated that one particular inverter model seemedto cause the undamped behavior. In addition, although all of the Cluster inverter models havethe required /- 0.95 dynamic pf at the generator terminals, not all respond in the transienttimeframe. That said, further testing of these contingencies showed that adding sufficientcapacitance in the transient timeframe eliminated the violations, and showed the invertermodels responding as expected.The dynamic model provided for this project's inverter is the model that appears to cause theundamped behavior. Further, this model does not regulate voltage in the transient timeframe.The project's dynamic model needs to be reviewed/revised prior to the Interconnection FacilitiesStudy, or prior to any restudy, to eliminate a possible modeling issue. Failing resolution withupdated models, which could include adding transient-timeframe reactive dynamic response tothe inverter dynamic model, a suitable dynamic reactive device (such as a DVAR1 or SVC)would be required.Table 2.1: Transient Stability ResultsContingency Description20132014SensitivityMitigationInstall dynamic reactive device at POIBUS1 69 kVif review/update of applicable dynamic modelsdoes not resolve issue.Install dynamic reactive device at POIBUS1 69 kVN-1 POIBUS 6-BUCKEYE 69 kV (#663)LL and HSLL and HSand/or Baseline 69 kV, if review/update ofapplicable dynamic models does not resolve issue.Note: N-1 POIBUS 6-BUCKEYE 69 kV also showed WCA voltage violations at some buses affected by the undamped behavior.N-1 POIBUS 1-WINTERBURG 69 kV (#652)LL onlyLL onlySample Transient Plots for three contingencies are shown on the following pages. They reflecta 2013 LL case. The first two plots represent the undamped behavior noted in the table above,prior to mitigation with a dynamic reactive device. The third plot (N-1 SADDLE MTN-HARQAHALA TAP69 kV) shows a more typical response.1DVAR: Dynamic VARPage 3 of 10
APS: Gila Bend Cluster 2010 Q1Q2 SISAPS Contract #52372Q100N-1 Contingency: POIBUS 1 - Wintersburg 69 kVPage 4 of 10
APS: Gila Bend Cluster 2010 Q1Q2 SISAPS Contract #52372Q100N-1 Contingency: POIBUS 6 - Buckeye 69 kVPage 5 of 10
APS: Gila Bend Cluster 2010 Q1Q2 SISAPS Contract #52372Q100N-1 Contingency: Saddle Mountain - Harquahala Tap 69 kVPage 6 of 10
APS Contract #52372Q100APS: Gila Bend Cluster 2010 Q1Q2 SIS3. PROJECT MODELINGAll projects were assumed to be generating at maximum output. Projects consisted of anequivalent generator, equivalent inverter transformer, station transformer, and gen-tie.Individual project collector systems were not modeled. New switching stations were modeled,bisecting existing lines, based on interconnection requirements and locations. Some projectsrequired additional shunt devices to provide the full /- 0.95 pf at the POI.APS allows the project's reactive support to be made up of dynamic VAr and switched static VArdevices. The reactive devices used to achieve /- 0.95 power factor as measured at thegenerator terminal must be dynamic. Any additional reactive support required to compensatefor losses between the generator terminals and the POI may be made up of switched staticreactive devices and/or any additional reactive capability of the generator beyond 0.95 powerfactor.Q100 has selected the AE Solaron 1000 inverters. Based on the PQ Diagram provided, theinverter is able to provide /- 0.90 pf at the generator terminals for all MW output levels. Theadditional reactive power requirement to provide /- 0.95 pf at the POI may be provided bystatic reactive support. Q100 needs to install a 0.8 MVAr shunt capacitor at the 33.0 kV bus, orequivalent.Major components of the equivalent project model include:Gen-tie: 0.1 miles 3/0 ACSRStation Transformer: 1 x 22 MVA, 69/33 kV transformerInverter Transformer: 1 x 20 MVA, 33/0.80 kV transformerGenerator: 20 MW, equivalent of twenty (20) 1 MVA AE Solaron inverters, /- 0.90pf capabilityShunt capacitor: 0.8 MVAr shunt capacitor at 33.0 kV bus to compensate for projectlosses and achieve /- 0.95 pf at the POI2Figure 3.1: Project Model and POIWintersburg69 kVNew POIBUSArlington69 kVGen-tie0.1 miles3/0 ACSR69 kV22 MVAZ 8% on 12 MVAX/R 2033 kV10 x 2 MVAZ 5.75% on 2 MVAX/R 90.80 kVQ10020 MW2The value was calculated to meet the minimum power factor requirements, based upon the project model provided.Page 7 of 10
APS Contract #52372Q100APS: Gila Bend Cluster 2010 Q1Q2 SIS4. TRANSIENT STABILITY MODELINGQ100 provided a user defined epcgen model for the AE Solaron inverter. The trip times wereupdated based on the Extended Ride-Through Option provided in the AE Solarondocumentation. Those values are shown in the table below in red.solaron.pRev SLF ModelingRev1B, 3/3/11Default:PSLF ModelingRev1B, 3/3/11Ext Ride-ThroughQ100001.21.10.0031.822.50.425From .10.0031.822.50.425From 72.0Page 8 of 10
APS Contract #52372Q100APS: Gila Bend Cluster 2010 Q1Q2 SIS5. COST AND CONSTRUCTION SCHEDULE ESTIMATESThe cost and time estimates represent good faith estimates necessary to interconnect to thesystem. The non-binding, good faith cost and time estimates are tabulated below.Assumptions:Terrain was not considered when estimating line route.Permit costs are not included in the estimate.All weather access road costs are not included in the estimate.Land acquisition costs are not included in the estimate as it was assumed parcel forswitchyard would be deeded to APS from the IC.ROW 40 foot width.Access & Lay Down Yards are not included in the estimate.Rough grading costs are not included in the estimate.APS will construct, own and operate the 69 kV facilities in the new APS switchyard andthe portion of 69 kV line from the 69 kV bus up to the first structure outside the subfence.The IC will construct, own and maintain the 69 kV gen-tie from the first structure outsidethe sub fence to the Q100 site.The IC will be responsible for providing a fiber optic communications path from the Q100facility to the new APS switchyard.Line estimates do not include costs to reconfigure APS lines as a result of IC 69 kV routeor design.All estimates are in 2012 dollars.Table 5.1 below provides a summary of the Local Network Upgrades (LNUs) and TransmissionProvider’s Interconnection Facilities (TPIF) cost estimates. These costs include the constructionof a new 69 kV 3-breaker ring switchyard on the IC’s property, and a 1 mile double-circuit 69 kVline from the switchyard to the existing APS Arlington – Wintersburg line. Table 5.2 belowshows the pro-rata share of the SNU costs required for this cluster, as well as the estimatedconstruction schedule to complete the upgrades.Table 5.1: Q100 Project Costs.Equipment DescriptionNew APS 69 kV SwitchyardOverhead Line Work (1 mi dbl-ckt)Land ROW (1 mi dbl-ckt)Communications (Fiber)SubtotalGrand TotalLocal NetworkUpgrades (LNUs) 1,464,000 400,000 87,000 160,000 2,111,000Transmission Provider'sInterconnection Facilities 141,000 0 0 0 141,000 2,252,000Page 9 of 10
APS Contract #52372Q100APS: Gila Bend Cluster 2010 Q1Q2 SISTable 5.2: Pro-Rata Share of System Network Upgrade Costs and Schedule EstimateFacilityCostsTimelineQ100 Pro-Rata Share of System Network Upgrades (SNUs) 7,656,56143 - 49 MonthsTotal 7,656,56143 - 49 MonthsThe interconnection costs shown in Table 5.1 above are specifically to interconnect Q100 intothe APS transmission system. The System Network Upgrades (SNUs), as described in themain report, are shown in Table 5.2 above. The total cost to interconnect Q100 into the APSsystem is 9,908,561.The SNU cost responsibility for a specific individual project will be based on the pro-rata shareas identified above, and may change (increase or decrease) depending on the remainingprojects in the cluster as well as the timing of the specific project’s advancement through theAPS interconnection process. All network upgrade costs (LNUs and SNUs) are consideredAPS Network Upgrades, which are typically repaid to the IC, per FERC rules, as transmissioncredits over a maximum of twenty (20) years. The Transmission Provider’s I
Table 1.2: Pro-Rata Share of System Network Upgrade Costs and Schedule Estimate Facility Costs Timeline Q100 Pro-Rata Share of System Network Upgrades (SNUs)