Transcription
Food Security ClusterCore Indicator HandbookV3, September 2015
IntroductionThis Food Security Cluster Core Indicator Handbook was produced throughthe cluster’s Programme Quality Working Group as part of an overall effortto improve the effectiveness and efficiency of the cluster activities. Theindicators included here were developed as part of coordinated efforts by theInter-Agency Standing Committee’s Needs Assessment Task Force in 2013,which sought to compile an online registry of key indicators for all IASCclusters and sectors, available via the Humanitarian Response website. Thesecond version of this handbook was published in July 2015.By facilitating the collection, management and dissemination of key datathrough better use of indicators, the guidelines support the Food SecurityCluster to identify sector-level priorities and monitor the cluster’s progressagainst them.The Food Security Cluster Core Indicator Handbook provides guidance onthe selection and use of each indicator, during the various phases of theHumanitarian Programme Cycle (HPC). Based on wide consultation withglobal and country level clusters, these guidelines include an explanation ofthe way in which the indicators can and should be operationalized, includingguidance on reporting purposes, data collection methodology and calculationinstructions.The role of indicatorsIndicators are key to provide evidence-based data to inform the decisionmaking of cluster members and to improve accountability. The use ofindicators also allows data collection to be conducted in a systematicmanner, in accordance with recognised standards. Indicators are alsonecessary to enable reliable and consistent reporting of quantifiable data thatinform food security actions and measure output, outcome and impact alongthe HPC.Standardized indicators enable data reported by country-level clusters to beboth comparable and informative to the reporting objectives of the globallevel cluster. The ability to utilize indicators according to the various stagesof the HPC gives the Food Security Cluster the potential to tailor itsinformation management to the changing requirements as the emergencysituation evolves.Target AudienceThese guidelines are intended for Food Security Cluster team members(cluster/sector coordinators, information managers, and assessment and2
database focal points) as well as other field practitioners involved in a foodsecurity cluster or in-country coordination mechanism, with the objective ofensuring an effective and coordinated food security response.This document aims to provide the user with operational flexibility in thechoice and management of indicators, which can be adapted to contextspecific needs and objectives. These guidelines do not provide exhaustiverecommendations on the setup of data collection and data management toolsand users of these guidelines should therefore be well versed in setting upand managing information management mechanisms and in creating theframework for the reporting and analysis of any data collected.Document StructureThe guidelines are intended to serve as a practical reference tool to supportFood Security practitioners in the selection and use of indicators. Followingan overview of key terms, each of the agreed Food Security indicators ispresented together with a definition, an explanation of the rationale behindit, the reporting purpose, IASC response phase, and guidance onmethodology for measurement. Indicators are grouped under several subdomains: Food Access; Availability; Utilization; Food Assistance; andAgriculture & Livestock.3
KEY TERMS / NOTES% Change: co m par iso n between pre and post crisis situatio n. Foreach indicator the word “change” was introduced to clarify that to measurethe impact of a shock it is always useful to compare with pre-crisis data andtherefore, as a data preparedness measure, whenever possible theseindicators should be collected on a regular basis. In any case, in the absenceof pre-crisis data these indicators can still be collected as a way to define thecurrent food security situation of a given population.Note on Disaggregation: Disaggregatio n of data w ill be especiallyhelpful for determining which groups are most at risk and affected by acrisis. As appropriate, each indicator should be disaggregated by sex (male/female), age, beneficiary category, pregnant, people living with HIV, disabled,traders, market actors, producers, activity, food assistance (fortified blendedfoods, ready to use foods, special nutritional products), non-food item,agricultural item, urban/rural areas, head of household (female headed HH,child headed HH [under 18], disabled headed HH, elderly headed HH [over60]), religious, ethnic or political identities, community and household. Theeffectiveness of different indicators by different disaggregation can changewith location and time; the factors by which data can be stratified should beselected on the basis of the situation analysis.The tables on the following pages explain how each Food Security Clusterindicator should be disaggregated.4
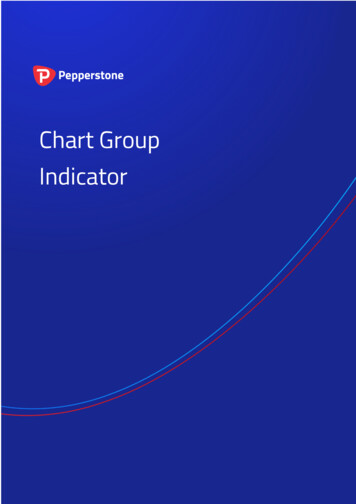
Disaggregation by:Sex/ageSituation IndicatorsSex ofhouseholdheadS1. Change in food consumption patternsxS2. Change in food sourcexS3. % change in key food & non-food commoditypricesS4. Coping StrategiesxS5. Change in main source of incomexS6. Change in ability to meet survival andlivelihoods protection thresholdsxS7. Expenditure patternsxS8. Change in household ownership of productiveassetsS9. Change in access to functioning marketsxS10. Change in availability of key commodities inmarketsS11. % of households by duration of staple foodstockxS12. Change in production compared to previousyear’s harvest by commodityS13. % of households/ communities unable to plantfor next seasonxS14. Change in herd sizesxS15: Number of reported animal disease outbreaksxS16: % households with suitable daily water andfodder consumption for livestockxS17: % individuals having daily access to anappropriate amount of safe waterxxS18: % households with capacity to prepare foodsafelyxS19: % households that have changed intrahousehold food distributionx5
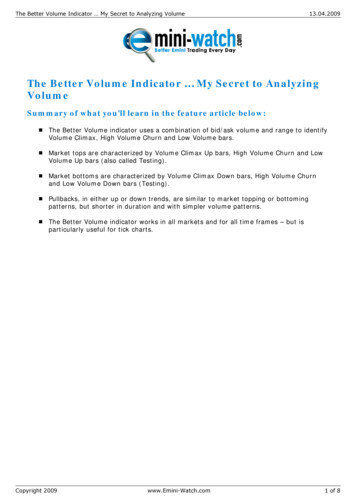
Disaggregation by:Output IndicatorsSex/ageO1: Number of beneficiaries receiving food, nonfood items, cash transfers and vouchers as % ofplannedxO2: Number of people trained as % of planned (e.g.best nutrition practice or land conservation etc.)xO3. Number of market system actors involved inemergency responsexSex of household headxO4: Number of institutional sites assisted (e.g.schools, health centres), as % of plannedO5: Quantity of food/value of cash/voucher received by beneficiary HH (and proportion in relation to food basket)xO6: Quantity of food assistance distributed, as % ofplannedO7: Total value of cash or vouchers for food andbasic needs distributed, as % of plannedO8: Frequency of food/cash assistance to beneficiary HH (months)xO9: Number of assets built, restored or maintainedto targeted beneficiaries, by type and unit of measure (e.g. hectares of land where conservation activities were implemented, length and type of irrigationsystems restored, hectares recovered for farming)O10: Number of beneficiaries receiving agriculturalinputs as % of planned beneficiariesO11: Germination rates/harvest quantities as % ofplannedO12: Quantity of input items distributed, as % ofplannedO13: Total value of cash and vouchers for livelihoodrecovery distributed to targeted beneficiaries as %of planned6xx
As per MIRA guidance, the IASC presents an approach to followduring each of the four phases in which an assessment is conductedand can be found in “Operational Guidance for Coordinated Assessments in Humanitarian Crises”: http:/www.humanitarianinfo.org/iasc. Determining if pre-crisis levels have been re-established for progress reporting purposes usually involved use of the indicator during IASC Phase 4. If pre-crisis data for the indicator does not exist then questionsshould be asked referring to the pre crisis situation 4 weeks prior tocrisis and the actual or post crisis situation. To avoid double-counting beneficiaries fed over multiple months orin different phases/components of an operation refer to WFP'sGuidance Note on Beneficiary Definition and Counting: cuments/manual guide proced/wfp110330.pdf The timing of assessment is very important as food consumption isstrongly affected by seasonality (baseline and progress should happen at similar time).7
Section 1:Situation Indicators8
FOOD ACCESSS1. Change in food consumption patternsDefinition: Cha n ge in fo od con s um ption pa tter n s is gen er a lly m ea s ur ed by tw oindicators: the Food Consumption Score (FCS) and Household Dietary Diversity Score [HDDS](either one of them or the two together). Frequency of meals can also be used as proxy for foodconsumption patterns. The FCS is a composite indicator that measures dietary diversity, foodfrequency and the relative nutritional importance of food groups based on a seven day recall offood consumed at household level. The HDDS is the simple sum of the number of food groupsconsumed at HH level based on a 24h recall (from 0 to 12).Rationale: B oth the FC S a n d HDDS a r e used a s pr oxy in dica tor s of hou seho ldaccess to food as studies have shown that an increase in dietary diversity is associated with socio economic status and household food security.The FCS is used to classify the observed population into three groups (with poor, borderlineand acceptable consumption).Reporting Purpose: Baseline Progress EvaluationBaseline: How ha v e food con su m ption pa tter n s c ha n g ed a s a r esu lt of t he cr isis?Progress: M ea su r in g r esu lts a ttr ibu ta bl e to pr oj ects tha t a im to im pr o v e a ccess tofood?Examples: The food consumption score indicator can also be reported as percentage of HH inpoor, borderline or acceptable categories as a proxy of food insecurity. The same goes for theHDDS where reporting can be done showing HH percentage by number of food groups theyconsume”Targeted IASC Phase: Phase 1 Phase 2 Phase 3 Phase 4Watch Out For! Both FCS and HDDS are designed to reflect household dietary diversity, on average, amongall members. It is possible that certain groups (i.e. people working far from home and eatingoutside) can have a different dietary pattern compared to the rest of the family members. In a large assessment it would be important to have disaggregation by urban and rural dataas these indicators behave differently in those settings.For details on methodology:Guidelines for measuring household and individual dietary 83e00.pdfFood consumption analysis: Calculation and use of the food consumption score in food securityanalysis: cuments/manual guide proced/wfp197216.pdf9
FOOD ACCESSS2. Change in food sourceDefinition: Cha n ge in % sha r e of so ur ces fo r o bta in in g food, w hich co uld in clu defood purchase, food production, borrowed food, food aid, gifts, barter or wild foods.Rationale: Food sources are very useful to define livelihood profiles and also to establish whichHHs are more/how affected by a given shock. (i.e. if prices increase HHs depending of foodpurchases would be more affected).Reporting Purpose: Baseline Progress EvaluationBaseline: How food s ou r ces ha v e c ha n g ed a s a r esu lt of t he cr isis?Progress: Ha s th e pr e -crises level been re-established?Examples: Indicate the % of food coming from the different sources; the indicator can also bedisaggregated by livelihood type”Targeted IASC Phase: Phase 1 Phase 2 Phase 3 Phase 4Watch Out For! Reliability and sustainability of food sources should be always considered. HHs relying onfood aid or gift could have a good food security profile at the time of the assessment buttheir food sources are not sustainable.For more details on methodology:Comprehensive Food Security & Vulnerability Analysis (CFSVA) Guidelines - First guidelines-first-edition10
FOOD ACCESSS3. % change in key food & non-food commodity pricesDefinition: Comparison between pre-crisis and actual prices of the main food and non-foodcommodities in the market. Commodity prices should be recorded at the appropriate trade level(e.g. retail level) and/or for relevant quantities and product qualities.Rationale: An increase or reduction in prices has a direct effect on the purchasing power of thepopulation and, consequently on their ability to consume or use commodities in their dailyactivities. Price changes can influence both the quality and/or quantity of commoditiesprocured.Reporting Purpose: Baseline Progress EvaluationBaseline: Impact of the crisis on food and non-food commodity prices.Progress: Ha v e pr e -crises prices been re-established?Targeted IASC Phase: Phase 1 Phase 2 Phase 3 Phase 4Watch Out For! Prices normally vary throughout a year due to seasonal patterns of the production cycle.Accounting for seasonality helps differentiating between normal seasonal price variationsand additional changes which can be considered abnormal, depending on the magnitude ofthose changes Price changes often reflect changes in the availability of the commodities in the market. Forexample, increasing prices can indicate a shortage or anticipated shortage (e.g. whenharvest prospects are low). Price changes can have opposite effects for different parts of the population. A priceincrease of rice, for instance, can be detrimental for net buyers (e.g. people who rely mostlyon labour to procure food), but beneficial for net sellers (i.e. rice producers). Food prices are monitored by several institutions at different levels (FAO, WFP, FEWSNETetc). It is important to check for longer term series in order to understand the impact (andmagnitude) of a crisis on prices.For mor
Definition: Comparison between pre-crisis and actual prices of the main food and non-food commodities in the market. Commodity prices should be recorded at the appropriate trade level