Transcription
UNIVERSITY OF CALIFORNIA, LOS ANGELESCivil & Environmental Engineering DepartmentENERGY-CONSERVATION IN FINE PORE DIFFUSERINSTALLATIONS IN ACTIVATED SLUDGE PROCESSES(Contract Number: 500-03-001)Final Report 2005-2007Lory Larson, project manager, Southern California Edison, Ex OfficioDiego Rosso, Postgraduate Researcher, UCLAShao-Yuan (Ben) Leu, Ph.D. Candidate, UCLAProf. Michael K. Stenstrom, Principal Investigator, UCLA1O:kc/08/26/03Final Report1500-03-001Southern California Edison
Legal NoticeThis report was prepared as a result of work sponsored by the California Energy Commission(Commission, Energy Commission). It does not necessarily represent the views of the Commission, itsemployees, or the State of California. The Commission, the State of California, its employees, contractors,and subcontractors make no warranty, express or implied, and assume no legal liability for the informationin this report; nor does any party represent that the use of this information will not infringe upon privatelyowned rights. This report has not been approved or disapproved by the Commission nor has theCommission passed upon the accuracy or adequacy of this information in this report.2O:kc/08/26/03Final Report2500-03-001Southern California Edison
AcknowledgementThe authors thank the California Energy Commission and Southern California Edison for thefinancial support.3O:kc/08/26/03Final Report3500-03-001Southern California Edison
Table of ContentsPreface1Executive Summary2Abstract31. Introduction41.1 Background and Overview41.2 Project Objectives51.3 Report Organization52. Project Approach62.1 La-scale protocol and experiment62.2 Design and Assembly of Filed Prototype72.3 Field experiments – 24 hour test82.4 Applications in California93. Project Outcomes103.1 Lab experiments103.1.1 Membrane cleaning experiment103.1.2 Lab-scale protocol123.2 Field experiments133.2.1 Results of 24-hour test133.2.2 Comparison of real-time data with long-term observation153.2.3 Energy expenditure163.2.4 Potential application – operation control for energy saving173.3 Automated monitoring system183.3.1 Field-scale prototype 1.0183.3.2 Field-scale prototype 2.0193.4 Tests of field–scale prototype223.4.1 Lab-scale tests223.4.2 Field experiments233.4.3 Hood-size analysis243.4.4 Remarks on air blowers and air distribution systems253.5 Application of off-gas tests in California274. Conclusions and Recommendations4O:kc/08/26/03Final Report294500-03-001Southern California Edison
PrefaceThe Public Interest Energy Research (PIER) Program supports public interest energy research and development thatwill help improve the quality of life in California by bringing environmentally safe, affordable, and reliable energyservices and products to the marketplace.The PIER Program, managed by the California Energy Commission (Commission), annually awards up to 62million to conduct the most promising public interest energy research by partnering with Research, Development,and Demonstration (RD&D) organizations, including individuals, businesses, utilities, and public or private researchinstitutions.PIER funding efforts are focused on the following six RD&D program areas: Buildings End-Use Energy Efficiency Industrial/Agricultural/Water End-Use Energy Efficiency Renewable Energy Environmentally-Preferred Advanced Generation Energy-Related Environmental Research Strategic Energy Research.What follows is the final report for the [Contract Name], 500-03-001, conducted by the University of California,Los Angeles. The report is entitled Energy-Conservation in Fine Pore Diffuser Installations in ActivatedSludge Processes. This project contributes to the [PIER Program Area] program.For more information on the PIER Program, please visit the Commission's Web site at:http://www.energy.ca.gov/research/index.html or contact the Commission's Publications Unit at 916-654-5200.5O:kc/08/26/03Final Report5500-03-001Southern California Edison
AbstractAeration is the most energy intensive unit operation in municipal wastewater treatment. To improveoxygen transfer rate, fine-pore diffusers have been wildly applied in aeration practice. However, duringoperation, this type of diffusers suffers from fouling and scaling problems, which rapid decline inperformance and significant increase in energy costs. Diffusers must be cleaned periodically to reduceenergy costs. The cleaning frequency of diffusers is site-specific, and is shown by the reduction of oxygentransfer efficiency (OTE) with time in operation. Off-gas testing, developed by Redmon et al., 1983, isthe only technique that can measure real-time oxygen transfer efficiency. The main reason that preventswide-scale installation of off-gas monitoring equipment in wastewater treatment plants is complexity andcost of operation. By using the classic instrument, at least two operators are required to conduct theanalysis. Therefore, this project developed a low-cost, easy-to-operate instrument to monitor OTE and toprovide guidance for calculating energy consumption and wastage. This instrument is auto-calibrated andits operation does not require trained experts. In addition, experiment results of real-time monitoring inseveral full-scale treatment plants were analyzed to demonstrate the benefits of cleaning and to predictcleaning frequency.6O:kc/08/26/03Final Report6500-03-001Southern California Edison
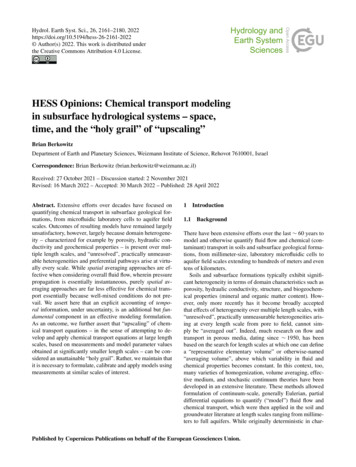
1.0 Introduction1.1 Background and OverviewAerobic bacterial processes are the most common technology for municipal wastewater treatment. Thistype of processes uses bacteria to consume/oxidize the organic pollutants in wastewater. Since themetabolism of bacteria highly depends on the accessibility of dissolved oxygen (DO) in the processingwater, aeration is generally the most essential and costly unit operation in a wastewater treatment plant.According to the California Energy Commission published report in 2005, the amount of energy used forwastewater treatment in California is 1,911 kWh/MG; and among this energy spends, around 45 to 75%(Rosso and Stenstrom, 2005), or approximately 1000kWh/MG, is used in aeration (background ofactivated sludge processes and aeration detailed in Appendix - section 1.0).Aeration systems are mainly full-floor configurations of fine-bubble diffusers, due to their favorableoxygen transfer rate (OTR, kgO2/hr) per unit energy required (i.e., kgO2/kWhneeded). The main pitfallof this aeration methodology is fouling/scaling, which causes a decrease in oxygen transfer efficiency(OTE, %) resulting in an increase in the energy cost per unit oxygen transferred (Rosso and Stenstrom,2006a). To quantify the decreasing of OTEs in processing conditions, several techniques were developed;and after 15-year’s investigation, American Society of Civil Engineers (ASCE) published StandardGuidelines for In-Process Oxygen Transfer Testing in 1997. The Guidelines recommended three types ofin-process water testing methods for diffused aeration system, which are 1) the non-steady method; 2)off-gas; and 3) the tracer racer method. Among these techniques, the major advance described by theStandard Guidelines is the off-gas analysis method, which was developed by Redmon et al (1983) underUS EPA and ASCE sponsorship.The off-gas technique uses an oxygen gas sensor to measure the oxygen mole fraction in the off-gas. Byremoving the carbon dioxide and water vapor from the off-gas, and assuming no change in nitrogenfraction, Redmon et al (1983) showed that the OTE could be calculated directly from the mole fractionmeasurements, and did not rely one volumetric gas flow rate.Figure 1 shows a schematic of a set-up to perform off-gas testing. A portable hood is floated on the liquidsurface and captures the gas bubbles that reach the surface. The gas flows through an analyzer thatmeasures total gas flow and the oxygen mole fraction of a small slip stream of the gas. Even though thetotal gas flow is not needed for OTE measurement, it is desirable to measure it, which is usually done bywithdrawing a measured flow that precisely balances the pressure under the hood (theory of off-gas testdetailed in Appendix - section 2.0).The main reason that prevents a wide-scale installation of off-gas monitoring equipment in wastewatertreatment plants is complexity and cost of operation. As mentioned, the set of equipments of a classicoff-gas test including the floating hood and off-gas analyzer requires at least two operators to conduct theanalysis. In addition, the classic off-gas analyzer requires sophisticated manual calibration to accessaccurate readings, thus a crew of trained experts were mandatory to the off-gas tests.7O:kc/08/26/03Final Report7500-03-001Southern California Edison
Figure 1. Off-gas test equipment schematic, showing hood, analyzer, DO meter and aeration tank.1.2 Project ObjectivesThe goal of this project is to develop a portable, light-weight and simple to operate oxygen transferefficiency monitoring device to help operators assess their aeration efficiency. To achieve this goalseveral objectives were performed: Develop and build lab-scale and field prototypes of OTE measuring devicesTest extensively the prototypes in wastewater treatment plants (WWTPs)Build and test small-scale capture hoodsDevelop a field testing protocol for operatorsVerify the economic saving of cleaning frequency for fine-pore diffusersCreate aerators’ cleaning/maintenance schedules and protocolsUtilize the OTE measurements for a process economic analysis1.3 Report Organization: /20078O:kc/08/26/03Final ReportYearly reportQuarterly reportQuarterly reportQuarterly reportQuarterly reportFinal report8500-03-001Southern California Edison
2.0 Project ApproachIn order to achieve the main goals of this project, following project approaches were accomplished bysteps. Motoring protocols were first assembled and tested in the laboratory, where the experimentconditions are well-controlled and the lab-scale devices are more sensitive and can provide referencevalues to test the apparatus. Based upon the lab-scale tests, bread-board version field-scale analyzers werebuilt. These prototypes were tested in the selected full-scale wastewater treatment plants of Northern andSouthern California.2.1 Lab-scale protocol and experimentThe lab-scale oxygen apparatus (shown in Figure 2) used in the lab-scale experiment is a full-featuredunit with precise and accurate measurements for a wide range of measuring scales, thus allowing finetuning, debugging, and sensitivity analysis. The laboratory analyzer because of its sophistication, is rathercostly. The portable, light-weight, and low cost fuel cell prototype unit to be used in the field will betested by this apparatus.The lab-scale protocol and experiment was set up as with the apparatus shown in Figure 3. A column 5-ftdeep with 7-in diameter was used as batch reactor and a fine-pore membrane, collected from full-scalesystem was used as the air diffuser. A DO probe was placed in the water and a capture hood covered thetop of the column. The hood collects and conveys the off-gas stream to an oxygen cell analyzer. Analogvoltage signals were produced by both the DO meter and the oxygen cell and recorded by a data logger.The experiment procedure basically follows the standard of clean water test published by ASCE, 2006.Sodium sulfite is used to scavenge dissolved oxygen according to the reaction:1CoCl2Na 2SO3 O 2 Na 2SO 42(1)Following the oxygen removal by oxidation of sodium sulfite which occurs almost instantaneously, theaeration device provides air to the batch system and oxygen continues to be consumed according to thestoichiometry in Eq.2, and when the excess sodium sulfite is completely converted into sulfate, thesystem experiences re-aeration. By analyzing the slope of the DO re-aeration curve or the oxygen fractionin the off-gas, the oxygen transfer coefficient kLa can be calculated.Figure 2. Lab-scale off-gas testing apparatus (Teledyne 9070 O2/CO2 analyzer) used in ourlaboratory.9O:kc/08/26/03Final Report9500-03-001Southern California Edison
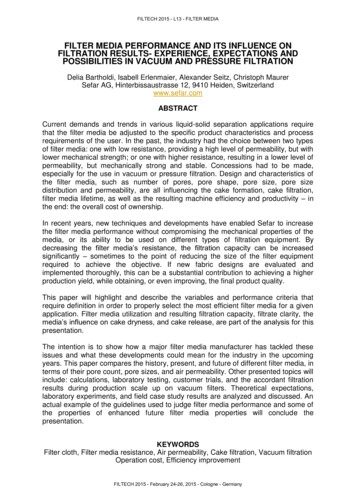
HoodAir outletOxygenanalyzer orfuel cellDO probeAerationcolumn5 ftDO meterRecorderDiffuserD/A converterAir pumpFigure 3. Schematic of a lab-scale off-gas testing apparatus2.2 Design and Assembly of Field PrototypeSeveral units of field prototypes were assembled for plant testing and consequent distribution. The fieldunit will be designed and packaged for plant installation, i.e. it will be smaller (about the size of ashoebox), of simple design, user-friendly, and low-cost ( 2,000). This apparatus will be able to measuredata in a narrower range than the lab-scale analyzer. The goal of the lab-scale system is to find and centerthe measuring range for the DO values to be used by the field unit within the ASP.Figure 4 shows the schematic of the automatic off-gas analyzer. This design incorporates the highestsimplification of off-gas measuring, hence maintains the measuring accuracy as the original device(Redmon et. al., 1986). A three-way valve controlled by a time-delay relay switches the connection intime-sequence from either the off-gas or the reference air into an O2 fuel cell, which the air flow is drivenby off-gas itself and a lab-scale vacuum pump (300 ml/min, or 2 in. Hg). The O2 fuel cell returns avoltage proportional to the O2 partial pressure in the gas stream. For each measuring event, reference airand off-gas are compared, which calibrates the instrument with each measurement. The off-gas flow rateis calculated by measuring the air velocity in the air hose and recorded for each measurement, to allow aflow-weighted average of the entire aeration tank. Our full-scale testing modules produced an aerationefficiency database, which complements our previous extensive off-gas experience (Rosso et al, 2005).10O:kc/08/26/03Final Report10500-03-001Southern California Edison
Figure 4. Schematic of the real-time automated off-gas analyzer. Key: 1) off-gas hose (fromcollection hood); 2) reference air intake; 3) 3-way valve; 4) time delay relay; 5) flow meter;6) oxygen fuel cell; 7) resistance; 8) differential manometer; 9) vacuum pump; 10) airvelocity meter. Solid lines are hydraulic lines, dashed lines are electrical connection2.3 Field experiments – 24 hour testField experiments were performed in a full-scale WWTP to illustrate the capability of real-time off-gasmonitoring and to test our field prototype. The volumetric flowrate of this plant is approximately10MGD. Figure 5 shows the schematic diagram of this plant and the testing hood positions. The plantcontains four process tanks (19 feet in depth), each with four small anoxic sections and two aerobicsections. Before secondary treatment, an extra basin equalizes the flow of primary effluent, and the MLEpumps to recycle the process water are equipped at the end of process tanks. Following the process tanksare two aerated polishing tanks (15 feet deep). The aerobic zones of process tanks and polishing tanksboth are equipped with a fine-pore, strip type diffuser system.Two 24-hour tests were performed using both the original (manual) and our bread-board field-scaleprototype unit. The first test was performed on the aeration tank 5 months after the diffusers wereinstalled and the second test was 8 months later, immediately after a cleaning process of diffusers. Bothresults were compared to a reference test performed 1 month later than the diffuser installation. The offgas hood positions were in the middle position of the two aerobic sections and the first section of thepolishing tank. The experiments measured the OTE, air flow, and off-gas temperature. Primary effluentsamples were collected hourly to calculate the pollutant load as rate of oxygen demand. The powerrequirement and the potential costs/benefits were calculated by the integrated total oxygen transferred,where the main assumptions are 0.15/kWh of power cost and the annual interest rate rocess tankPolishing tankMLE recycle: Hood positionsSludge recycleWastesludgeFigure 5. Schematic Diagram of the Nitrifying-Denitrifying Treatment Plant (headworks,primary clarifier, equalization basin and disinfection facilities not shown)11O:kc/08/26/03Final Report11500-03-001Southern California Edison
2.4 Applications in CaliforniaThe off-gas field testing apparatuses will be tested in selected WWTPs. Table 1 summarizes the list oflocations. Small (2x2’) capture hoods will be built and placed in situ for data gathering. The final hooddesign will most likely integrate the field-scale analyzer onto the top of the hood as one single compacttesting unit.Table 1. Testing locations.PlantLocationProcess layoutAeration equipmentCity of Los Angeles, Bureau ofSanitation, Glendale, CALos Angeles County SanitationDistricts, Whittier, CACentral Sanitary District, Martinez,CAConventional,NDN*9" membrane and ceramicdiscs9" membrane and ceramicdiscsPlug FlowConventional14" ceramic discsSOCWA RegionalPlantLaguna Niguel, CANDNParkson panelsSimi ValleyCity of Simi Valley, CANDNAerostrip panelsCity of Los Angeles,Van Nuys, CALos Angeles County SanitationDistricts, Whittier, CAConventional,NDNCeramic Domes and DiscsNDN9" membrane and ceramicdiscsRichmond, CANitrifying only7" Norton DomesProposed First Choice PlantsLA GlendaleWhittier NarrowsCentral Contra CostaNDNAlernatesTillmanSan Jose CreekWest County*: NDN – nitrification and denitrification12O:kc/08/26/03Final Report12500-03-001Southern California Edison
3.0 Project OutcomesIn this section, the results of lab experiments and field tests were presented in § 3.1 and § 3.2, respectively.The lab experiments include a membrane cleaning study and the test results of the lab-scale protocol. Themembrane test visualized and quantified the effects, and hence the importance, of diffuser cleaning. Fieldexperiments were preformed in the selected full-scale wastewater treatment plants. The results of these24-hour field tests were compared with our long-term observation (Rosso et al., 2005, 2006a, 2006b),which provided useful information to the development of our real-time monitoring system.In addition, economic analysis of aeration costs was performed as a case study based upon our fieldexperiments in the selected treatment plant. To clearly present the potential benefit of diffuser cleaning,energy savings was calculated and presented in total power and dollars. The design layout and field-scaleprototypes built were presented in § 3.3; and § 3.4 shows the results of lab- and field- scale tests of theseprototypes. In the final subsection § 3.5, several cases studies from full-scale WWTPs in California werepresented. The potential energy savings that could be provided by the monitoring technique wereperformed in actual numbers, such as unit wastewater treated and capital cost in California.3.1 Lab experiments3.1.1 Membrane cleaning experimentThis experiment was performed to illustrate the improvement of aeration performance after diffusercleaning. Figure 6 shows a half-cleaned diffuser. This diffuser was collected from a local treatment plantoperating at low mean cell residence time (MCRT). Before cleaning, the membrane was covered by alayer of biomass and living worms (left side). Then half of this diffuser was cleaned by manual scrapingand tap water rinsing. The result can be easily observed: totally different sizes of bubbles are producedfrom the same diffuser. Before cleaning, bubble diameters are about 4 mm, and reduced to 1-2 mm aftercleaning. Smaller bubbles provide a larger specific surface area and therefore higher transfer efficiency.BeforecleaningAftercleaningFigure 6. Photograph of a half-cleaned diffuser: before cleaned (left part of thediffuser) the diffuser was covered by a layer of biomass and the bubbles producedare big; after cleaned (right) the bubbles turn to smaller, similar to a new diffuser.13O:kc/08/26/03Final Report13500-03-001Southern California Edison
Clean water tests and dynamic wet pressure (DWP) tests were applied to confirm the former assumption.Same diffusers were tested before and after cleaning with tap water and acid. Figure 7 shows the resultsof this test. After cleaning, the gas transfer coefficient recovered significantly; acid cleaned diffusersrecover their efficiency values and approach new diffusers’ performance. DWP tests also show similarresults for headloss variations: uncleaned diffusers show a dramatic increase in headloss, while cleaneddiffusers maintain a more moderate increase (Figure 8). However, no significant difference was foundbetween cleaning methods. Acid cleaning may not be effective for opening bio-fouled pores but effectivefor removing inorganic scales formed on the pores before complete fouling.Gas transfer coefficient Kla (1/hr)10NewAcid cleanedWater cleanedBefore cleaned864200.40.60.81.01.21.41.6Flow rate (SCFM)Figure 7. Comparison of oxygen transfer efficiency of uncleaned, water cleaned,and acid cleaned diffusers14O:kc/08/26/03Final Report14500-03-001Southern California Edison
NewAcid cleanedWater cleanedBefore cleanedDWP (in. water)20151050.40.60.81.01.21.41.6Flow rate (SCFM)Figure 8. Comparison of headloss for uncleaned, water cleaned, and acidcleaned diffusers.3.1.2 Lab-scale protocolThe dynamic status of the DO and the off-gas oxygen fraction is shown in Figure 9. Same patterns of DOand off-gas oxygen fraction can be observed, showing that the oxygen in the water is first segregated andthen dissolved. In Figure 9, the first rapid decline of dissolved oxygen concentration corresponds to theaddition of sodium sulfite and cobalt chloride. After a steady-state plateau, where the excess sulfite isconverted to sulfate (Eq. 1), the DO concentration increases (re-aeration process).Tank depth shows the most significant effect in our sensitivity analyses. Using a 5-ft deep reactor, duringthe steady-state oxygen scavenging (pink plateau in the graph) the oxygen fraction in the off-gas is18.07% (green plateau in the graph). The difference between this value and the O2 ambient concentration(20.99%) is large enough to be accurately recorded. Previous experiences using a 2-ft deep tank showed adifference in O2 concentration between the off-gas and the ambient too small to be quantified. In a 2-fttank, bubbles require less than 1 second transporting from diffuser to water surface. The short retentiontime makes the difference of off-gas and ambient not measurable. This difference becomes obvious whenwater is deeper than 5 feet. Since the depth of aeration tanks are much larger than 5 feet, the difference ofoxygen concentration in influent air and off-gas is definitely measurable and serves well as an index ofoxygen transfer.15O:kc/08/26/03Final Report15500-03-001Southern California Edison
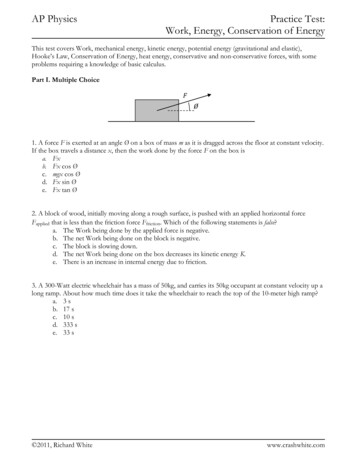
austion43102DO1Oxygen fraction05Oxygen fraction in bubbles(%)Dissolved oxygen (mg/L)90TimeFigure 9. Dynamic status of dissolved oxygen and oxygen fraction in off-gas of a cleanwater test.3.2 Field experiments3.2.1 Results of 24-hour testFigure 10 (a) shows the behavior of OTE compared to the air flow rate over a 24-hour cycle: when the airflow rate is at its maximum, OTE is at its minimum, and vice versa. The air flow rate is highest when theoxygen demand (i.e., the carbonaceous COD or C-COD) is highest, which is reflected in low OTE andlow alpha values. In addition, alpha-factors calculated from αSOTE (measured with the off-gastechnique) and manufacturer’s clean water data (SOTE) are shown in Figure10 (b). Although diurnalcycles of OTE measurements were reported previously (Libra et al., 2002), this is the first report of timeseries for alpha factors. The patterns of alpha and carbonaceous COD (C-COD) have analogous behavioras OTE vs. air flow rate (AFR). This result shows that the off-gas reading (OTE) carries valuableinformation on AFR and load. For a given load, the off-gas signal can be used as a feedback control toregulate AFR to its minimum possible value, yet achieving the same level of treatment, and to predict theinfluent load concentration.16O:kc/08/26/03Final Report16500-03-001Southern California Edison
(a)4540153530132511OTE from off-gas test20Air flow rate (1000m3/hour)OTE from off-gas test (%)17Air flow rate(b)5000.710:00 AM 2:00 PM 6:00 PM 10:00 PM 2:00 AM 6:00 AM 10:00 AM0.60.53002000.4Alpha factorCCOD (mg/L)4000.3CCODAlpha0.210:00 AM 2:00 PM 6:00 PM 10:00 PM 2:00 AM 6:00 AM 10:00 AMTimeFigure 10. (a) Oxygen transfer efficiency (OTE) and air flow rate calculated from off-gastesting during a 24-hr. (b) Carbonaceous COD (C-COD) and alpha-factor estimated fromoff-gas analysis, during the same period.17O:kc/08/26/03Final Report17500-03-001Southern California Edison
3.2.2 Comparison of real-time data with long-term observationFigure 11 shows the correlation between the alpha factor and air flux (air flow rate per unit of diffuserarea, m3·s-1·m-2). The results were calculated from three different experiments: one clean water test andtwo process-water off-gas tests. In both off-gas tests, the results of a short term 24-hour measurements ofαSOTE are negatively correlated with the air fluxes, which confirmed our previous long-term studies(Rosso et al., 2005). In addition, αSOTE is approximately half of the clean water SOTE (labels on thegraph). The process water αSOTE has different pattern for different time in operation: diffusers that havebeen in operation for a longer period without cleaning are fouled, which is shown by a more rapid declinein performance with increasing air flux (labelled “before cleaning” in Figure14).1REFERENCE - CLEAN WATERAFTER CLEANING21.2%20.7%20.5%21.7%0.522.0%19.3%α or αF20.3%18.1%16.2%16.1%0.414.6%Labels are αSOTE (%).Shaded areas are 85% confidence intervals.BEFORECLEANING13.1%0.3345678910103 air flux (m3s-1m-2)Figure 11. Correlation between standard oxygen transfer efficiency (SOTE) and diffuserair flux (curve zones represents 95% confidence, Leu et al., 2007).18O:kc/08/26/03Final Report18500-03-001Southern California Edison
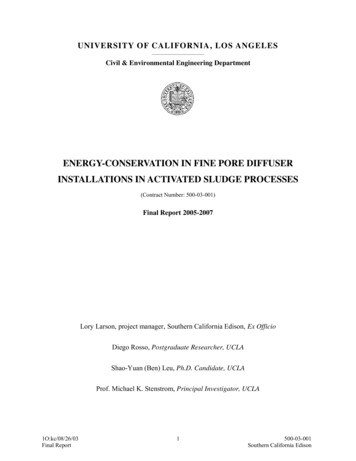
3.2.3 Energy expenditureTable 2 shows the aeration tank characteristics, the oxygen transfer data gathered from off-gas tests, andthe energy consumptions calculated with our plant-cost algorithm (Rosso and Stenstrom, 2006a). Ourresults suggest that the cleaning procedure improves oxygen transfer efficiency from 16.1% to 18.6%,thus reducing demand requirements from 235kW to 193kW, or corresponding energy costs from 850/day to 695/day (based on 0.15/kWh and 24 hours a day). Since the first test was performed 8 monthsbefore cleaning and the diffuser fouling could be more serious during this period, the actual total savingmust be greater than the number calculated.Table 2. Results of off-gas tests and energy cost estimationTestsResults or propertiesSection dimension (m2)BackgroundDepth (m)Number diffusers3 -1Air flow rate (m s )Test 0(Reference)Process Tank ( 4)Section 1Section 2PolishingTank ( 2)Total17.3 28.8 17.3 28.8 85.3 11.419695.85.84.5-71( 4)56( 4)127( 2)7621.490.870.38αSOTE (%)17.518.318.92.74-Power/OTR -0.130.120.440.153 -1Air flow rate (m s )Test 1αSOTE (%)(Before cleaning)Power/OTR (kWh/KgO2)3 -1Air flow rate (m s )Test 2αSOTE (%)(After cleaning)Power/OTR (kWh/KgO2)The results of the 24-hour tests confirm our long-term observation that alpha factor is affected by load ofcontaminants, and OTE is negatively correlated with air flow rate (Rosso et al., 2005); detailed discussionhas been shown in Leu et al., 2007. This paper further calculated the power costs of the experimentalWWTP. Based upon our former studies (Rosso et. al., 2005, 2006), it is suggested that the fine-porediffusers should be cleaned at least once per 1 to 2 years. Since diffuser fouling is a long-term processthat the increase of power consumption is described in monthly basis; the results of our hourlymeasurement were integrated to calculate the daily oxygen supplied and transferred.Figure 12 shows the total power consumption, the costs due to diffuser fouling, and the benefits gained bydiffuser cleaning. The gray zone represents the total power consumption, which is equal to the basicpower requirement (initial value, approximately 500kWh/million gallon wastewater treated in the figure)plus the power wasted due to diffuser fouling, and the dash line is the predicted value based on the currentobservations. The red bars represent the normalized costs of power wasted (e.g. annual cost in dollars permillion gallon wastewater transferred per person). The potential saving of diffuser cleaning can becalculated by accumulating the costs times the interest rates (blue bars). Therefore, if we compare thebenefit of cleaning to the cleaning costs, (e.g. tank drainage, diffuser replacement, and cleaning laborcosts), then it is conceivable that we can predict an optimized time frame for diffuser cleaning.19O:kc/08/26/03Final Report19500-03-001Southern California Edison
8008Total power (kWh/MG)6700460025000400Specific benifits of fouling/cleaning( USD / person / year)Aeration PowerCostBenifit-20Test 036Test 1912Diffuser Cleaning1518Test 2Time in operation (months)Figure 12. Energy expenditure of aeration cost. Total power consumption is calculated bythe off-gas test results, in which total power initial power power wasted. Costs andbenefits are calculated based upon the power wasted. The power cost is 0.15/kWh andthe results are normalized by million gallon wastewater treated and the population served(100,000 people).3.2.4 Potential application – operational control for energy savingIn addition to the long term diffuser fouling, the real-time off-gas test provides useful information forplant operation. Figure 13 shows the oxygen req
Based upon the lab-scale tests, bread-board version field-scale analyzers were built. These prototypes were tested in the selected full-scale wastewater treatment plants of Northern and Southern California. 2.1 Lab-scale protocol and experiment The lab-scale oxygen apparatus (shown in Figure 2) used in the lab-scale experiment is a full-featured