Transcription
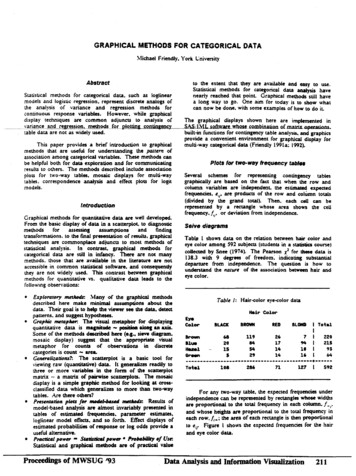
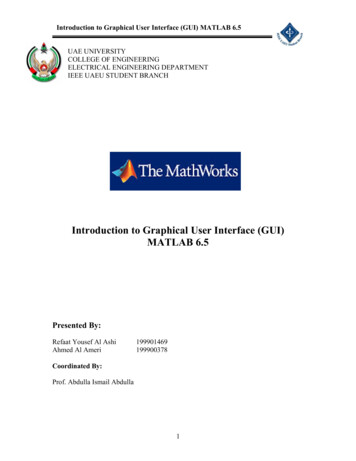
Part 2: Graphical Methods and Summary StatisticsMatthew Sperrin and Juhyun ParkSeptember 10, 20081IntroductionTable 1 gives the quarterly consumption of gas in the UK, for 16 years. Looking atthe table only, what can you learn from the data?Figure 1 shows exactly the same data in a graph, with the quarters plotted alongthe x axis and the gas consumption along the y axis.Exercise 1. Can you learn more about UK gas consumption from looking at the graphthan you can from the table? Is the graph or the table easier to interpret?Presenting data graphically can often help us to learn things from the data.Table 2 gives the birthweights (in grams) of 44 babies born in the Mater Mothers’Hospital in Brisbane, Queensland, Australia, on December 18, 1997.The average weight is 3276 grams.Exercise 2. What is the variable being measured here? Is it quantitative? If so, isit continuous or discrete?1Exercise 3. Suppose you are asked ‘Tell me about the birthweights of these babies’.What would you say?1See Part 1 for an introduction to these concepts.1
1. Introduction2YearQ1Q2Q3Q41301.0196.9 136.1 267.32317.0230.5 152.1 336.23371.4240.1 158.5 355.44449.9286.6 179.3 403.45491.5321.8 177.7 409.86593.9329.8 176.1 483.57584.3395.4 187.3 485.18669.2421.0 216.1 509.19827.7467.5 209.7 542.710840.5414.6 217.7 670.811848.5437.0 209.7 701.212925.3443.4 214.5 683.613917.3515.5 224.1 694.814989.4477.1 233.7 730.0151087.0 534.7 281.8 787.6161163.9 613.1 347.4 782.8Table 1: Quarterly gas consumption in the UK3837 3334 3554 3838 3625 2208 1745 2846 3166 3520 33803294 2576 3208 3521 3746 3523 2902 2635 3920 3690 34303480 3116 3428 3783 3345 3034 2184 3300 2383 3428 41623630 3406 3402 3500 3736 3370 2121 3150 3866 3542 3278Table 2: Birthweights of babies born in the Mater Mothers’ Hospital in Brisbane,Queensland, Australia, on December 18, 1997
312001. Introduction 1000 800 600 200 0 400Gas consumption 10 20 30 40 50 60Quarter NumberFigure 1: Gas consumptionThis illustrates the importance of summary statistics. It is often long-winded anduninformative to talk about everything in the data, so it is necessary to summarisethe important points. Graphical methods and summary statistics come under thejoint heading of exploratory data analysis.This part of the course has the following objectives:1. To introduce some basic graphical methods and summary statistics.2. To motivate which graphical methods/summary statistics are useful in certainsituations, and how to use them together sensibly.3. To extend the ideas to situations where we are interested in measuring twovariables.
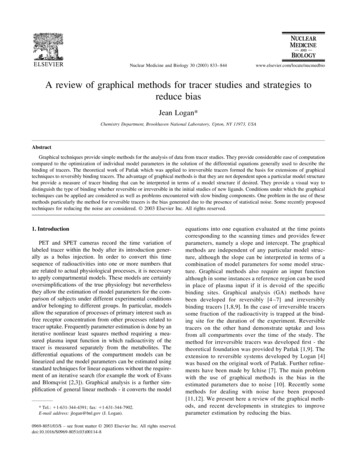
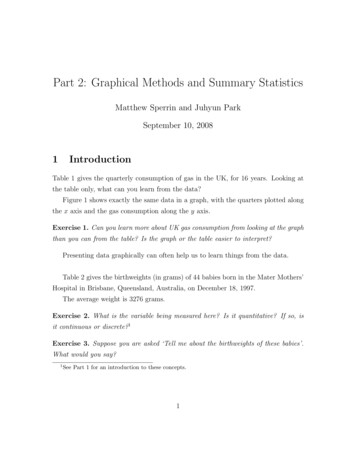
2. The Shape of the Distribution24The Shape of the DistributionIn this section we will introduce some of the graphical tools used to get an idea ofthe distribution of the data we are considering. By distribution we mean the shapeof the data. Having an idea of the shape allows us to answer questions such as: What are the largest and smallest values we would expect to see? Are we more likely to see data in a certain interval than we are in another?2.1HistogramsHistograms are a method of displaying quantitative data. The easiest way to describea histogram is to work through constructing one. We will use the birthweight datahere.1. We divide the range of the data into (equally) sized bins. Here, the lightest babyhas weight 1745 grams and the heaviest has weight 4162 grams. We will use 6bins: 1501-2000, 2001-2500, 2501-3000, 3001-3500, 3501-4000 and 4001-4500.2. Record the number of observations that fall into each bin. Here, we need todraw a frequency table, and tally the number of birthweights in each category.For example, the first weight listed in Table 2 is 3837 grams, so falls into thecategory ‘3501-4000’.BinNumber of 4000154001-450013. Plot on a graph. The x axis is the range of the data and the y axis is the numberof observations (count) in each bin. Figure 2 gives the final histogram.
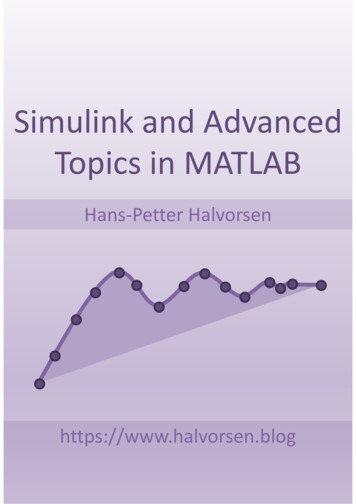
0004500Birthweight (grams)Figure 2: Histogram of BirthweightsExercise 4. What do you learn about the babies’ birthweights from this histogram?(Hint: Can we answer any of the questions from the beginning of this section?)Choosing the amount of bins to use is something of an art in producing histograms,and is often done by trial and error. Figure 3 gives two histograms, the first has twobins (each bin being 2000 grams wide), the second has 48 bins (each bin being 50grams wide).Exercise 5. Using Figures 2 and 3, comment on the consequences of making a poorchoice for the number of bins.You will find when you use statistical packages to produce histograms that anappropriate number of bins is selected automatically.
0FrequencyBirthweight (grams)20002500300035004000Birthweight (grams)Figure 3: Histogram of Birthweights — with 2 bins (top) and 48 bins (bottom).Exercise 6. Think back to the UK gas consumption example. What would be thelimitations in using a histogram to display this data?Exercise 7. Table 3 gives the areas of the 50 US states (in thousand square miles).Produce a histogram, with appropriate bin width, for this data. (Note: you may findit useful to exclude the largest state (663 thousand square miles) to produce a moreinteresting histogram). Interpret the results.Density HistogramsExercise 8. Suppose you take the names of all the babies born in the Mater Mothers’Hospital in Brisbane, Queensland, Australia, on December 18, 1997, put them in
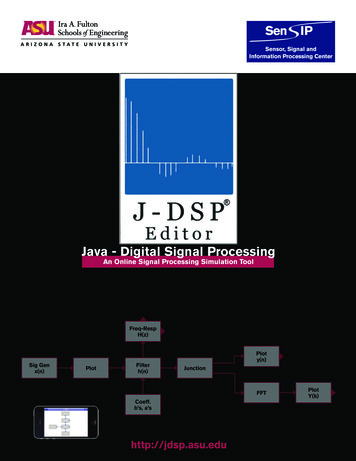
2.1Histograms272699101111122432 35364042434546485252 53545556585965667070 71717777828485879798 98 104 111 114 122 147 164 269 663Table 3: Area of the US states in thousand square milesa hat, and select one at random. What is the chance of the chosen baby havingbirthweight between 3001 and 3500 grams?In Figure 4 we have the same histogram, but this time we rescale the height ofthe bars so that the area of the bar in each bin represents the chance of a randomlychosen birthweight coming from that bin.How have we calculated this? The chance of a randomly chosen birthweight (or,in general, a randomly chosen observation) coming from a bin should beNumber of Observations in Bin.Total Number of ObservationsThe area of the bin is Height of bar Width of bar.So we want these to be equal, and this means thatHeight of Bar Number of Observations in BinWidth of bar Total Number of Observations(1)Exercise 9. Explain why the total area of all the bars in the new histogram is 1.This means that the height of a bar is the density for that particular range.You may recall from physics a definition of density as ‘mass per unit volume’. In thiscontext it means something similar: probability per measurement unit. In other words,the density at a value x grams tells us the chance of a randomly chosen birthweightbeing x grams (to the nearest gram).Bar ChartsYou are probably familiar with a method of displaying categorical data that is verysimilar to a histogram — the bar chart.A bar chart could be used, for example, to compare the amount of people in asample with different hair colours (this example was also used in Part 1). Suppose
200025003000350040004500Birthweight (grams)Figure 4: Density Histogram of Birthweightswe collect a sample of 100 people and record their hair colour. We record the resultsin a frequency table:Hair Colour Number of Obs.Black10Brown51Fair28Ginger3Other8
2.2The Most Common Class9A bar chart is then constructed from the frequency table in exactly the same wayas we did for the histogram. Figure 5 gives two possible bar charts we could constructfrom this frequency table.2The difference between the two is that we have changedthe order of the bars along the x axis.Exercise 10. Why doesn’t it make sense to change the order of the bars along the xaxis in a histogram?Figure 5: Two barcharts showing the sample proportions of 100 people’s hair colour.2.2The Most Common ClassWe now introduce our first summary statistic. The mode is ‘the most common class’ ofa variable. This is often something we may be interested in — for example, somebodymay want to know ‘what is the most common hair colour?’.We can see from Figure 5 that the most common hair colour is brown — we callthis the modal class. For a qualitative variable like this, the ‘most common class’becomes the ‘most common category’.There are also definitions for the mode for quantitative variables — both discreteand continuous. For discrete variables, we say the mode is the ‘most common number’.2Note though, it is usual to arrange the bars in descending height order (as in Figure 5, leftpanel).
3. Using Ordered Data10For continuous variables, the mode is the ‘most common bin’. As with the histogram,we can choose the size of the bins however we like. Using the same bins as thehistogram in Figure 2, we can see that the modal class for the birthweight data is3000-3500 grams.Exercise 11. Why do we not use the ‘most common number’ as the definition of themode for continuous data?3Using Ordered DataIn this section we will talk about both graphical methods and summary statisticsthat can be used on the data once it has been placed in numerical order.We first need to introduce some notation. Firstly, we choose a letter to denotethe variable we are measuring — X is a common choice. It is good practice to makeit clear what your variables mean, by writing at the beginning ‘let X denote [thevariable we are measuring]’. Instead of saying ‘the first observation from the data’we will simply write x1 (If we had chosen Y to denote the variable, this would bey1 ). The tenth observation is written as x10 , and so on. We call the total numberof observations in our dataset n, so the final observation is xn . For example, in thebirthweight data in Table 2, let X be the weights of the babies. Then, reading acrossthe first row we get x1 3837, x2 3334, x3 3554, . . . x4 4 3278, and n 44, asthere are 44 births recorded. We use a special notation if we have put the data inascending numerical order — the first observation (which is now the smallest) is calledx(1) , the second observation (so second smallest) is called x(2) , and so on, up to thelargest observation x(n) . Table 4 gives the birthweight data in ascending numericalorder. Looking at this we can see that x(1) 1745, x(2) 2121,. . ., and x(44) 4162.3.1Medians, Quartiles and PercentilesIn the introduction we pointed out that summary statistics can be useful to reportinformation about data in a concise and informative way. What sort of single numbersummaries of the data may be useful?
3.1Medians, Quartiles and Percentiles11The first one to come to mind would be that we need to get some idea of location.Exercise 12. If we were interested in the birthweight of babies, a first question maybe ‘what does a typical baby weigh?’ Suppose we have placed the 44 birthweightsin ascending numerical order. Which of the following values would best answer thequestion? x(2) — i.e. the 2nd smallest value? x(22) — a value somewhere around the middle? x(42) — one of the largest values?The median value of a collection of data is the ‘middle’ value when the data is innumerical order. We use the symbol xm for the median.We now work through the procedure of calculating the median, using the birthweight data as an example.1. Place the data in numerical order. This is done in Table 4.2. Take the total number of observations and add 1. So here, there are 44 observations, so adding 1 gives 45.3. Divide by 2 — call the result t. So t 45/2 22.5.4. If the result is a whole number the median is x(t) . Otherwise, the result is theaverage of the two numbers either side of t. We have t 22.5, not a wholenumber, so our answer is the average of x(22) and x(23) . So we getxm x(22) x(23)3402 3406 340422(2)So the median of the birthweight data is 3404 grams.In other words, a ‘typical baby’ weighs 3404 grams.Exercise 13. Why do we add 1 to the total number of observations before we divideby 2? HINT: you can get intuition by considering a data set with 3 observations (i.e.n 3).
3.1Medians, Quartiles and Percentiles12Exercise 14. In calculating the median, does it matter whether the data is arrangedin ascending or descending numerical order?Once we know the location of the data (e.g. how much the typical baby weighs),we may next be interested in how spread out the data is. In other words, for thebirthweight example, how much heavier than the median are ‘heavy’ babies and howmuch lighter than the median are ‘light’ babies? Can you see why the spread may bea useful thing to know?One way we may consider looking at the spread of the data would be the differencebetween the heaviest baby and the lightest baby — this is called the range, and inthe notation:Range x(n) x(1)(3)So, for the birthweight data, the lightest baby is x(1) 1745, and the heaviestbaby is x(n) 4162. So the range isRange x(n) x(1) 4162 1745 2417 grams(4)Exercise 15. Table 3 gives the areas of the 50 US states (in thousand square miles),in ascending numerical order. Calculate the range of this data. Why might the rangenot be a good description of the spread of the data in this case?Since the range can be so sensitive to outliers — values that are unusually largeor small — we consider a slightly different measure, called the Interquartile Range(IQR). The idea behind this is that we discard the smallest values and the largestvalues, then measure the range between what is left. The lower quartile (LQ) is the value that has one quarter of the data smaller,and three quarters of the data larger than it. Similarly, the upper quartile (UQ) is the value that has one quarter of the datalarger, and three quarters of the data smaller than it. The Interquartile Range (IQR) is the difference between the UQ and the LQ —IQR UQ LQ.
3.1Medians, Quartiles and Percentiles13As with the median, there are technicalities involved when the LQ and UQ lie‘in-between’ two data points. However, there is no agreement on what to do in thesecases. We suggest calculating the LQ as ‘the median of the lower half of the data’,and the UQ as ‘the median of the upper half of the data’. If there is an odd numberof data points, usual convention is to exclude the median from both calculations.As an example, we will now calculate the LQ, UQ and IQR for the birthweightdata.The LQ is the median of the first half of the data, i.e. the top two rows of Table4, or the first 22 observations. The total number of observations plus 1 is therefore23. Divide this by two and calling the answer t, gives t 11.5. So the result is theaverage of x(11) and x(12) ,LQ x(11) x(12)3116 3150 313322(5)The UQ is the median of the second half of the data, i.e. the bottom two rowsof Table 4, or observations 23 44, the last 22 observations The total number ofobservations plus 1 is therefore 23. Divide this by two to get t 11.5. So the resultis the average of the 11th and 12th observations in the second half of the data. Thisis NOT the same as x(11) and x(12) because they are in the first half of the data! Weadd 22 to tell us where to find the UQ because we didn’t use the first 22 observations.So 11.5 22 33.5, so the result is the average of x(33) and x(34) ,UQ x(33) x(34)3554 3625 3589.522(6)Now the IQR is simply the difference between the UQ and the LQ:IQR U Q LQ 3589.5 3133 456.5(7)At this point, we can return to our original question that we were trying to answerby calculating the spread of the data — how heavy are ‘heavy’ babies and how lightare ‘light’ babies? It remains somewhat subjective what we mean by light and heavy,but we could say the top quarter are ‘heavy’ and the bottom quarter are ‘light’. Weknow these quantities — they are just the UQ and the LQ. So, ‘heavy’ babies haveweight greater than 3589.5 grams, and ‘light’ babies have weight less than 3133 grams.
3.1Medians, Quartiles and Percentiles141745 2121 2184 2208 2383 2576 2635 2846 2902 3034 31163150 3166 3208 3278 3294 3300 3334 3345 3370 3380 34023406 3428 3428 3430 3480 3500 3520 3521 3523 3542 35543625 3630 3690 3736 3746 3783 3837 3838 3866 3920 4162Table 4: Birthweights of babies born in the Mater Mothers’ Hospital in Brisbane,Queensland, Australia, on December 18, 1997; in ascending numerical order.Exercise 16. Calculate the Median, LQ, UQ and IQR of the US state data. Table 3gives the data in ascending numerical order.Box PlotsThe median, quantiles and range can be summarised in a graphical format, whichcan be useful when comparing one sample against another. Firstly, the quantities canbe summarised in a so-called five number summary. This consists of five numbers —the smallest observation, the lower quartile, the median, the upper quartile and thelargest observation (in that order). For example, for the birthweight data we wouldwrite the five number summary as (1745, 3133, 3404, 3589.5, 4162).This summary can also be drawn in a box plot. To create a box plot, the x axis isthe range of the data (in this case, the weights of the babies). Draw a small verticalline at each of the five numbers from the five number summary, then connect theends of the line at the LQ to the lines at the UQ. Figure 6 gives the box plot for thebirthweight data.Exercise 17. Suppose that we also measure the weights of the babies born in another hospital on the same day. We calculate the five number summary, and it is(1935,3200,3305,3418,3980). Reproduce the boxplot for the original birthweight data,then add the boxplot for this data below it, on the same x scale. Use this to comparethe two sets of birthweights.
3.2Empirical Distribution Functions2000250030001535004000Figure 6: Boxplot of Birthweights3.2Empirical Distribution FunctionsThe histogram is very useful for estimating the chance of a randomly chosen observation being within a given region, or equivalently, the proportion of observationswithin that same region (see Section 2.1). However, we have already seen that thehistogram is limited in that it depends on the number of bins we choose to classifyour data into. In particular, if we are interested in, say, the chance of a randomobservation being less than a certain value, we will get different answers dependingon the bins we have chosen for the histogram.The empirical distribution function (e.d.f.), provides a graphical summary of theproportion of observations being less than any fixed value. Producing the e.d.f. doesnot require any subjective decisions (like choosing the number of bins in the histogram
3.2Empirical Distribution Functions16setting). Therefore, there is one unique e.d.f. for any collection of data. There is anadded bonus with the e.d.f. — we can read the median and quartiles from the graphquickly and easily, as we will see.We label the e.d.f. as a capital letter with a tilde (‘ ’) above it.The formula for the e.d.f. isF̃ (x) Number of observations smaller than xTotal number of observations(8)We will now work through the construction of the e.d.f. using the birthweightdata.1. We construct the graph using the ordered data (as in Table 4 for the birthweightdata). The x axis covers the range of the data (so you could use the same rangeas the histogram, for example), and the y axis gives the value of F̃ (x). Thegraph is built like a staircase, starting from the y value of 0, on the left of thesmallest observation on the x axis, and finishing at the y value of 1, on the rightof the largest observation on the x axis.2. Now, every time we encounter an observation, the y value goes up by one ‘step’.The amount we go up is n1 , with n number of observations, as usual. If thereare ‘ties’ (i.e. more than one observation with the same value), we take a biggerstep, whose size is n1 number of ties.3. The graph finishes when the y value reaches 1. If you run out of data beforereaching 1, or go past 1, you know you have made a mistake somewhere! Figure7 shows what the final e.d.f. for the birthweight data should look like.Ensure you understand why constructing the graph in this way gives the e.d.f.that is defined in Equation 8. Also ensure that you understand that, unlike withhistograms, there is no aspect of the e.d.f. that we can change to give a ‘different’graph for the same set of data.Exercise 18. Produce an e.d.f. for the US state data (Table 3).
Empirical Distribution Functions170.81.03.20.20.4Fn(x)0.6 0.0 1500 2000 2500 3000 35004000birthweightFigure 7: e.d.f. of BirthweightsReading the Median and Quantiles from the e.d.f.Recall that the median of a collection of data is the ‘middle value’. The e.d.f. isdefined in Equation 8 asF̃ (x) Number of observations smaller than xTotal number of observationsExercise 19. Explain why F̃ (xm ) 0.5, i.e. the value of the e.d.f. at the median is0.5.Since the value of the e.d.f. at the median is 0.5, we can easily read off an estimateof the median from our e.d.f. We do this by working backwards. As we know thatF̃ (xm ) 0.5, if we draw a line across from the y-axis at 0.5 to the e.d.f., reading
3.2Empirical Distribution Functions18off the corresponding x-value gives us the median. This process is illustrated in the0.81.0birthweight data in Figure 8, and we get an estimate for the median of around 3400.0.20.4Fn(x)0.6 0.0 15002000 2500 3000 35004000birthweightFigure 8: e.d.f. of BirthweightsExercise 20. Show that, in the same way, the value of the e.d.f. at the LQ and UQis 0.25 and 0.75 respectively. Use this to estimate from the e.d.f. in Figure 7 theLQ, UQ and IQR of the birthweight data. Compare with the estimates you alreadycalculated from the data, and explain why they may not be exactly the same.Exercise 21. Summarise the advantages and disadvantages of Empirical DistributionFunctions versus Histograms.
4. Moment Based Summary Statistics419Moment Based Summary StatisticsWe have met already in this course two location statistics — the mode and the median,and two spread statistic — the range and the IQR.4.1The Sample MeanExercise 22. Suppose a student receives the following marks in nine courses (placedin ascending numerical order). The University awards a first class degree to anystudent who earns 70% or more overall.35 40 42 56 70 70 71 73 73The exam board proposes that the overall degree classification is calculated basedon the median of the nine marks — here the median is 70, so the student is awardeda first class degree. Is this a fair result?An alternative location statistic to the median is the mean. The mean adds upall the observations, then divide by the amount of observations. There is a simpleintuition for this — imagine each observation represents a child, and the value of theobservation represents the number of sweets the child has. Adding up the observationcorresponds to the adult collecting all the sweets in, then dividing by the number ofobservations corresponds to sharing the sweets equally between the children.At this point, we are going to introduce some notation. The sample mean isdenoted by x̄ (say ‘x-bar’).3 So we could write the formula for the mean asx1 x2 . . . xn(9)nIn this formula, we have used ‘. . .’ to show that we have missed out all the middlex̄ terms, but you would of course fill these in when using the formula. There is a muchPnicer way to indicate a sum of observations than this, by using the symbol , whichliterally means ‘the sum of’.3It is x because X is the letter used to denote observations of the variable. If we had used Y , itwould be ȳ.
4.2The Variance and the Standard Deviation20So we can rewrite the formula for the mean asn1Xxix̄ n i 1We use the area below theP(10)sign to indicate where the sum starts from, and thearea above to indicate where the sum finishes. The i in this case is called an index.It changes its value from the smallest value in the sum to the largest value, goingthrough every whole number inbetween. Outside of the summation, it no longer hasany meaning.As an example, let’s calculate the mean of the birthweight data. Putting the datainto the formula we getn1X3837 3334 . . . 3278x̄ xi 3275.955n i 144(11)so the mean is approximately x̄ 3276.Exercise 23. Table 3 gives the areas of the 50 US states (in thousand square miles).The median of the areas is 57 thousand square miles, and the mean is 75.88 thousandsquare miles. Explain why the mean is larger than the median. Which of the meanand the median are more useful here?We have seen that great care should be taken in deciding whether to report locationas the mean or median. Which of the two is most appropriate to quote may dependon the shape of the distribution of the data, and what the location statistic is to beused for.4.2The Variance and the Standard DeviationJust as the mean is an alternative to the median that uses all of the data, there isalso an alternative to the IQR that uses all of the data.Exercise 24. Using the US state area data in Table 3, demonstrate why the IQR cannot be said to use all of the data.HINT: Think about changing the value of the largest state (currently 663) to 863.Would the IQR change?
4.2The Variance and the Standard Deviation21The sample variance is defined as the average squared distance from an observationto the sample mean. The ‘distance’ from an observation xi to the sample mean x̄ is(xi x̄). The ‘squaring’ removes any negative values here (e.g. if xi 3 but x̄ 5,then xi x̄ 2, but squaring this gives 4).We call the sample variance s2 , and the formula isn1Xs (xi x̄)2n i 12(12)There is a problem with the variance — because we have squared the (xi x̄)part, the variance is not in the same units as the observations. For example, if ourobservations were in metres, the variance would be in square metres! This makes thevariance difficult to interpret.The standard deviation remedies this problem by simply taking the square rootof the variance. It is denoted by s, and its formula is given byvu nu1 Xs t(xi x̄)2n i 1(13)If necessary, we can subscript by the letter of the variable, e.g. s2X and sX for thevariance and standard deviation of the variable X. It is useful to do this if we aredealing with more than one variable.As an indication of how the standard deviation describes spread in a dataset, Figure 9 gives four examples of histograms, on the same scale, and the sample standarddeviation in each case.As an example we will now calculate variance and standard deviation of the birthweight data, giving a step-by-step approach to doing the calculations.1. Produce a table with three columns — the original xi values, the xi x̄ values,and finally the (xi x̄)2 values.2. Total up the final column of the table and divide by the number of observations.This is the variance.3. Take the square root of the answer. This is the standard deviation.
4.2The Variance and the Standard DeviationStandard Deviation 1.6315510Frequency2010005Frequency30Standard Deviation 1.0622123456012345xStandard Deviation 0.29Standard Deviation 4560123456xFigure 9: Histograms of four datasets (each with 100 observations) and their associated standard deviations.These steps can be summarised for the birthweight data in the following table.We calculated earlier that x̄ 3276 grams. Construcing a table like this is alwaysuseful when calculating the variance and standard deviation by hand.
4.2The Variance and the Standard Deviation23xixi x̄(xi x̄)238373837 3276 5615162 31472133343334 3276 58582 33643554.3554 3276 278.2782 77284.327824Pn2 x̄) :11989186Variance (above line divided by n):272481.5i 1 (xiStandard Deviation (square root of variance):522So we conclude that the sample standard deviation of the birthweights is 522grams. We have omitted many lines in the table — it would be a good exercise tocheck that you can reproduce the table in full. These calculations are somewhat timeconsuming to do by hand. Most scientific calculators, and many computer packages,will do the calculation for you.The standard deviation can loosely be interpreted as ‘how far a typical observationis from the mean’.Exercise 25. Suppose you wish to hire a typing assistant. The number of pagestyped per day by Assistant A has mean 65 pages and standard deviation 3 pages.The number of pages typed per day by Assistant B has mean 75 pages and standarddeviation 20 pages. Which assistant is the most consistent? Which assistant would you expect to type the most pages over a week? If these were the two applicants for the job of typing assistant, which would youhire (assuming you know nothing else about them)?A small standard deviation means a high consistency or precisionExercise 26. Calculate the variance and standard deviation of the following US stateareas:44This is a subset of Table 3, to make the calculation more manageable.
5. The Relationship Between Two Variables2411 12 46 52 53 70 77 98 104 147Exercise 27. Is it possible for either the variance or the standard deviation to benegative?5The Relationship Between Two VariablesSo far in this part of the course, we have looked at graphical methods and summarystatistics for a single variable only. Can you think of situations where it may be ofinterest to look at the relationship between two variables?There has been much said about the supposed link between smoking and lungcancer. We have data available, from 44 US states, on two variables. Smoke: Number of cigarettes smoked (hundreds per person) in 1960. Lung: Deaths per 100 000 population from lung cancer.The data is given in Table 5.Looking at the table, can you see any relationship between the number of cigarettessmoked, and the rate of deaths from lung cancer?Clearly, this is difficult if not impossible to do.5.1Scatt
the important points. Graphical methods and summary statistics come under the joint heading of exploratory data analysis. This part of the course has the following objectives: 1. To introduce some basic graphical methods and summary statistics. 2. To motivate which graphical methods/summary statistics are useful in certain