Transcription
Part IC. M. BishopPATTERN RECOGNITIONAND MACHINE LEARNINGCHAPTER 8: GRAPHICAL MODELS
Probabilistic Graphical Models Graphical representation of a probabilistic model Each variable corresponds to a node in the graph Links in the graph denote probabilistic relations betweenvariablesBCS Summer School, Exeter, 2003Christopher M. Bishop
Why do we need graphical models? Graphs are an intuitive way of representing and visualising therelationships between many variables. (Examples: family trees,electric circuit diagrams, neural networks) A graph allows us to abstract out the conditional independencerelationships between the variables from the details of theirparametric forms. Thus we can ask questions like: “Is A dependenton B given that we know the value of C ?” just by looking at thegraph. Graphical models allow us to define general message-passingalgorithms that implement Bayesian inference efficiently. Thus wecan answer queries like “What is P(A C c)?” without enumeratingall settings of all variables in the model.Zoubin Ghahramani
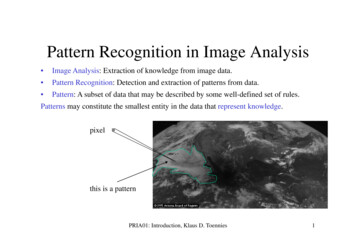
Three kinds of Graphical Modelsor Markov random fieldsconvenient forsolving inferenceproblemsuseful to express softconstraints betweenvariablesor Bayesian Networksuseful to express causalrelationships betweenvariablesimage by Zoubin Ghahramani
Bayesian NetworksDirected Acyclic Graph (DAG)Note: the left-hand side is symmetrical w/r to the variables whereas the righthand side is not.
Bayesian NetworksGeneralization to K variables: The associated graph is fully connected. The absence of links conveys important information.
Bayesian NetworksGeneral Factorization
Some Notations(1)Np( t , w ) p( w ) p(t n w )n 1More compactrepresentationPlate
Some Notations(2)Condition on dataShaded to indicate that the r.v. is set to its observed value
Generative ModelsCausal process for generating images
PPCAzn 2 xnWN
Discrete VariablesDenote the probability of observing both x1k 1 andx2 l 1 by , 1klklklGeneral joint distribution: K 2 { 1 parametersK statesp ( x1 , x 2 ) p ( x 2 x1 ) p ( x1 )K2-1parametersK -1parametersK -1parametersK states
Discrete VariablesIndependent joint distribution: 2(K { 1) parameters
Discrete VariablesGeneral joint distribution over M variables:KM { 1 parametersp ( x1 )p( x i x i 1 ) p( x i 1 ), i 2,., MM-node Markov chain: K { 1 (M { 1)K(K { 1)parametersReduce the number of parameters by dropping link in the graph, at theexpense of having a restricted class of distributions.
Conditional Independencea is independent of b given cEquivalentlyNotation
Conditional Independence: Example 1marginalize w.r.t ctail-to-tailas it doesn‟t factorize into p(a)p(b) ingeneral
Conditional Independence: Example 1tail-to-tail
Conditional Independence: Example 2head-to-tailmarginalize w.r.t c
Conditional Independence: Example 2head-to-tail
Conditional Independence: Example 3head-to-headmarginalize w.r.t cNote: this is the opposite of Example 1 and 2, with c unobserved.
Conditional Independence: Example 3head-to-headNote: this is the opposite of Example 1 and 2, with c observed.
“Am I out of fuel?”and henceB Battery (0 flat, 1 fully charged)F Fuel Tank (0 empty, 1 full)G Fuel Gauge Reading(0 empty, 1 full)
“Am I out of fuel?”Probability of an empty tank increased by observing G 0.
“Am I out of fuel?”the state of the fuel tank and that of thebattery have become dependent on eachother as a result of observing the readingon the fuel gauge.Probability of an empty tank reduced by observing B 0.This referred to as “explaining away”.
D-separation A, B, and C are non-intersecting subsets of nodes in adirected graph. A path from A to B is blocked if it contains a node such thateithera) the arrows on the path meet either head-to-tail or tailto-tail at the node, and the node is in the set C, orb) the arrows meet head-to-head at the node, andneither the node, nor any of its descendants, are in theset C. If all paths from A to B are blocked, A is said to be dseparated from B by C. If A is d-separated from B by C, the joint distribution overall variables in the graph satisfies.
D-separation: Example
D-separation: I.I.D. Data
The Markov Blanketdue to „explaining away‟ phenomenonMarkov Blanket (remaining factors) Parents and children of xi Co-parents: parents of children of xi
Factorization Properties
Cliques and Maximal CliquesCliqueMaximal CliqueThus, if {x1, x2, x3} is a maximal clique and we define anarbitrary function over this clique, then includinganother factor defined over a subset of these variableswould be redundant.
Joint DistributionNotations: C – max. clique,- the set of variables in that clique.whereis the potential over clique C, which is a non-negative functionwhich measures “compatibility” between settings of the variables.is the partition function (used for normalization).note: M K-state variables KM terms in Z.
Hammersley and Clifford Theorem UI: the set of distributions that are consistent with the set ofconditional independence statements read from the graph using graphseparation. UF: the set of distributions that can be expressed as a factorizationdescribed with respect to the maximal cliques. The Hammersley-Clifford theorem states that the sets UI and UF areidentical ifis strictly positive. In such casewhereis called an energy function, and the exponentialrepresentation is called the Boltzmann distribution.
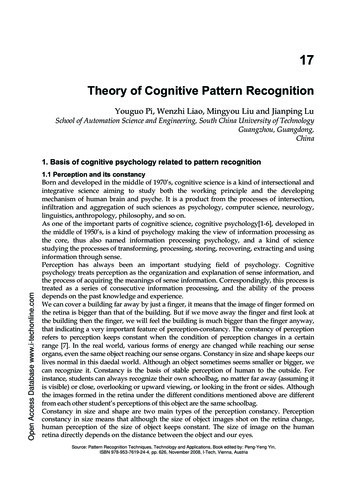
Illustration: Image De-Noising using MRFOriginal ImageNoisy ImageNoisy image is obtained by randomly flipping the sign of pixels in theNoise free image with some small probability.The Goal: Given Noisy image recover Noise Free Image
Markov Model strong correlation between xi and yi. neighbouring pixels xi and xj in an image arestrongly correlated.
Markov Modelbiasing the model towards pixelvalues that have one particularsign in preference to the other.
ICM - iterated conditional modesThe joint distributionhaving a high probability
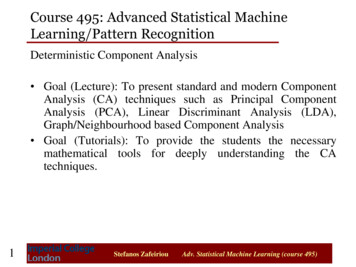
Illustration: Image De-Noising (3)Noisy ImageRestored Image (ICM)
Illustration: Image De-Noising (4)Restored Image (ICM)Restored Image (Graph cuts)
PATTERN RECOGNITION AND MACHINE LEARNING CHAPTER 8: GRAPHICAL MODELS Part I . BCS Summer School, Exeter, 2003 Christopher M. Bishop Probabilistic Graphical Models Graphical representation of a probabilistic model Each variable corresponds to a node in the graph