Transcription
Hierarchical Data Structuresfor Interactive VolumeVisualizationDavid M. WeinsteinChristopher R. JohnsonEmail: dweinste@cs. utah. edu andcrj@cs. utah. eduUUCS-95-012Department of Computer ScienceUniversity of UtahSalt Lake City, UT 84112 USAAugust 17, 1995AbstractIn order to interactively investigate large-scale 3D data sets, we propose an improvedhierarchical data structure for structured grids and an original hierarchical data structure for unstructured grids. These multi-tiered implementations allow the user tointeractively control both the local and global density of the mesh. Therefore, theuser can interactively refine areas of interest and decimate peripheral regions. Bycontrolling the density of the mesh throughout the volume, the user controls wherecomputational cycles are spent and gains a deeper insight into the geometric structureof the mesh.
1IntroductionComputational scientists and engineers are producing ever larger sets of volume data.While the specific application problems encountered by computational scientists varywidely across (as well as within) disciplines, the computational structure of the collected data varies remarkably little and is usually represented in the form of discreteapproximations of scalar and vector fields. In general, the scalar and vector field dataare measured or computationally simulated at discrete points throughout a volume.The main spatial variance among these volume data sets is typically characterized bywhether the grid is structured or unstructured. Interactively visualizing the geometrical structure of underlying models and simulation results for large-scale 3D problemson both structured and unstructured grids remains a significant challenge.Interactively visualizing models and simulation results presents both an aesthetic anda computational challenge. These challenges are especially important in visualizingdata on unstructured grids, when users often wish to view the mesh structure inorder to confirm mesh refinement within regions of high gradients. The aestheticelement of the visualization is important for more than merely aesthetic reasons: themere rendering of myriads of unstructured mesh elements on a 2D screen is generallynot informative. On the computational side, the time required to explore such largesolution spaces has traditionally been prohibitive to real-time interaction.The ability to perform mesh and volume visualization interactively affords the usera global, high-level view of the solution space and then allows her/him to probemore deeply in to selected areas of interest. This notion of "closing the loop" givesthe user more direct control of the calculations being performed. By employing a"computational steering" paradigm, the user is no longer required to wait for lengthycalculations to complete before seeing results. Instead, the user can guide the computation by feeding back parameter changes to the system based on initial, often partialresults from a larger calculation [14]. Integrating the user into the computational visualization process means faster convergence time for the user to achieve the desiredresults, and, ultimately, increased productivity.A variety of volume visualization techniques exist for probing 3D fields and vary basedon the type of field being queried (i.e. scalar, vector, tensor, or a combination ofthese), and the type of information being sought. Some examples of these techniquesinclude isosurface extraction, streamline tracing, and volume rendering. In this paper,we focus our attention on the isosurfacing algorithm, comparing performance times ofthis volume visualization methods implemented with and without our data structures.1
In addition to visualizing volumes, our data structures are used for interactively visualizing large-scale, unstructured meshes. For this challenge we focus solely on thenode locations and connectivities (i.e. the elements) of unstructured fields, independent of the values stored at those nodes. Scientists are interested in probing thestructure of meshes, because scientists have increasingly found that solution accuracyis inextricably tied to mesh discretization. For example, in the finite element (FE)method, the error across a tetrahedral element is often directly proportional to thegradient across that element. In order to reduce the total error in an FE solution,one can refine the mesh in the areas of high gradients, and the system can then bere-solved [1, 2, 3, 4J. As mesh element size decreases, the result is guaranteed toconverge to the analytic solution [4J. Unfortunately, the mesh refinement techniquesmost frequently used by scientists often yield widely varying densities within the support mesh, thereby creating wide discrepancies in the accuracy of the visualization.We have found, however, that by storing the mesh hierarchically, we can allow theuser to interactively refine and de-refine the mesh locally as well as through localregions of interest. We will show that this interaction greatly increases the clarity ofthe mesh and decreases the time associated with understanding the structure of themesh. Furthermore, we will compare, both quantitatively and qualitatively, our meshvisualization techniques with others currently in use.2BackgroundHistorically, a common method for interactively visualizing large volume data setshas been to operate on just a subset of the domain at a time. This reduction servestwo primary functions. First, it limits the amount of computation being performed,because the algorithm ignores areas outside of the reduced domain. Second, it reducesthe amount of "screen clutter" created when the results are rendered to the display.Examples of these types of domain reducing algorithms range from clipping planeand seeding algorithms [5J, to complete automatic refinement in regions containinginformation of interest [6J. Clipping planes and seeding algorithms localize the regionof operation and allow tight user control over the spatial domain. In contrast, completely automatic refinement limits the computational domain, but does not supporta means for interactively constraining where work is done spatially.2
2.1Structured GridsThe complete automatic refinement algorithm is an isosurfacing algorithm which wasintroduced by Wilhelm and Van Gelder in 1992 [6]. The strength of this algorithmcomes from its efficient use of octrees to store the volume data. The hierarchicalnature of octree space decomposition enables the algorithm to trivially reject largeportions of the domain, without having to query any part of the subtree within therejected region. The original octree data structure was proposed independently atapproximately the same time by Hunter et.al. [7], and has found application areas inmesh generation [8], modeling [9] and rendering [10], to name just a few. In Wilhelmand Van Gelder's implementation, their Branch-On-Need Octree (BONO) algorithmstores the maximum and minimum scalar values of the region spanned by each subtreein the region's parent node. The algorithm can then recursively traverse the tree,only isosurfacing those subtrees with ranges containing the value being sought. Theyreport overall speed-ups between 132% and 321 % when comparing their algorithm tothe marching cubes isosurface extraction algorithm [11]. In this paper, we presenta further extension to the octree data structure. Our extension allows the user tointeractively control the traversal depth within different regions of the tree. With thisimproved octree, the user can now interactively control how detailed the extractedisosurface will be locally within the domain, and can thus reduce the amount of timespent computing outside the area of interest.2.2Unstructured GridsThe second data structure we have implemented is a counterpart to the octree datastructure. This new structure applies data hierarchies to unstructured fields. Thisstructure has enabled us to address two difficult problems: unstructured mesh visualization and unstructured volume visualization. The first problem arises solely fromthe unstructured nature of the geometric mesh, and trying from the need to visualizethe structure of the grid elements in a way that is meaningful to the researcher. Forsmall meshes containing less than a couple of dozen elements, this problem does notbecome an issue. All of the elements can be rendered to the screen, and the user caninspect the mesh with little or no difficulty. But when the mesh expands to hundreds,thousands, or even millions of elements, simply rendering all of these cells no longerconveys practical information. Current research in this area has focused on methods to limit the domain of the mesh, operating on only a subsection of the volumeat a time. Examples of this type of method include clipping planes and seed/growalgorithms [5]. In the clipping planes algorithm, elements (or parts of elements) are3
displayed only if they fall within the volume created by the planes. The seed/growalgorithm allows the user to choose a seed element from the mesh and a depth parameter, and then renders all elements connected within that depth of the seed element.These algorithms are very useful for exploring small local regions of large meshes,but they fail to convey a sense of the global structure. The second difficult problemassociated with unstructured field visualization is that of how to interact with largefields using volume visualization algorithms. Here again it is possible to extract somesmaller subregion from the field, and accordingly to operate only on that local partition, but the same "tunnel-vision" problem is encountered here. The user sacrificesany global view of the problem, and is allowed to interact only with small subsectionsof the field at a time.In this paper, we propose a new hierarchical data structure for storing unstructuredfields. This new structure contains a range of resolutions of the original mesh, withlower levels of the hierarchy containing more refined representations. This implementation allows the user to interact with and visualize the entire domain at varyinglevels of resolution, and to move seamlessly between those levels for rapid explorationof the field.33.1MethodsOctreesWe have extended the original octree data structure to contain a "LEAF" bit at eachnode. This extension provides the user control over how deeply an algorithm willsearch a path of the octree for data. The construct works in this way: for everypath from the top of the octree to the bottom, exactly one of the visited nodes willhave a LEAF flag set. This new construct serves many applications. For example, auser isosurfacing a large field would often find it useful to get a general sense of thetopology of the surface through the field before generating the surface in full detail.In this way, the user can interactively isosurface even a very large field. Furthermore,the user can select a very fine discretization level (i.e. move the LEAF bits down inthe octree) in areas of determined interest, and select a lower discretization level (i.e.move the LEAF bits up in the octree) in areas that are not as critical. This gives theuser fine-tuned control over where the field operator (i.e. isosurfacing algorithm) isspending its compute time.4
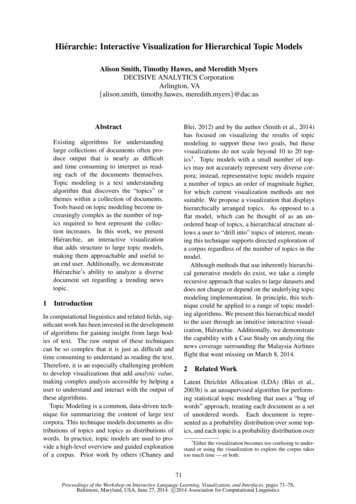
An attractive feature of this data structure is that algorithms such as isosurfacingneed not recompute in areas that have not changed as the user locally refines and derefines the structure. We can cache the isosurface portions generated through regionsand recompute them only when that region changes or when the threshold value ischanged. This allows the user to deeply probe local regions without spending timeto recompute old information.Several convenient methods have been added to the octree data structure to allowthe user to control the LEAF bits in the tree. These methods give the user the abilityto push all of the bits to the top, to push all of the bits to the bottom, to moveall of the bits up or down one level, and to move all of the bits in a specific regionup or down one level. All of these operators are implemented in such a way as tomaintain the integrity of the structure (i.e. there is always exactly one LEAF bit setalong any path in the tree). They are controlled via a simple user interface consistingof a cross-hair widget [12] and a set of TcljTk push-buttons [13]. Fig. 1 shows theSCIRun [14] visual programming map constructed for this algorithm. The cross-hairwidget can be interactively moved through the field to identify regions of the octree,and the buttons are linked to method callbacks which move the LEAF bits. All of theinteractions are very fast since they involve only testing and setting bits, but formallythe global operations are O( n), and the local operations are O(log n).There is some overhead associated with using an octree representation of a field asopposed to a generic 3D array. To build the Octree takes O( n log n) time, but thisstructure needs to be built only once and can then be stored as a persistent object.Accessing the value at a point in the field is slower with the augmented Octree, nowrequiring O(1og n) time, instead of just the constant time required to access a fieldvalue from an array or from an intelligently implemented non-augmented octree.Octrees can also be a memory liability if they are not stored correctly. Wilhelm andVan Gelder showed that efficiently implemented octrees can take up less that 15%of the memory required to store the field as a straight 3D array. However, becausewe store the eight corner values in each node, we fail to show savings in our memoryconsumption. Furthermore, memory overhead i::, required to store the LEAF bit ateach node, as well as to store all of the pointers to the children nodes. In the end,our structure requires approximately twice as much memory as the generic arraystructure. The final disadvantage we have found with utilizing the augmented octreedata structure is that the isosurfaces created across regions discretized to differentgrades can be geometrically discontinuous. These discontinuities are generally smalljumps across the disparate regions, but they are noticeable and should be mentioned,if for no other reason than to avoid confusion.5
Figure 1: SCIRun Visual Programming Map6
3.2M ultimeshOur solution to the problem of managing large unstructured fields for interactivevisualization is to break the original mesh into a hierarchy of sub-meshes which represent some increasing percentage of the original mesh. We call this data structure a"multimesh." A similar technique, detail elision (progressive refinement), has existedfor a long time in computer graphics for representing objects in a scene at differentlevels of detail based on their distance from the viewer. The seminal work on thistopic was conducted by Clark [15] and continues to be used today in progressive refinement for architectural walk-throughs and other interactive applications [16]. Forour multimesh data structure, the bottom level of the multimesh hierarchy containsthe original mesh, with all of its nodes and connectivities. Each level up contains asubset of the nodes on the level below and a new set of connections for those nodes.At the highest level there are just a few nodes left in the mesh. Once this datastructure has been generated from the original mesh, the user can interactively movebetween the levels of the hierarchy to visualize the mesh structure and field data.Effectively, the user now has multiple representations of the original mesh, each witha different number of nodes and elements. The coarsest representations might be usedfor gaining a global sense of the field, whereas more detailed levels would be useful forviewing the exact behavior of the mesh. Since the multi mesh is stored as an array ofindependent meshes, it is simple to extract a mesh from the hierarchy. Furthermore,it is possible to then pass the extracted mesh into a filter if the user wants to interactwith a localized region of the field.The major issues associated with constructing a multimesh data structure involvedeciding which subset of nodes will be contained in each higher level and determiningthe connections of those nodes. A simple solution is to decide on a "survival percentage" that indicates what percentage of the nodes on a given level will exist at thelevel above, and then randomly selecting enough nodes to fill that percentage. Thismethod has the attractive property that the mesh is evenly de-refined, or decimated,throughout. Areas that were very finely meshed to begin with maintain a proportionately high percentage of the nodes at every level, and the global structure of the mesh,though coarser, is maintained at all levels. For example, imagine we are given an unstructured mesh with 100,000 nodes, and are asked to create a multimesh hierarchywith a 50% survival percentage and 6 hierarchical levels. The resulting data structurewould contain an array of meshes, the sixth mesh containing all 100,000 nodes, thefifth containing approximately 50,000 nodes, the fourth approximately 25,000 nodes,the third approximately 12,500 nodes, the second approximately 6,250 nodes, andthe first approximately 3,125 nodes. All of these meshes will have similar node densities, and all will approximate the original mesh, but the variance in the number of7
nodes (and correspondingly the number of elements) from one level to another makesthe lower levels of the mesh interactive for volume visualization, whereas the originalmesh may not have been.We have improved on this method to allow the user to interactively select which areasof the mesh are comparatively more important, and to skew the node survival percentages such that important nodes have a greater chance of surviving to the next level.We have accomplished this by building an "importance weighting field" in 3-space,where each node can look up its importance based on its geometric location. The userinteractively places point sources into the scene and defines the "charge" and "fall-offrate" associated with each of these sources. If a source has a large positive chargeand a high fall-off rate, the nodes in its immediate vicinity have very high chancesof surviving to lower levels. Alternatively, a source with a small negative charge andlow fall-off rate can be placed in a region of the mesh which is less important, and thenodes in that region will be less likely to survive to lower levels. In this way the usergains local, as well as global control of the mesh decimation process, and the constructed multimesh will enable the user to more quickly understand the unstructuredfield. However, it turns out that it is desirable to make the system somewhat random,in order to remove a uniform sampling of the nodes. To accomplish this we associatea random weighting value with each node. In a non-random system, the nodes withthe lowest weightings would be removed at each higher level in the structure. In contrast, a completely random system would ignore the node weightings altogether andrandomly choose which nodes to remove. The compromise we implemented betweenthese extremes allows us to remove nodes based on a linear combination of a node'sactual weighting and it's random value. The linear combination is based on the chaosbias value b between 0 and 1, such that n b * r (1 - b) * w. When the chaos biasis 0 the node levels are completely dependent on the source charges in the scene, andwhen the chaos bias is 1 the node levels are determined completely randomly.There are generally two ways to build the mesh connectivities for each level of thehierarchy - top down, or bottom up. Bottom up construction requires first copyingthe existing mesh into the bottom level of the hierarchy, and then iteratively removingthe nodes and re-meshing as we construct higher levels. The difficulty raised is thatof how to re-mesh areas of the mesh when nodes are removed. Yu implemented analgorithm for local mesh derefinement [17], and his methods are very successful ifboundary nodes are never removed, the domain is convex, and the original mesh isDelaunay. However, as this is not always the case (especially with regard to theremoval of boundary nodes), we have implemented a top-down construction. For thisconstruction, we ignore the original mesh connectivities, and, adding nodes in orderof importance, construct the levels of the mesh from the top down. Each node isinserted via a Watson's style algorithm [18], and as a result remains Delaunay at all8
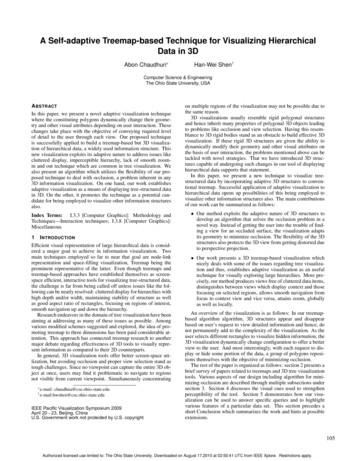
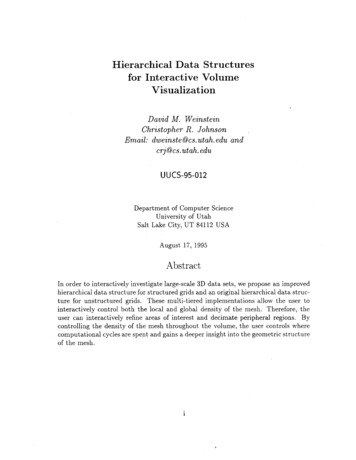
times. The top-down method is considerably faster than the bottom-up approach,requiring on the average O( n log n) time to build all levels of the multimesh.The multimesh data structure exploits the redundancy of nodes in multiple levelsof the hierarchy in two ways: by storing only one copy of each node, and by storing pointers rather than full node structures in each mesh. Unfortunately, there isnot a corresponding feature for connectivities, and each mesh in the hierarchy mustmaintain its own list of element connectivities. The space requirements for a multimesh depend very much on the depth of the hierarchy and the "global survival rate"parameters.The primary weakness of this method, as we have implemented it, is that withinthe use of the method non-Delaunay meshes are currently destroyed. We have nomechanism to account for or respect the topology of non-convex meshes. If a fast,reliable version of such a mechanism were found or developed, the above multimeshcreation algorithm could be easily rewritten in a bottom-up manner, and the resultingmeshes throughout the hierarchy would maintain the original non-Delaunay structure.This is an area for future work.4ResultsWe have applied our improved octree data structure to isosurface extraction of amagnetic resonance image (MRI) data set. The original scan is of a patient's headand contains 32 axial slices with 256 X 256 pixels per slice. We resampled this datato construct a 32 x 32 x 32 grid. We used this data set to explore our isosurfacingalgorithm. All of our timings were done on an Indigo2 Extreme with an R4400processor and 128MB of memory.We extracted an isosurface from the volume corresponding to the value of skin. Ouralgorithm required a set-up time of 3.54 seconds to construct the octree data structure. This set-up time is somewhat negligible though, since the octree only needs tobe computed once. We then applied the isosurfacing algorithm for different levels ofmesh refinement, and compared our results to those generated via a marching cubesstyle algorithm [11]. Marching cubes required 0.64 seconds to extract the isosurface.Wilhelm and Van Gelder's BONO algorithm [6] was somewhat faster, requiring only0.43 seconds to execute. The execution time for our algorithm varied linearly, depending on how deeply the mesh was discretized. The isosurface in Fig. 2 was generatedfrom the completely refined octree, and also required 0.43 seconds. As an example9
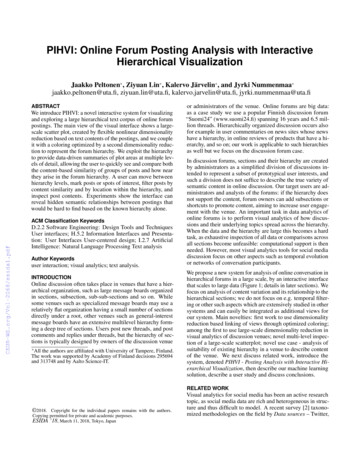
Figure 2: Fully Refined Octree Isosurfaceof locally de-refining peripheral regions of the mesh, we focus our attention on theside, front side of the head, and de-refine peripheral regions. We were able to reducethe isosurfacing time by nearly half, to 0.22 seconds, after locally de-refining the backhalf of the head as seen in Fig. 3. Further reducing the domain, we de-refine the leftside of the head, and are now able to isosurface the field in 0.12 seconds.Next , we applied the multimesh isosurfacing and mesh visualization algorithms to asimulated voltage field computed through the same cranial domain described above.We constructed this field by simulating the effect of a dipole source located in the rightfrontal lobe. The charge and orientation of the dipole were consistent with experimental neural activity recorded from epilepsy patients during seizures. To construct10
Figure 3: Half-Refined Octree Isosurface11
the anatomical domain for the simulation, the MRI data set was first segmented intodistinct material regions. These regions were then discretized into 137,923 nodes and884,343 tetrahedral elements, which form the support structure for the field. After themesh was constructed, Poisson's equation for electrical conduction was approximatedusing the FE method. This simulation results in scalar and vector values, which aresubsampled at 1000 nodes. We used this simulation data to test our multimesh visualization methods. The right, front side of the head is again chosen as the regionof interest, and we generate 7 levels of mesh refinement for our multimesh hierarchy.Isosurfacing the fully refined field required 0.82 seconds of CPU time, and the meshat this level is too dense to yield any insight to the viewer. Switching to a less refinedversion of the mesh, we are able to gain real intuition to the mesh structure, and toreduce our isosurfacing time to 0.12 seconds, with little change in the quality of thesurface.5ConclusionsThrough original and improved hierarchical data structures, we have been able tosubstantially improve the interactivity of mesh and volume visualization. These datastructures allow the user to identify regions of interest and then interact with thevisualization algorithms to constrain work to be done only in those regions.There are many opportunities to further improve the data structures that we haveimplemented. Specifically, we intend to implement Wilhelm and Van Gelder's octreearchitecture, which relies on maintaining full nodes at the bottom of the octree andpartial nodes at the top. This restructuring provides for fuller trees with ultimatelyfewer nodes. In addition, we would like to incorporate their hashing scheme forvisiting nodes during isosurfacing to further improve our performance.Based on the success we found applying our hierarchical data structures to isosurfaceextraction, we plan to extend these data structures to more volume visualizationtechniques. We intend to integrate both hierarchical data structures into streamlinetracing and volume rendering algorithms.12
6AcknowledgmentsThis work was supported in part by the Whitaker Foundation, the National ScienceFoundation and the National Institute of Health. The authors would like to thank S.Parker for his SciRun architecture, which provided the foundation for implementingthis research, and J. Purciful for his interactive 3D widgets. We would also like tothank K. Coles and J. Schmidt for their helpful comments and suggestions. Furthermore, we appreciate access to facilities which are part of the NSF STC for ComputerGraphics and Scientific Visualization.References[1] M. Ainsworth and J. T. Oden. A procedure for a posteriori error estimation forh-p finite element methods. Comput. Methods Appl. Mech. Engrg., 101:73, 1992.[2] C. Johnson and P. Hansbo. Adaptive finite element methods in computationalmechanics. Comput. Methods Appl. Mech. Engrg., 101:143, 1992.[3] C.R. Johnson and R.S. Macleod. Nonuniform spacial mesh adaption usmg apoteriori error estimates: applications to forward and inverse problems. AppliedNumerical Mathematics, 14:311-326, 1994.[4] O. C. Zienkiewicz and J. Z. Zhu. A simple error estimator and adaptive procedurefor pratical engineering analysis. Int. J. Numer. Method Engrg., 24:337, 1987.[5] C.S. Gitlin and C.R. Johnson. Techniques for visualizing 3d unstructured meshes.University of Utah Technical Report, UUCS-94-018, 1994.[6] J. Wilhelms and A. Van Gelder. Octrees for faster isosurface generation. ACMTransactions on Graphics, 11(3):201-227, 1992.[7] J. Foley, A. van Dam, S. Feiner, and J. Hughes. Computer Graphics Principlesand Practice. Addison-Wesley, 1990.[8] M.S. Shephard and M.K. Georges. Automatic three-dimensional mesh generationby the fintite octree technique. International Journal for Numerical Methods inEngineering, 32:709-749, 1991.[9] G.M. Hunter. Efficient Computation and Data Structures for Graphics. PhDthesis, Princeton University, Princeton, NJ, 1978.13
[10] 1. Doctor and J. Torborg. Display techniques for octree-encoded objects. IEEEComp Graph (3 Applic, 1(1):29-38, 1981.[11] W.E. Lorensen and H.E. Cline. Marching cubes: A high resolution 3d surfaceconstruction algorithm. Computer Graphics, 21(4):163-169, 1987.[12] J. T. Purciful. Three-dimensional widgets for scientific visualization and animation. Master's thesis, University of Utah, 1995. (to be submitted).[13] J.K. Ousterhout. Tel and the Tk Toolkit. Addison-Wesley, 1994.[14] C.R. Johnson and S.G. Parker. A computational steering model applied to problems in medicine. In Supercomputing 194, pages 540-549. IEEE Press, 1994.[15] J. Clark. Hierarchical geometric models for visible surface algorithms. Communications of the ACM, 19(10):547-554, 1976.[16] T.A. Funkhouser and C.H. Sequin. Adaptive display algorithm for interactiveframe rates during visualization of complex virtual environments. In ACM SIGGRAPH Computer Graphics, pages 247-254. IEEE Press, 1993.[17] F. Yu and C.R. Johnson. An automatic adaptive refinement and derefinementmethod. In Proceedings of the 14th IMACS World Congress, 1994.[18] D.F. Watson. Computing the n-dimensional dealunay tesselation with applications to voronoi polytopes. Computer Journal, 24(2):167-172, 1981.14
The second data structure we have implemented is a counterpart to the octree data structure. This new structure applies data hierarchies to unstructured fields. This structure has enabled us to address two difficult problems: unstructured mesh visu alization and unstructured volume visualization. The first problem arises solely from