Transcription
PIHVI: Online Forum Posting Analysis with InteractiveHierarchical VisualizationJaakko Peltonen , Ziyuan Lin , Kalervo Järvelin , and Jyrki Nummenmaa jaakko.peltonen@uta.fi, ziyuan.lin@uta.fi, kalervo.jarvelin@uta.fi, jyrki.nummenmaa@uta.fiABSTRACTWe introduce PIHVI: a novel interactive system for visualizingand exploring a large hierarchical text corpus of online forumpostings. The main view of the visual interface shows a largescale scatter plot, created by flexible nonlinear dimensionalityreduction based on text contents of the postings, and we coupleit with a coloring optimized by a second dimensionality reduction to represent the forum hierarchy. We exploit the hierarchyto provide data-driven summaries of plot areas at multiple levels of detail, allowing the user to quickly see and compare boththe content-based similarity of groups of posts and how nearthey arise in the forum hierarchy. A user can move betweenhierarchy levels, mark posts or spots of interest, filter posts bycontent similarity and by location within the hierarchy, andinspect post contents. Experiments show the interface canreveal hidden semantic relationships between postings thatwould be hard to find based on the known hierarchy alone.ACM Classification KeywordsD.2.2 Software Engineering: Design Tools and TechniquesUser interfaces; H.5.2 Information Interfaces and Presentation: User Interfaces User-centered design; I.2.7 ArtificialIntelligence: Natural Language Processing Text analysisAuthor Keywordsuser interaction; visual analytics; text analysis.INTRODUCTIONOnline discussion often takes place in venues that have a hierarchical organization, such as large message boards organizedin sections, subsection, sub-sub-sections and so on. Whilesome venues such as specialized message boards may use arelatively flat organization having a small number of sectionsdirectly under a root, other venues such as general-interestmessage boards have an extensive multilevel hierarchy forming a deep tree of sections. Users post new threads, and postcomments and replies under threads, but the hierarchy of sections is typically designed by owners of the discussion venue* All the authors are affiliated with University of Tampere, Finland.The work was supported by Academy of Finland decisions 295694and 313748 and by Aalto Science-IT.or administrators of the venue. Online forums are big data:as a case study we use a popular Finnish discussion forum“Suomi24” (www.suomi24.fi) spanning 16 years and 6.5 million threads. Hierarchically organized discussion occurs alsofor example in user commentaries on news sites whose newshave a hierarchy, in online reviews of products that have a hierarchy, and so on; our work is applicable to such hierarchiesas well but we focus on the discussion forum case.In discussion forums, sections and their hierarchy are createdby administrators as a simplified division of discussions intended to represent a subset of prototypical user interests, andsuch a division does not suffice to describe the true variety ofsemantic content in online discussion. Our target users are administrators and analysts of the forums: if the hierarchy doesnot support the content, forum owners can add subsections orshortcuts to promote content, aiming to increase user engagement with the venue. An important task in data analytics ofonline forums is to perform visual analytics of how discussions and their underlying topics spread across the hierarchy.When the data and the hierarchy are large this becomes a hardtask, as exhaustive inspection of all data or comparisons acrossall sections become unfeasible: computational support is thenneeded. However, most visual analytics tools for social mediadiscussion focus on other aspects such as temporal evolutionor networks of conversation participants.We propose a new system for analysis of online conversation inhierarchical forums in a large scale, by an interactive interfacethat scales to large data (Figure 1; details in later sections). Wefocus on analysis of content variation and its relationship to thehierarchical sections; we do not focus on e.g. temporal filtering or other such aspects which are extensively studied in othersystems and can easily be integrated as additional views forour system. Main novelties: first work to use dimensionalityreduction based linking of views through optimized coloring;among the first to use large-scale dimensionality reduction invisual analytics of discussion venues; novel multi-level inspection of a large-scale scatterplot; novel use case - analysis ofsuitability of existing hierarchy in a venue to describe contentof the venue. We next discuss related work, introduce thesystem, denoted PIHVI - Posting Analysis with Interactive Hierarchical Visualization, then describe our machine learningsolution, describe a user study and discuss conclusions.RELATED WORK 2018. Copyright for the individual papers remains with the authors.Copying permitted for private and academic purposes.ESIDA ’18, March 11, 2018, Tokyo, JapanVisual analytics for social media has been an active researchtopic, as social media data are rich and heterogeneous in structure and thus difficult to model. A recent survey [2] taxonomized methodologies on the field by Data sources – Twitter,
Facebook, blogs, online forums, etc.; Entities of data – network, geographic information, or text content; Goal of visualization – pattern extraction, visual monitor, anomaly detection,etc.; Visualization techniques – scatter plots, trees, node-linkdiagrams, flows, etc.; Target users – general public or analysts;Applications – journalism, politics, finance, sports, advertisements, etc. Our PIHVI system can be categorized as usinginteractive hierarchical scatter plots to analyze text content ofgeneral online forums for analysts, with the goals of extractinginteresting patterns of threads, detecting outliers of threadslike spam or novel topics, and advertising, to name a few. Below we summarize related work on using other visualizationtechniques to analyze aspects of online discussions.Semantic features of threads in online forums. Bag-ofword (BoW) vectors like TF-IDF are typical to represent textcontent for analysis [9, 13]. Topic facets to extract sentencelevel sub-topics are considered [6], The facets are shown toreflect programming concepts for questions in programmingdiscussion forums, visualized in a prototypical system. Analternative hierarchical semantic model for sentences incorporating discrete Fourier transform with a mixture of topicmodels was proposed [4]. In this first publication on PIHVI,we focus on the main goal of studying content relationshipsto the known hierarchy within the venue, and in order not tomuddle that focus we use simple BoW-based features whichalready work well in capturing thread similarities in our experiments. Other derived features like topical features are possible,the rest of our method works for any choice of features.Showing posts from individual threads. In PIHVI, we emphasize exploration based on the content-based hierarchicalscatter plot and the related tasks, thus we use a simple detailview showing plain texts from selected threads. However, weare aware of works that visually display thread content. Thisline of research usually focuses on visualizing the structureof the thread under inspection. For example, thread structurescan be encoded with indented rectangles [3], where each indentation corresponds to one level of nested reply to a post.Such thread visualization is orthogonal to PIHVI novelties andcan be easily integrated into PIHVI.Dimensionality reduction in visual analytics. Dimensionality reduction has been brought into the pipeline of visualanalytics by providing a 2D representation of threads, to helpusers to gain an overview. It is related to semantic feature construction discussed above, if obtained features are given to dimensionality reduction algorithms. For example, t-distributedStochastic Neighbor Embedding (t-SNE) [7] has been considered [16]. In PIHVI, we build our hierarchical explorationfunctionality on top of a t-SNE based embedding. See Section4 for details. Another branch of studies in this line is to let auser personalize the representation by interaction. See, e.g.,our work in [11, 10, 12] and references in [14]. We point outthe novel goal of PIHVI is to study relationships of large-scalecontent to a large-scale hierarchy, hence the novelty is in incorporation of the hierarchy into the content visualization andin hierarchical exploration of content through multiple views.Forum analysis system combined with different visual analytics. There have been integrated systems with views ofvarious visual analytics for inspecting online forums. Simple text search does not suffice when users aim to broadlycomprehend the information space with multiple exploratorysearches and information needs [17]. For example, a set ofvisualization designs showing different aspects from MOOCforums, including posts, users, and threads at different scalesis considered, with an aim to support online education with theforums [5]. A recent work [19] focuses on revealing anomalous information spreading occurring in social media along thetime-line with coordinated views, which particularly containsa scatter plot of threads created from Multidimensional scaling(MDS) [1] without the hierarchical functionality. We provideviews that help gain comprehensive understanding of ongoingdiscussion and how it relates to a multi-level hierarchy of thewhole discussion venue, rather than on relationships withinindividual threads; moreover our focus is on mostly anonymous discussion where most users are unregistered so user oruser-group views are less useful.OVERVIEW OF THE SYSTEM: PIHVI - POSTING ANALYSISWITH INTERACTIVE HIERARCHICAL VISUALIZATIONWe now describe the proposed system PIHVI - Posting Analysis with Interactive Hierarchical Visualization, on an overviewlevel, describing the design principles and how the systemoperates. In the next section we describe how the system isimplemented through dimensionality reduction methods.Design Principles. The design principles of the PIHVI system are: 1. The system should illustrate, in a compact way,the overall variety of discussion over the online forum, bothin terms of semantic content, and the hierarchical variety ofdiscussion sections where threads can be posted. This answersthe question: “Which kinds of topics are users discussing,and in which sections is the discussion happening?” 2. Thesystem should let analysts efficiently browse semantic contentof threads across the forum, on an overall level of trends andon more detailed levels of individual thread groups, withoutrestricting browsing to boundaries of specified sections. Thisanswers the question: “Which discussion trends are individualthreads of interest related to?” 3. The system should compactlyshow relationships of threads in terms of semantic content andposition in the hierarchy. This answers the question: “Whatother similar threads exist for a thread of interest?”The above design principles should hold even when the number of threads, the number of sections in the hierarchy, and thedepth of the hierarchy, all become large. The resulting systemfor visual analytics should support key tasks in Shneiderman’s[15] taxonomy of tasks for information visualizations, including the visual information seeking mantra overview first, zoomand filter, details on demand, and relate.System Components. Following the design principles in Section 3, we devise the following components for large-scaleinteractive analysis on hierarchical forum posts, and to supportour user tasks in PIHVI. Screen shots of the system are shownin Figure 1. The system has five linked views, where views1-3 below are always shown and 4-5 are on demand:1. Content-based map: An interactive scatter plot of the entire collection of threads from the online forum, which canbe zoomed to several detail levels. The map shows a spatial
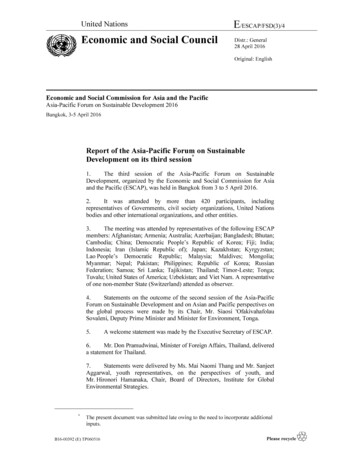
Figure 1: The PIHVI interface. Top: the initial state, wherethe content-view zoomed out to show an overview of the entirethread collection. Middle: section-filtering state. An analystselects a subset of sections in the section panel, circles ofcorresponding sections are then highlighted. Bottom: zoomedin state for an analyst exploring a cluster of hearing-relatedthreads from different sections across the forum; the analysthas selected a group of threads with a bounding box and isviewing their titles and content of an example thread.organization of threads by content similarity: similar threadsare shown nearby. The map is created by machine learningbased dimensionality reduction. The map is overlaid withcolors representing sections and their similarity, again createdby dimensionality reduction. At detailed zoom levels, eachthread is shown as a dot, and colors of the dots indicate thesection of the threads. At less detailed zoom levels, groups ofthreads are shown as dots with diameters scaling with the numbers of threads in the groups, and colors of the dots indicate adominating common parent section of threads in the group, asdetailed later. We draw the different-sized dots with moderatetransparency, yielding color blending when there are overlapsbetween the dots, which approximates the content and sec-tion distributions: higher opacity reflects a higher density ofthreads and vice versa; color mixing suggests mixtures of dominating sections sharing similar content. Both patterns mayinterest a forum analyst/administrator. For interactivity, eachdot, from different zoom levels, can be inspected by clickingto show a pop-up: the pop-up may contain either the threadtitle and the name of its section, if the dot represents a singlethread, or the name of the dominating common parent section,if the dot represent a group of threads. To avoid occlusions ofmultiple pop-ups, the analyst can bring a pop-up to front orback by clicking or dragging it; also, when a pop-up is mouseovered, the remaining pop-ups without the cursor hovered willturn half-transparent. Buttons on this view allow the analystto drag a rectangle over an area of the map: all threads in thearea will be described in the Threads and Sections panel.2. Thumbnail view of the map: This view shows the entirecollection and a rectangle denoting which portion of the mapan analyst is currently viewing; this lets the analyst maintainfocus and context while browsing the collection.3. Thumbnail view of the thread hierarchy: This view showsa radial plot of the tree hierarchy of discussion sections, andshows how optimized colors of the sections vary across thehierarchy. Due to space constraint, showing all 2434 sectionnames at once is not feasible: we show section names on demand when the analyst mouse-overs the tree nodes of sections.The window size can be enlarged by standard zoom controlsto help mouse-over the nodes. This view allows the analystto relate where each thread or group of threads seen in thecontent view arises from in the hierarchy. Buttons on this viewallow the analyst to drag a rectangle over a subset of sections:those sections will be highlighted in the content-based map.4. Threads and Sections panel: When the analyst has selectedan area of the content map, all threads in that area will be listedhere as a scrollable list. The panel has two tabs: the Threadtab lists the threads by title and section, and the Sections tablists all unique sections from which the threads arise.5. Thread Information panel: When the analyst clicks anyindividual thread in the content-based map (individual dot thatrepresents a single thread in the scatter plot) or clicks the titleof any individual thread in the Thread tab of the Threads andSections panel, the full text of that thread is shown here.Walkthrough example. Here we depict a typical usage ofPIHVI for thread discovery. Suppose an analyst is interestedin sport and fitness related discussion but does not yet knowhow such discussion is related to other discussion within theSuomi24 forum. This can be a possible sequence of findingsand interactions from the analyst when discovering the threadsof interest: 1. Initially the analyst views the content viewzoomed out to show all Suomi24, and notices several clustersof color, indicating discussion similar in content and arisingfrom tight branches of the section hierarchy.2. The analyst clicks some of these clusters to find a startingpoint for analysis. After a time the analyst find a green cluster(at the bottom in Figure 1 top) whose pop-up label shows thedominating section in the cluster is Sport and Fitness (“Urheiluja kuntoilu”). Alternatively, the analyst could have browsedthe section tree to find a Sport and Fitness section.3. The analyst then zooms in to view individual threads withinthe cluster, and draws a rectangle around them to quickly view
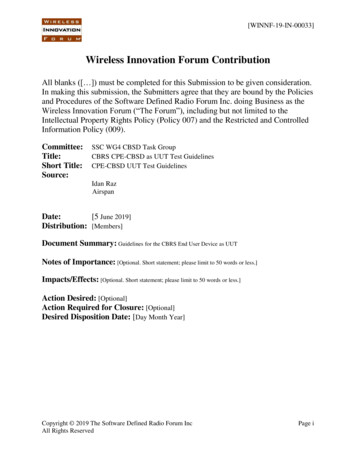
Figure 2: Possible interactions when an analyst is discoveringthreads of interest. Left: the analyst has used section filteringto discover several locations where Sport and Fitness (“Urheiluja kuntoilu”) is discussed (green highlighted clusters). Right:the analyst zoomed in towards the middle-right green cluster,and inspected nearby other clusters: near the green Health andFitness cluster (“Urheilu ja kuntoilu”) are two clusters, Health(“Terveys”; violet color) and Dogs (“Koirat”; red color).their titles. The analyst discovers many of them are aboutice hockey, a popular sport in Finland, such as threads aboutFinnish ice hockey teams and leagues and about related sportslike “Jääpallo” (Bandy in Finnish).4. The analyst draws a rectangle around the Sport and Fitness section and its nearby sections, to detect where else suchthreads occur in the content map: Figure 2 (Left) shows thatbesides the ice hockey related cluster at the bottom, there aresmall isolated clusters (light green dots) at edges of the map,and a large cluster at center right in the map. Thus the analystdiscovered a new cluster of Sport and Fitness discussion.5. The analyst removes the section filtering since he/she is interested in all sections in the area. The analyst zooms towardsthe discovered cluster, and notices it is located at the borderof two larger clusters (Figure 2 Right): clicking the clustersreveals their dominating sections as Health (“Terveys”; violetcolored cluster) and Dogs (“Koirat”; red colored cluster).6. Since the three clusters are close-by, this indicates they mayhave common topics. The analyst is then interested what commonalities there are in threads arising from Sport and Fitnessand in threads arising from Health, so the analyst zooms inmore on the plot, and draw a rectangle around the boundarybetween “Terveys” and “Urheilu ja kuntoilu”.7. The topics of the selected threads are listed in the detailpanel; the analyst finds several threads on weight-loss in theinformation panel.8. The analyst could continue investigating Sport and Fitness(e.g. moving to view some of the other small clusters of Sportand Fitness threads), or could e.g. investigate commonalitiesbetween Health and Dogs in the same window–this would turnout to be discussion of allergies when living with dogs.The above described interaction can go on as long as desiredby the analyst. For an analyst, e.g., in the forum administrationteam, such exploration may help understand the distributionof the threads, which can inspire, for example, reorganizationof forum sections, or a digest on hot discussion topics.Properties of the System. As desired in Design Principles,the proposed system directly supports several key tasks inShneiderman’s [15] taxonomy, in particular the visual information seeking mantra is supported as follows:Overview: The two linked views (content-based map and thetree of the section hierarchy) together show an at-a-glanceoverview of threads in the entire online forum. The radial treeview shows an at-a-glance overview of the section organization: sections with numerous child sections are shown as widebranches, and sections with multiple levels of subsections under them are shown as long branches. On the other hand thecontent-based map shows an at-a-glance overview of semantic content across the whole forum, organized so that similarcontent is shown nearby in the map, and groups of similarthreads appear as clusters; moreover, section colors overlaidon the map provide an easy overview of which sections havesimilar content, which sections have varied content appearingin multiple places on the map, and what the lowest commonhierarchy section is for some cluster of content.Zoom and filter: the analyst can zoom into the levels of detailin the content-based map with the mouse wheel, and can filterthreads from both linked views with selection boxes, e.g. toselect threads in a particular location in the content map andhighlight threads from a particular branch of the section tree.Details on demand: clicking on threads in the content basedmap shows their content, clicking on thread-clusters gives thename of their lowest common section, and creating a selectionbox over an area of the content map opens a linked view listingall threads in the area and all sections of those threads; andclicking any thread in that list shows the thread content.Relate: the content-based map relates threads by their content similarity by placing similar threads nearby in the map;the section tree relates sections by showing their parent-childrelationships; and the overlay of section colors onto the maprelates similarity of thread content to similarity of their sections. Inspecting these two linked views lets analysts quicklystudy how threads and sections at different branches in the hierarchy relate to each other in terms of content, and study howa cluster of semantically similar content is related to multiplesections where discussion of the content happens in the forum.As noted above, PIHVI includes filtering/highlighting of thecontent map by selected sections. Highlighting could also bedone by results of text lookup searches; we do not focus onsimple text search for several reasons: 1. Our focus is not onsearching individual documents but on overall comprehensionof the forum where information needs of the user evolve ashe/she learns about the data; such comprehension would notbe well served by individual text lookups. 2. Naive text searchdoes not take into account complexity of natural language andcould miss related threads if they did not share search terms(due to synonyms etc.), whereas the content map is organizedby overall similarity of all words in the documents, and servesexploration of discussion content better than simple searchwould. Nevertheless, where text lookup is needed it is trivialto highlight lookup results like we do to selected sections.We will compare PIHVI to a baseline system we implementedto represent a more traditional interactive section-based browsing interface, described in the User Experiment section.
DIMENSIONALITY REDUCTION FOR THE PIHVI SYSTEMWe describe the dimensionality reduction solution for creatingthe two main views – the content-based scatter plot and itscolor-based link to the section tree view, and then describe howzooming is implemented efficiently and using the hierarchyfor summarization of thread groups.Content-based Representation of Textual Data. PIHVI isinitiated by a content-based two-dimensional scatter plot ofthreads on the online forum (here Suomi24), followed byother interface components facilitating exploratory data analysis on the forum. In PIHVI, dots are discussion threadsin the “content-based” scatter plot. By “content-based”, wemean to pursue a two-dimensional representation such that1. if two threads are similar in content, they should be placednearby; and 2. if two threads are dissimilar in content, theyshould be placed faraway. We use BoW models to capture(dis)similarities between content of threads: the more wordstwo threads share, the more similar they are in content. We extract thread features based on BoW as follows, and perform anonlinear dimensionality reduction with neighbor embedding.BoW-based features in high-dimensional space. Westart with lemmatized tokens of Suomi24, provided by theFinnish Language Bank service (“Kielipankki”, http://www.kielipankki.fi). The resulting data set contains the lemmatized version of each token in each thread, along with othermeta-data of the token. We first calculate the TF-IDFs for eachtoken, constituting raw features of each thread. We furtherprocess the raw features as follows: 1. Remove stop-wordsbased on a Finnish stop-word list; 2. Only keep tokens thatappear in at least k threads, to discard incidental tokens thatdo not carry shared semantic content, such as rare URLs ornon-word character strings. 3. For each thread, keep only ltokens with highest TF-IDF values. With stop-words alreadyremoved, we assume these kept tokens are more informativethan others in each thread. 4. Normalize each obtained featurevector by dividing vector entries with their sum. We feedthe final features into t-SNE to obtain the two-dimensionalcontent-based representation for PIHVI. Considering the sizeof our corpus, t-SNE is a suitable choice since 1. t-SNE hasbeen shown to work well with high dimensional data; 2. scalable t-SNE variants exist. We use a tree-based implementation[18] to achieve a O(N log N) complexity for N threads.Section Distance based Coloring for Linking the Views. Inthe thumbnail view of the section hierarchy, we show a radialtree plot of the hierarchy and draw section nodes in different colors so the analyst can distinguish the sections and linkthem with the content-based map. There are a huge numberof sections, and giving each a completely different color isnot possible, thus assigning colors to successfully link the twomain views is nontrivial. We assume the analyst wishes tonotice similar content from far-apart sections of the hierarchy,and highly different content from close-by in the hierarchy,hence color differences should correspond to distances in thesection hierarchy. We use dimensionality reduction to optimize colors so that the most important differences are encodedwith the most different colors, and close-by sections in thehierarchy (having small path length from one section to theother in the section tree) get close-by colors. This color encoding is a visual cue helping users distinguish sections basedon their locations in the hierarchy. We do not require users toperceive section distances exactly from colors; it is enough tonotice similar colors (close-by sections) when browsing thecontent. We take path lengths between sections in the sectiontree as input distances, and give weights to atomic paths –paths connecting a section to its direct parent or child sectionwith wi j (Ci C j )/2, where Ci is the number of child sections of section i. Intuitively, if one end of the path has a largenumber of child sections, the parent is not connected to anyparticular one of its child sections, implying a looser connection with the other end. The distance between two sections isthen the sum of weights of atomic paths connecting them. Thedistances are reduced to coordinates in a 3D output space bymulti-dimensional scaling (MDS): the 3D output coordinatesare then normalized to the unit cube where they can be used asRGB color coordinates (more sophisticated color encodingsfrom perception theory are possible [8]). As a result, sectionsclose to the root get mild colors, with deepening saturationfor more specialized lower-level sections. We empirically findMDS can yield a more continuous coloring than non-distancepreserving dimensionality reduction algorithms like t-SNE.Zooming in the Content-based Plot. At the most detailedlevel in the content plot, threads are individual dots and theuser can easily see their content similarities from their spatialrelationships and their section similarities from their colors.When the user zooms out, he/she should similarly be able tosee content and section similarities of larger groups of threads.However, naive zooming of a large scatter plot would not accomplish this: firstly, in large discussion forums it would notbe feasible to redraw huge numbers of threads into a scatterplot quickly; secondly, in areas where threads arise from multiple sections the zoomed-out view would become a clump ofdifferent-colored dots, making it hard to notice overall similarities in sections of such threads. We solve both problemsby an intelligent zoom. The plot area is divided into a grid(the higher the zoom-out factor, the rougher the grid). Insteadof plotting individual threads we plot one circle per grid cell,summarizing all threads in it: the circle radius indicates number of threads in the cell, and circles are drawn with slighttranslucency to allow smooth overlap instead of occlusion.Grid cells are indexed by Hilbert curves in each zoom levelfor better performance in querying points in cells. For eachgrid cell the color of the circle must be chosen intelligentlyas the grid cell contains threads from multiple sections: wecompute the color by starting from each thread and traveling up the section hierarchy until we find the lowest sectioncovering at least 40% of threads in the grid cell, denoted thelowest dominating section. Thus the color of a circle indicatesdiversity of content in it: the less saturated (i.e., the closer tothe color of the root section), the more diverse the content.Such adaptive coloring lets the user quickly browse forumcontent at multiple detail levels. At each level, circles, theircolors, and their overlap yield an at-a-glance view of contentand section variation. As the user zooms out, areas of mixedsections become large diffuse circles colored ever closer tothe root color; as the user zooms in, such circles break into
subclusters with more vibrant colors, indicating thread groupsarising from tight branches of the section hierarchy.USER EXPERIMENT AND RESULTSWe perform a
Hierarchical Visualization Jaakko Peltonen , Ziyuan Lin , Kalervo Järvelin , and Jyrki Nummenmaa jaakko.peltonen@uta.fi, ziyuan.lin@uta.fi, kalervo.jarvelin@uta.fi, jyrki.nummenmaa@uta.fi ABSTRACT We introduce PIHVI: a novel interactive system for visualizing and exploring a large hierarchical text corpus of online forum postings.