Transcription
A Self-adaptive Treemap-based Technique for Visualizing HierarchicalData in 3DAbon Chaudhuri Han-Wei Shen†Computer Science & EngineeringThe Ohio State University, USAA BSTRACTIn this paper, we present a novel adaptive visualization techniquewhere the constituting polygons dynamically change their geometry and other visual attributes depending on user interaction. Thesechanges take place with the objective of conveying required levelof detail to the user through each view. Our proposed techniqueis successfully applied to build a treemap-based but 3D visualization of hierarchical data, a widely used information structure. Thisnew visualization exploits its adaptive nature to address issues likecluttered display, imperceptible hierarchy, lack of smooth zoomin and out technique which are common in tree visualization. Wealso present an algorithm which utilizes the flexibility of our proposed technique to deal with occlusion, a problem inherent in any3D information visualization. On one hand, our work establishesadaptive visualization as a means of displaying tree-structured datain 3D. On the other, it promotes the technique as a potential candidate for being employed to visualize other information structuresalso.on multiple regions of the visualization may not be possible due tothe same reason.3D visualizations usually resemble rigid polygonal structuresand hence inherit many properties of polygonal 3D objects leadingto problems like occlusion and view selection. Having this resemblance to 3D rigid bodies stand as an obstacle to build effective 3Dvisualization. If these rigid 3D structures are given the ability todynamically modify their geometry and other visual attributes onthe basis of user interaction, the problems mentioned above can betackled with novel strategies. That we have introduced 3D structures capable of undergoing such changes in our tool of displayinghierarchical data supports that statement.In this paper, we present a new technique to visualize treestructured data by incorporating adaptive 3D structures to conventional treemap. Successful application of adaptive visualization tohierarchical data opens up possibilities of this being employed tovisualize other information structures also. The main contributionsof our work can be summarized as follows:Index Terms: I.3.3 [Computer Graphics]: Methodology andTechniques—Interaction techniques; I.3.8 [Computer Graphics]:Miscellaneous Our method exploits the adaptive nature of 3D structures todevelop an algorithm that solves the occlusion problem in anovel way. Instead of getting the user into the trouble of finding a view for an occluded surface, the visualization adaptsits geometry to minimize occlusion. The flexibility of the 3Dstructures also protects the 3D view from getting distorted dueto perspective projection.1 I NTRODUCTIONEfficient visual representation of large hierarchical data is considered a major goal to achieve in information visualization. Twomain techniques employed so far to near that goal are node-linkrepresentation and space-filling visualization, Treemap being theprominent representative of the latter. Even though treemaps andtreemap-based approaches have established themselves as screenspace efficient, interactive tools for visualizing tree-structured data,the challenge is far from being called off unless issues like the following can be neatly resolved: cluttered display for hierarchies withhigh depth and/or width, maintaining stability of structure as wellas good aspect ratio of rectangles, focusing on regions of interest,smooth navigation up and down the hierarchy.Research endeavors in the domain of tree visualization have beenaiming at addressing as many of these issues as possible. Amongvarious modified schemes suggested and explored, the idea of promoting treemap to three dimensions has been paid considerable attention. This approach has connected treemap research to anothermajor debate regarding effectiveness of 3D tools to visually represent information as compared to their 2D counterparts.In general, 3D visualization tools offer better screen-space utilization, but avoiding occlusion and proper view selection stand astough challenges. Since no viewpoint can capture the entire 3D object at once, users may find it problematic to navigate to regionsnot visible from current viewpoint. Simultaneously concentrating e-mail:chaudhua@cse.ohio-state.edu† e-mail:hwshen@cse.ohio-state.eduIEEE Pacific Visualization Symposium 2009April 20 - 23, Beijing, ChinaU.S. Government work not protected by U.S. copyright Our work presents a 3D treemap-based visualization whichnicely deals with some of the issues regarding tree visualization and thus, establishes adaptive visualization as an usefultechnique for visually exploring large hierarchies. More precisely, our method produces views free of cluttered data items,distinguishes between views which display context and thosefocusing on selected regions, allows smooth navigation fromfocus to context view and vice versa, attains zoom, globallyas well as locally.An overview of the visualization is as follows: In our treemapbased algorithm algorithm, 3D structures appear and disappearbased on user’s request to view detailed information and hence, donot permanently add to the complexity of the visualization. As theuser selects different rectangles to visualize hidden information, the3D visualization dynamically change configuration to offer a betterview to the user. And most interestingly, with each request to display or hide some portion of the data, a group of polygons repositions themselves with the objective of minimizing occlusion.The rest of the paper is organized as follows: section 2 presents abrief survey of papers related to treemaps and 3D tree visualizationtools. Various aspects of our design including algorithm for minimizing occlusion are described through multiple subsections undersection 3. Section 4 discusses the visual cues used to strengthenperceptibility of the tool. Section 5 demonstrates how our visualization can be used to answer specific queries and to highlightvarious features of a particular data set. This section precedes ashort Conclusion which summarizes the work and hints at possibleextensions.105Authorized licensed use limited to: The Ohio State University. Downloaded on August 17,2010 at 02:50:41 UTC from IEEE Xplore. Restrictions apply.
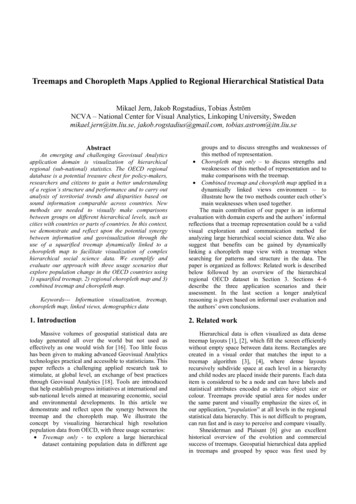
2 R ELATED W ORK2.1 Tree VisualizationTreemaps [5], introduced by Johnson and Shneiderman in theirmilestone work, display hierarchical data in a rectangular 2D areain space-filling manner. Starting from the entire area, it continuesto partition the rectangular space unless each rectangle representsa leaf node of the tree. The partitioning is done in such a way thatarea of each rectangle is proportional to the value of an attribute ofthe corresponding tree node. Treemaps are quite efficient in representing structural as well as content information of a hierarchy in asingle display.Since introduction of treemaps, numerous works have been published focusing on improving different aspects of this visualizationtool. More than one layout algorithms [4] [10] [1] [13], strategyof sub-dividing a rectangle representing an internal node into a setof smaller rectangles corresponding to its children, have been proposed with the objective of improving aspect ratio and maximizingstability. A comparative analysis of different layout algorithms isavailable here [13]. Works like Cushion Treemap [15] have enhanced the visual cues, e.g.-color and shading to provide with better perceptibility of the hierarchy. Various zooming and browsingtechniques [9] [3] have emerged so that the user can navigate upand down the hierarchical structure without much difficulty.In addition to these works which have added or modified featuresand functionalities to treemaps keeping its basic structure intact,many attempts have deviated from the conventional treemap to produce new kinds of tree visualization. Sunburst visualization [11],for example, was developed as another space-filling technique, butwith a radial display based on pie diagrams. Elastic hierarchies [17]was a venture to blend node-link and space-filling techniques.2.2 3D Interface for Tree VisualizationResearch to visualize tree-structured data in 3D was taking place inparallel with progress of treemap-based techniques. Cone Tree [7],way back in 1991, was developed as a 3D equivalent of node-linkrepresentation. This paper unfurled the idea of displaying only portions of a tree at a time by introducing techniques they called growing and pruning. This technique offers better screen space utilization and better average aspect ratio only at the cost of imposing anupper limit on number of levels to be displayed. Tanaka et al. introduced Treecube [12] which directly mapped the treemap layoutalgorithms to 3D primitives. Both the papers use transparent shading to reduce the effect of occlusion to some extent. StepTree [2],even though developed specifically to represent file system hierarchy, presents another way of 3D tree visualization by stacking uplevels. Their paper deals with occlusion by rendering only modifiedfiles as solid 3D boxes and the rest as wire frames. This technique ofutilizing an attribute which is particular for a file data item is hard togeneralize. Beamtrees [14] also use the third dimension to visualize the hierarchical structure more vividly. They, instead of gettingrid of occlusion, utilize it as a cue to perceive depth and hierarchy.Circle Packing [16] presents a 3D cylindrical display of hierarchical information. Schulz et al. [8] developed a generic framework ofdesigning treemap-based visualization in 3D, but skipped detaileddiscussion on occlusion.3 A LGORITHMOur algorithm creates a treemap-based visualization which, adaptive by nature, can efficiently display large hierarchical data in 3D.This section introduces the reader to the challenges in tree visualization only to unfold different components of our algorithm and toexplain how those components deal with the challenges.3.1 Cluttered TreemapsAttempt to display the entire tree at once in the stipulated screenspace often results in a cluttered treemap (Fig. 1(a)) with small rect-angles and illegible node labels. Our algorithm directly attacks theproblem of cluttering by displaying only selected levels of the treeat once. Initially our visualization renders only up to certain levelsof the tree and hence, resembles a normal treemap from appearance. The user has the freedom to choose how many levels are tobe displayed in what we call Basic Map(Fig. 1(b)). Unlike normaltreemap where each smallest rectangle corresponds to a leaf nodeof the tree, each rectangle in our basic map, to be called Base Rectangle, represents a node at the deepest level being displayed.This display, while it addresses the problem of cluttering, nevertheless is incomplete unless the user is given access to the levels notyet visible. Hence, based on user interaction, basic map has to create screen space for the level(s) rooted at nodes that correspond torectangles of basic map. In our visualization, that space is providedby rectangles which appear as perpendicular to the basic map atthe upper horizontal edge of user-selected base rectangles. Deeperlevels of data rooted at the node represented by a base rectangleare displayed in the form of another treemap, which we call liftedmap(Fig. 1(c)) on this extra screen space. The basic map automatically tilts itself backward to create an optimal view of the standingstructure.Given the same data, a treemap with multiple lifted maps lookless cluttered than a normal treemap because of the facts that thelifted maps show up in yet unused 3rd dimension and their orientation and color are different from that of base rectangles. Moreover,the user’s freedom to hide or display lifted maps according to needand degree of cluttering strengthens our scheme.(a)(b)(c)Figure 1: (a) Cluttered Treemap: displaying all 5 levels of NBA 2003data set. (b) Basic map which renders only first 4 levels. (c) Information at level 5 is shown through rectangles standing perpendicularto the basic map. For a better understanding of our technique andrelated discussions that follow, the supplementary video may turn outto be useful.3.2 Perceiving Hierarchy of DataAny 3D representation of hierarchical data needs to clearly definehow to perceive the hierarchy from it. Users, who are accustomedwith parent-child representation of treemaps, should be able to easily adapt to the new system. Figure 2 explains the parent-child relationship in our visualization. Each lifted treemap basically represents a tree whose root is the node represented by the base rectanglelying at its feet. In other words, a base rectangle and the entire areaof the lifted map standing at this base rectangle correspond to asingle node of the tree.3.3 OcclusionFigure 3 suggests that the aforesaid solution to cluttered display requires some strategy to deal with occlusion. In tilted view, a liftedmap always blocks some portion of the basic map and possiblysome part of other lifted maps, if any, irrespective of the locationof user’s eye. As multiple lifted maps pop up, the problem becomesprominent.106Authorized licensed use limited to: The Ohio State University. Downloaded on August 17,2010 at 02:50:41 UTC from IEEE Xplore. Restrictions apply.
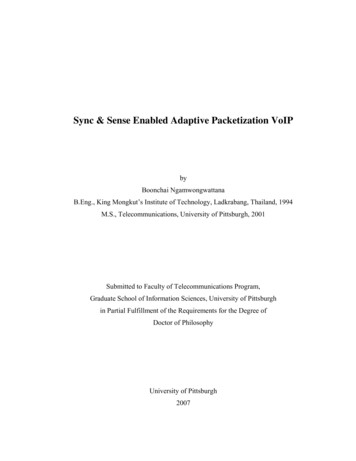
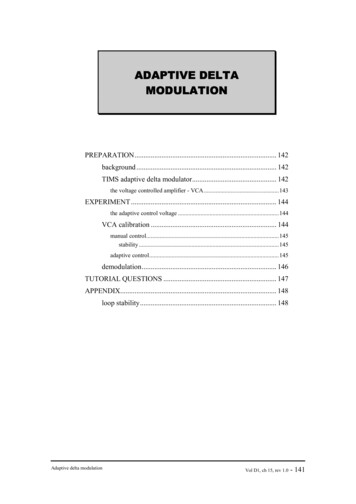
Figure 4(a) & 4(b).G.DE.FG . F . ABDACFBAACEFigure 2: Perceiving hierarchy: Left. The entire tree. Levels to bedisplayed in basic map are in shaded box. Middle. The basic map.Rectangles correspond to nodes at deepest displayed level, eg.- A,G, F. Right. The lifted map that stands atop rectangle labeled Adisplays subtree rooted at A.3.3.2Elevation mapThe basic map is associated with an elevation map which, we shallsee in Section 3.3.3, requires to be updated at the occurrence of twoevents: popping up and closing down of a lifted map. Elevation ofeach rectangle is stored as an integer which, multiplied by the current height (see section 3.4) of a lifted map gives the actual amountby which it is displaced parallelly from the plane where the map liesinitially. Hence base rectangles that are at elevation 0 stay on thatplane. In the beginning, all the base rectangles stay at elevation 0.Occurrence of a couple of events place them at different elevationlevels.The basic map appears 2D as long as all the base rectangles haveelevation 0. Otherwise, when the angle of tilt is zero, a rectangle with higher(lower) elevation appears closer to(farther from) eye(Fig. 5(a)). As the user starts to tilt the map backward, the oneswith higher(lower) elevation appear to be placed on top of (below)the ones with lower(higher) elevation (Fig. 5(b)). Hence, the elevation map imparts some kind of front-back(up-down) relationshipbetween rectangles in non-tilted(tilted) view.TopBack(Top)Front(Bottom)Bottom(a) Basic mapFigure 3: Problem of OcclusionRotating the entire map or zooming in on one portion, whichseems to be a quick fix, helps to visualize a couple of lifted mapslocated close to each other only at the cost of losing view of the restof the map. Moreover, allowing uncontrolled zoom-in may taketo unusable views where it is difficult for the user to keep track ofuser’s eye location in object space.Our scheme of adaptive structure solves the problem in a novelway. The basic idea is that whenever a lifted map emerges, all thebase rectangles that would be potentially occluded by it in someconfiguration of the map elevate themselves to the height of thelifted map. Each of these elevated rectangles block the view of oneor more base rectangles; hence they also need to be elevated. Thisprocess of elevating base rectangles start from the location of thenewly lifted map and rolls on recursively until the far end of thebasic map is reached. In a similar fashion, closing down of a liftedmap initiates a process of lowering of a group of base rectangles.3.3.1(b) Tilted mapFigure 4: Top-Bottom Relation between base rectangles in BasicMap changes to Front-Back Relation in Tilted View.FrontBack010Above (Front)000Below (Back)100000(a) No-tilt view00000000(b) Tilted viewFigure 5: Elevation map imparts a Front-back(Up-Down) Relation between base rectangles in non-tilted(tilted) map.Front-Back and Top-Bottom RelationshipBefore discussing the algorithm, it would be appropriate to clarifyhow we have defined front-back and top-bottom relation betweentwo base rectangles. In the basic map, all rectangles stay perpendicular to the line of sight given the line of sight intersects the centerof the entire map. So the basic map, in appearance, is no differentfrom a conventional 2D treemap. Whenever a lifted map appears,the basic map tilts in a way so that the upper or top end of the 2Dbasic map moves away from eye and the lower or bottom end comescloser. As a result, between any two base rectangles, the one thatis completely below (on top of) the other in basic map automatically turns out to be in front (at back) of the other in tilted map, see3.3.3Algorithm for Adaptation of Elevation MapAt Popping up of a Lifted Map: When a base rectangle at elevation h is selected by the user, the adjacent ones which are atback of it are elevated to a level at least (h 1). Then each of theserectangles is probed and their backward neighbors are elevated ina similar fashion. This process should go on recursively unless arectangle which has no backward neighbor is reached. On successful completion of the run, each rectangle should be at an elevationwhich is equal to or greater than the maximum elevation of all itsadjacent front rectangles. Figure 6(a) is a sample case showing howthe elevation maps are updated.107Authorized licensed use limited to: The Ohio State University. Downloaded on August 17,2010 at 02:50:41 UTC from IEEE Xplore. Restrictions apply.
0000 000001000 0000000 00Selected Base Rectangle110 0021110100 00220100(f)(e)(d)01010 000Selected Base Rectangle11000(c)(b)(a)1101(a) Popping up of rectangles: In a and c, user selects shaded base rectangles to view details. In all the diagrams, the rectanglewhose backward neighbors are being checked is marked with a star. An arrow stretches through the shaded backwardneighbors.2120 00010 00102000 00000(f)000000000 0(g)20000 000(d)10221(c)00 02100 00102212(b)selected base rectangle(a)(e)01121000001020 010000(h)(b) Closing down of rectangles: In a, user selects rectangles to hide details. In all the diagrams, the rectangle whose backward neighbors are beingchecked is marked with a star. The one undergoing updating of elevation is shaded. An arrow stretches through the front neighbors of the one beingshaded.Figure 6: Sequence of diagrams explaining two cases of adaptation algorithm. To clearly show the elevation values at every stage, the diagramsare drawn in such a way that they look tilted at 0 . In the actual application, they would appear as tilted at some angle.108Authorized licensed use limited to: The Ohio State University. Downloaded on August 17,2010 at 02:50:41 UTC from IEEE Xplore. Restrictions apply.
At Closing down of a Lifted Map: In the second case wherethe user closes down a lifted structure, the algorithm starts fromthe parent rectangle which is at the feet of the lifted structure. Thealgorithm checks the backward neighbors one by one to see if theyshould be lowered. This checking is not quite straightforward.Suppose a rectangle A is one which lies at the feet of a closinglifted map. Suppose B is a backward neighbor of A. Now if B canbe lowered or not, more precisely speaking, the amount of allowable lowering for B does not depend only on A, but on all the frontneighbors of B, namely A, E and D from Figure 7. For any givenbase rectangle, its backward neighbor can be lowered if -to no-tilt view without closing down the lifted maps, the base rectangles no longer appear to be at equal distance due to foreshortening (Fig. 8(b)). On the other hand, when the user tilts it at itsmaximum (i.e., one right angle), the lifted maps, located at different distances from eye, offer a view from which it is hard to perceivehierarchy of the data (Fig. 8(c)).1. None of the front rectangles has their lifted maps visible.2. After lowering down, it will be at elevation at least equal tomaximum elevation of all of the front neighbors.More generally speaking, a back rectangle B can be lowered by theamount (see Fig.7): EB Max(EI HI ) where I A, E, D. EI andHI respectively denote elevation of a rectangle I and height of itslifted map associated to it. If the lifted map at I is not yet displayed,HI 0. If the above two conditions are satisfied, the back rectanglecomes down to the same level as the A.(a)(b)(c)Figure 8: (a) Occlusion free treemap with multiple lifted maps andelevated base rectangles. (b) Distorted Basic map: obtained by tiltingthe figure at left back to zero degree. (c) Distortion at full tilt: 90 rotated view of figure at far left.Back.BDEA.FrontFigure 7: All Front neighbors of B determine if B can be lowered.The decision about lowering down of backward neighbor taken,the algorithm proceeds similarly. The same process is repeated witheach rectangle which was being treated as a backward neighbor inprevious stage. This process rolls on recursively unless the back endof the map is reached. Figure 6(b) displays a sequence of operationswhile closing down a lifted structure.3.3.4Data StructuresA quick review of the adaptation strategy reveals requirement oftwo data structures to successfully manage the two cases describedin Section 3.3.3. While dealing with the first case, for each baserectangle, a list of all its adjacent backward neighbors along withtheir elevations is to be computed. In the second case, the algorithm, in addition to the previous one, needs another data structurewhich is basically a list of all front neighbors along with their elevations for each base rectangle.Given N base rectangles, computation of both the lists has complexity (N 2 ). But this needs to be done only once unless the hierarchical data itself changes. Hence construction of both the listscan be performed as a pre-processing step before rendering the basic map. With occurrence of each event, the elevation values of eachrectangle must be updated which is a linear order computation.3.4Distortion due to Perspective ViewingThe idea of placing rectangles at various elevation levels solvesocclusion (Fig. 8(a)), but invokes another problem. Our visualization being 3D, perspective projection seems to be the naturalchoice among different projection techniques. But with multiplelifted maps having displayed, the adaptation algorithm positionsbase rectangles at different elevations. Now if the user rotates backEffect of both distortions is nullified by exploiting the adaptivenature of our visualization. We have introduced proportionality between angle of tilt, which we can call θ , and height of a lifted map,say h, to get away with distortion shown in Fig. 8(b). As a result, instead of directly popping up with a constant height, the lifted mapssmoothly grow and shrink with increase and decrease of angle oftilt allowing the user to rotate back to see the basic map as it was(see Figure 10 and 11).Distortion at full tilted view (Fig. 8(c)) is overcome by incorporating adaptiveness to the base rectangles also. As the angle oftilt increases, all the base rectangles gradually contract with the objective of bringing all lifted maps to same x-y plane in full tiltedview. The interesting thing is that base rectangles contract at different rates depending on their position with respect to the targetedx-y plane. The contraction can be looked upon as movement oftwo parallel straight lines at two different rates: the top and bottomedges of the rectangle. If the targeted plane is z T , the top andbottom edges reside on the planes z t and z b respectively, andthe contraction is to happen over a span of change of angle θ , thenthe rate of contraction for the top edge is (t T )/θ and for bottomedge is (b T )/θ , assuming t b T (see Figure 9).yz 0 planeAxz tz bzz TFigure 9: Contraction of a sample base rectangle A. The basic maprotates around z 0.3.5 Zoom-in TechniqueZoom-in and out technique built in a tree visualization system provides the user with a means of smooth navigation through different109Authorized licensed use limited to: The Ohio State University. Downloaded on August 17,2010 at 02:50:41 UTC from IEEE Xplore. Restrictions apply.
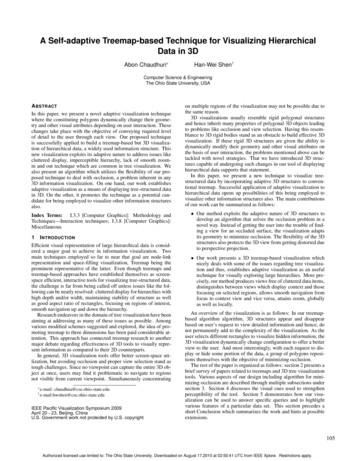
(a) θ 45 (b) 45 θ 30 (c) 30 θ 15 (d) θ close to 0 Figure 10: (a) Basic view with some randomly selected lifted maps. (b)-(d) As the angle of tilt gradually goes down to 0 , the heights of the liftedmaps proportionally reduce so that basic view suffers no distortion. The sequence will produce a basic view same as in Fig. 1(b).(a) θ 45 (b) 45 θ 70 (c) 70 θ 90 (d) θ 90 Figure 11: (a)-(c) Base rectangles contract to bring all lifted maps to same image plane as angle of tilt approaches 90 . (d) At 90 tilted view, theview is similar to that of a 2D treemap with details exposed.levels of the tree. Traditional zoom-in techniques can always be applied to our visualization, but adaptive nature of our 3D structuresitself offers different ways of attaining zoom. The basic idea is thatthe polygon targeted to be zoomed in on can itself bring changes toits geometry and/or position to appear larger.Local zoom: The proportionality between angle of tilt θ andheight of a lifted map h (see section 3.4) has been utilized to attainnatural zoom on individual rectangles. In a conventional treemap,the area of the base rectangle would have been used to render thetreemap corresponding to the deeper levels below the node represented by that rectangle. In our method, the lifted rectangle provides the space for rendering inner levels. The lifted rectangle’swidth, say l has to be equal to that of the parent base rectangle. Butits height h can be controlled by varying the angle of tilt. Given w,the length of the base rectangle, the available screen area for displaying details would be l w in a conventional treemap and l h inour method. Since h k θ for some constant k, to attain a biggerdisplay area than what conventional treemap could offer, the basicmap needs to be tilted at a minimum angle(see Figure 12) for whichk θ w.llAh1AwAh2AwFigure 12: Left. The basic map is tilted at θ1 such that h1 k θ1 w.Hence no zoom achieved. Right. The basic map is tilted at θ2 suchthat h2 k θ2 w. A gain equal to h2 /w on area for rendering liftedmap is obtained.Global zoom: Again the adaptability of the base rectangles, asdiscussed in section 3.4, provides another way of zooming in onthe entire treemap. Careful selection of the x-y plane where alllifted maps should reach at full tilted view is the key. If a baserectangle’s top edge is at z c initially and the targeted plane isz d where d c; the rectangle, while contracting, carries thelifted map associated to it closer to the eye as angle of tilt increases.Figure 13 demonstrates with a single base rectangle how a zoom-ineffect is obtained in this way.AAAFigure 13: If a base rectangle is made to slide forward as angle oftilt increases, its associated lifted map gradually expands, even ifits height stays constant over change of angle, as is the case in thediagrams. The black thick line represents axis of rotation of the entiremap. The blue line which denotes extended top edge of rectangle Agradually moves forward.3.6Focus and Context VisualizationOur algorithm offers a wide range of views depending on the angleof tilt, which varies from 0 to 90 . Sidewise rotation also producesa number of views. Having so many of them can be called justifiable only if all these views convey some information and moreimportantly, not all of them display same information. In our case,we use the two extremes, the ones tilted at 0 and 90 , to representtwo 2D treemaps. Given a tree with D levels of which first d aredisplayed in basic map, the 90 view can potentially represent theentire treemap with all nodes up to level D. The intermediate views,110Authorized licensed use limited to: The Ohio State University. Downloaded on August 17,2010 at 02:50:41 UTC from IEEE Xplore. Restrictions apply.
while they guide the user smoothly from one end to the other preventing abrupt change, also allow the user to focus on details atdifferent parts of the basic map.The proportionality and contraction scheme discussed in section3.4 determines if visualizing focus or context is the main goal fora particular view. The contraction of base rectangles purposefullystart at 45 , not at 0 . As a result, in the views where 45 θ 0 (Fig. 10), the base rectangles (which present context) stay intactand height of lifted maps (which present focus) are comparativelysmall. These views mostly convey context information. The viewswith 45 θ 90 comprise thinned base rectangles and elongatedlifted maps (Fig. 11), and naturally emphasize on details. Hencethe transition from 0 to 90 view can be interpreted as a shift eitherfrom less to more informative view or from context to focus view.If the user somehow loses track of structural(context) informationwhile concentrating on a lifted map(focus), it is just a matter oftilting back to restore a view that restores the hierarchy.4V ISUAL C UESVisual cues play important role in assisting the user to perceive various features of a visualization. Our implementation of a prototypeusing Java binding of OpenGL also takes recourse to cues in theform of color and shading, redundant polygons, animation and navigation techniques.Like normal treemap, our visualization uses color of each rectangle as representative of some suitable attribute of the data. Unlikenormal treemap, it renders rectangles of some intermediate level,not the ones corresponding to leaf nod
hierarchical data supports that statement. In this paper, we present a new technique to visualize tree-structured data by incorporating adaptive 3D structures to conven-tional treemap. Successful application of adaptive visualization to hierarchical data opens up possibilities of this being employed to visualize other information structures also.