Transcription
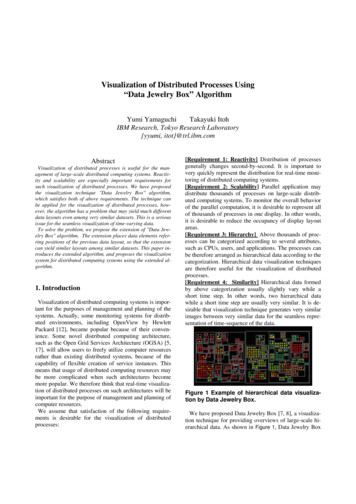
Review of Hierarchical Models for DataClustering and VisualizationLola Vicente & Alfredo VellidoGrup de Soft ComputingSecció d’Intel·ligència ArtificialDepartament de Llenguatges i Sistemes InformàticsUniversitat Politècnica de Catalunya (UPC)Jordi Girona, 1-3. E-08034 Barcelona{mvicente, avellido}@lsi.upc.esAbstract. Real data often show some level of hierarchical structure and itscomplexity is likely to be underrepresented by a single low-dimensionalvisualization plot. Hierarchical models organize the data visualization at differentlevels, and their ultimate goal is displaying a representation of the entire data set atthe top-level, perhaps revealing the presence of clusters, while allowing the lowerlevels of the hierarchy to display representations of the internal structure withineach of the clusters found, providing the definition of lower level sets of subclusters which might not be apparent in the higher-level representation. Severalunsupervised hierarchical models are reviewed, divided into two main categories:Heuristic Hierarchical Models, with a focus on Self-Organizing Maps, andProbabilistic Hierarchical Models, mainly based on Gaussian Mixture Models.1IntroductionThe structural complexity of high-dimensional datasets can hardly be captured by meansof single, low-dimensional representations, and information which is structured atdifferent representation levels is likely to escape them. Often, real-world datasets involvesome level of hierarchical structure.Hierarchical models organize the data visualization at different levels, and theirultimate goal is displaying a representation of the entire data set at the top-level, perhapsrevealing the presence of clusters, while allowing the lower levels of the hierarchy todisplay representations of the internal structure within each of the clusters found,providing the definition of lower level sets of sub-clusters which might not be apparent inthe higher-level representation. The definition of a hierarchy will allow the analyst to drilldown the data in order to discover patterns that might be hidden to other, more simplemodels (See example in figure 1).The construction of a hierarchy, in all the models hereupon reviewed, is carried out ina top-down fashion, in a procedure known as divisive hierarchical clustering. This reviewseparates the unsupervised models under consideration into two categories: HeuristicHierarchical Models and Probabilistic Hierarchical Models. Heuristic HierarchicalModels focus on variations on the well known Self-Organizing Map (SOM, [1, 2]). Thismodel has been widely used over the last twenty-odd years due to its powerfulvisualization properties, and despite some of its intrinsic limitations. ProbabilisticHierarchical Models are based on density estimations: Hierarchical Mixture of LatentVariable Models and Hierarchical Generative Topographic Model, will be reviewed.
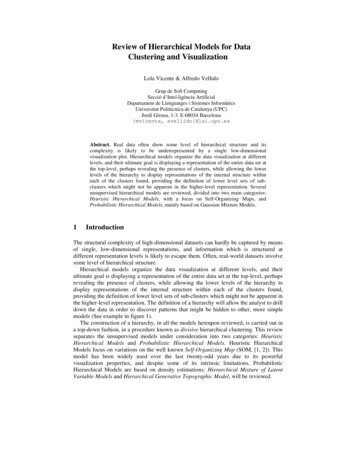
Approaches to hierarchical data visualization incorporating SOM entail a “hard” datapartition, while probabilistic models allow a “soft” partitioning in which, at any level ofhierarchy, data points can effectively belong to more than one model.Fig. 1. An example of a hierarchical model, where more details on the structure of the data arerevealed in each level, from Bishop & Tipping [3]2Heuristic Hierarchical models based on the SOMSOM is an unsupervised, neural network-inspired model for clustering and datavisualization, in which the prototypes1 are encouraged to reside in a one- or twodimensional manifold in the feature space. The resulting manifold is also referred to as aconstrained topological map, since the original high-dimensional observations aremapped down onto a fixed, ordered, discrete grid on a coordinate system.Kohonen’s [1, 2] SOM is an unsupervised neural network providing a mapping from ahigh-dimensional input space to a one- or two-dimensional output space while preservingtopological relations as faithfully as possible.The SOM consists of a set of units arranged usually arranged in a 1- or 2-dimensionalgrid with a weight vectormi ℜ n attached to each unit. The basic training algorithmcan be summarized as follows: Observations from the high-dimensional input space, referred to as input vectorsx ℜ n , are presented to the SOM and the activation of each unit for the presentedinput vector is calculated, usually resorting to an activation function based on thedistance between the weight vector of the unit and the input vector.1Prototype methods represent the training data by a set of points in the feature space. Theseprototypes are typically not examples from the training sample.
The weight vector of the unit showing the highest activation (smallest distance) isselected as the “winner” and is modified as to more closely resemble the presentedinput vector by means of a reorientation of the weight vector towards the direction ofthe input vector, weighted by a time-decreasing learning rate α . Furthermore, the weight vectors of units in the neighborhood of the winner aremodified accordingly (to a lesser extent than the winner) as described by a timedecreasing neighborhood function. This learning procedure finally leads to a topologically ordered mapping of thepresented input signals. Similar input data are mapped onto neighboring regions on themap.Several developments on the basic algorithm have addressed the issue of adaptiveSOM structures; amongst them: Dynamic Self-Organizing Maps [4], Incremental GridGrowing [5], or Growing Grid [6], where new units are added to map areas where thedata are not represented at a satisfying degree of granularity.As mentioned in the introduction, hierarchical models can provide more informationfrom a data set. SOM has been developed in several ways in order to set it withinhierarchical frameworks, which are commonplace as part of more standard statisticalclustering procedures.2.1Hierarchical Feature MapThe key idea of hierarchical feature maps as proposed in [7] is to use a hierarchical setupof multiple layers where each layer consists of a number of independent SOMs. OneSOM is used at the root or first layer of the hierarchy. For every unit in this map a SOMis created in the next layer of the hierarchy. This procedure is repeated in further layers ofthe hierarchical feature map. A 3-layered example is provided in figure 2. The first layermap consists of 2x2 units, thus we find four independent self-organizing maps on thesecond layer. Since each map on the second layer consists again of 2x2 units, there are 16maps on the third layer.The training process of hierarchical feature maps starts with the root SOM on the firstlayer. This map undergoes standard training. When this first SOM becomes stable,i.e. only minor further adaptation of the weight vectors occurs, training proceeds with themaps in the second layer. Here, each map is trained with only that portion of the inputdata that is mapped on the respective unit in the higher layer map. This way, the amountof training data for a particular SOM is reduced on the way down the hierarchy.Additionally, the vectors representing the input patterns may be shortened on thetransition from one layer to the next, due to the fact that some input vector componentscan be expected to be equal among those input data that are mapped onto the same unit.These equal components may be omitted for training the next layer maps without loss ofinformation.Fig. 2. Architecture of a three-layer hierarchical feature map, from Merkl [18]Hierarchical feature maps have two benefits over SOM which make this modelparticularly attractive:
First, hierarchical feature maps entail substantially shorter training times than thestandard SOMs. The reason for that is twofold: On the one hand, there is the inputvector dimension reduction on the transition of one layer to the next. Shorter inputvectors lead directly to reduced training times. On the other hand, the SOM training isperformed faster because the spatial relation of different areas of the input space ismaintained by means of the network architecture rather than by means of the trainingprocess. Second, hierarchical feature maps may be used to produce fairly isolated, i.e. disjoint,clusters of the input data than can be gradually refined when moving down along thehierarchy. In its basic form, the SOM struggles to produce isolated clusters. Theseparation of data items is a rather tricky task that requires some insight into thestructure of the input data. Metaphorically speaking, the standard SOM can be used toproduce general maps of the input data, whereas hierarchical feature maps produce anatlas of the input data. The standard SOM provides the user with a snapshot of thedata; as long as the map is not too large, this may be sufficient. As the maps growlarger, however, they have the tendency of providing too little orientation for the user.In such a case, hierarchical feature maps are advisable as models for datarepresentation.2.2Hierarchical SOMThe Hierarchical SOM (HSOM) model usually refers to a tree of maps, the root of whichacts as a preprocessor for subsequent layers. As the hierarchy is traversed upwards, theinformation becomes more and more abstract. Hierarchical self-organizing networks werefirst proposed by Luttrell [9]. He pointed out that although the addition of extra layersmight yield a higher distortion in data reconstruction, it might also effectively reduce thecomplexity of the task. A further advantage is that different kinds of representationswould be available from different levels of the hierarchy. A multilayer HSOM forclustering was introduced by Lampinen and Oja [10]. In the HSOM, the best matchingunit (BMU) of an input vector x is sought from the first-layer map and its index is givenas input to the second-layer map. If more than one data vector concurs within the sameunit of the first layer map, the whole data histogram can be given to the second layerinstead of a single index. This approach has been applied to document databasemanagement [11].HSOM consists of a number of maps organized in a pyramidal structure, such as thatdisplayed in figure 3. Note that there is a strict hierarchy and neighborhood relationimplied with this architecture. The size of the pyramid, i.e. the number of levels as wellas the size of the maps at each level, has to be decided upon in advance, meaning there isno dynamic growth of new maps based on the training process itself. However, since thetraining of the pyramid is performed one level at a time, it is theoretically possible to adda further level if required. Furthermore, note that, usually, the number of nodes at thehigher levels is small as compared to other SOM models using multiple maps.During the training process, the input vectors that are passed down in the hierarchy arecompressed: if certain vector entries of all input signals that are mapped onto the samenode show no or little variance, they are deemed not to contain any additionalinformation for the subordinate map and thus are not required for training thecorresponding sub-tree of the hierarchy. This leads to the definition of different weightvectors for each map, created dynamically as the training proceeds.
Fig. 3. Hierarchical SOM Architecture: 3 layers with 2x2 (layers 1 and 2) and 3x3 (layer 3) fromKoikkalainen & Oja [12]2.3Growing Hierarchical SOMThe Growing Hierarchical Self-organizing Map [13, 14] (GHSOM) is proposed as anextension to the SOM [1, 2] and HSOM [9] with these two issues in mind:1. SOM has a fixed network architecture i.e. the number of units to use as well as thelayout of the units has to be determined before training.2. Input data that are hierarchical in nature should be represented in a hierarchicalmanner for clarity of representation.GHSOM uses a hierarchical structure of multiple layers where each layer consists of anumber of independent SOMs. Only one SOM is used at the first layer of the hierarchy.For every unit in this map a SOM might be added to the next layer of the hierarchy. Thisprinciple is repeated with the third and any further layers of the GHSOM.In order to avoid SOM fixed size in terms of the number of units an incrementallygrowing version of SOM is used, similar to the Growing Grid.
Fig. 4. GHSOM reflecting the hierarchical structure of the input data, from Dittenbach, Merkl &Rauber [13]The GHSOM will grow in two dimensions: in width (by increasing the size of eachSOM) and in depth (by increasing the levels of the hierarchy).For growing in width, each SOM will attempt to modify its layout and increase itstotal number of units systematically so that each unit is not covering too large an inputspace. The training proceeds as follows:1. The weights of each unit are initialized with random values.2. The standard SOM training algorithm is applied.3. The unit with the largest deviation between its weight vector and the input vectors thatrepresents is chosen as the error unit.4. A row or a column is inserted between the error unit and the most dissimilarneighbour unit in terms of input space5. Steps 2-4 are repeated until the mean quantization error (MQE) reaches a giventhreshold, a fraction of the average quantification error of unit i, in the proceedinglayer of the hierarachy.Fig. 5. Inserting a row in SOM, from Dittenbach, Merkl & Rauber [13]The picture on the left of figure 5 is the SOM layout before insertion. “e” is the errorunit and “d” is the most dissimilar neighbor. The picture on the right shows the SOMlayout after inserting a row between “e” and “d”.
As for deepening the hierarchy of the GHSOM, the general idea is to keep checkingwhether the lowest level SOMs have achieved enough coverage for the underlying inputdata.The details are as follows:1. Check the average quantification error of each unit to ensure it is above certain giventhreshold: it indicates the desired granularity level of a data representation as a fractionof the initial quantization error at layer 02. Assign a SOM layer to each unit with an average quantification error greater than thegiven threshold, and train SOM with input vectors mapped to this unit.GHSOM provides a convenient way to self organize inherently hierarchical data intolayers and it gives users the ability to choose the granularity of the representation at thedifferent levels of the hierarchy. Moreover, the GHSOM algorithm will automaticallydetermine the architecture of the SOMs at different levels. This is an improvement overthe Growing Grid as well as HSOM.The drawbacks of this model include the strong dependency of the results on a numberof parameters that are not automatically tuned. High thresholds usually result in a flatGHSOM with large individual SOMs, whereas low thresholds result in a deep hierarchywith small maps.3Probabilistic Hierarchical modelsProbabilistic models offer a consistent framework to deal with problems that entailuncertainty. When probability theory lays at the foundation of a learning algorithm, therisk that the reasoning performed in it be inconsistent in some cases is lessened ([15, 16])Next, we present several hierarchical models developed within a probabilistic framework.The presentation of each model is preceded by a brief summary of the theory laying itsfoundations.3.1Gaussian Mixture ModelingThe Gaussian Mixture Model (GMM) is based on density estimation. It is a semiparametric estimation method since it defines a very general class of functional forms forthe density model where the number of adaptive parameters can be increased in asystematic way (by adding more components to the model) so that the model can bemade arbitrarily flexible.In a mixture model, a probability density function is expressed as a linear combinationof basis functions. A model with M components is written in the formp( x) MP( j ) p ( x j ) ,(1)j 1P ( j ) are called the mixing coefficients and the parameters of thecomponent density functions p( x j ) typically vary with j. To be a valid probabilitywhere the parametersdensity, a function must be non-negative throughout its domain and integrate to 1 overthe whole space. Constraining the mixing coefficients
M(2)P( j ) 1j 10 P( j ) 1 ,(3)and choosing normalized density functions(4)p ( x j )dx 1guarantees that the model does represent a density function.The mixture model is a generative model and it is useful to consider the process ofgenerating samples from the density it represents, as they can be considered asrepresentatives of the observed data. First, one of the components j is chosen at randomwith probability P ( j ) ; thus we can view P ( j ) as the prior probability of the jthcomponent. Then a data point is generated from the corresponding density p( x j ) . Thecorresponding posterior probabilities can be written, using Bayes’ theorem, in the formP( j x) (5)p( x j ) P( j )p ( x)where p(x) is given by (1). These posterior probabilities satisfy the constraintsM(6)P( j x) 1 , 0 P( j x) 1j 1It only remains to decide on the form of the component densities. These could beGaussian distributions with a different form of covariance matrix. Spherical The covariance matrix is a scalar multiple of the identity matrix,j σ I so that p ( x j ) 2j1(2πσ 2j )d2exp Diagonal The covariance matrix is diagonaljx µj2(7)2σ 2j diag (σ 2j ,1 ,., σ 2j , d ) and thedensity function isp( x j ) 1(2π i 1σ 2j , i )dd2exp di 1( xi mu j , i )2(8)2σ 2j ,i Full The covariance matrix is allowed to be any positive definite d d matrixjand the density function isp( x j ) 12πd1( x µ j )T Σ 1 ( x µ j )1 exp 222j(9)
Each of these models is a universal approximator, in that they can model any densityfunction arbitrarily closely, provided that they contain enough components. Usually amixture model with full covariance matrices will need fewer components to model agiven density, but each component will have more adjustable parameters.The method for determining the parameters of a Gaussian mixture model from a dataset is based on the maximization a data likelihood function. It is usually convenient torecast the problem in the equivalent form of minimizing the negative log likelihood of thedata setNE L (10)log p ( x n ) ,n 1which is treated as an error function. Because the likelihood is a differentiable function ofthe parameters, it is possible to use a general purpose non-linear optimizer such as theexpectation-maximization (E-M) algorithm [17]. It is usually faster to converge thangeneral purpose algorithms, and it is particularly suitable to deal with incomplete data.3.2Hierarchical Mixture ModelsBishop and Tipping [3] introduced the concept of hierarchical visualization forprobabilistic PCA. By considering a probabilistic mixture of latent variable models weobtain a “soft” partition of the data set at the top level of the hierarchy into “clusters”,corresponding to the second level of the hierarchy. Subsequent levels, obtained usingnested mixture representations, provide increasingly refined models of the data set. Theconstruction of the hierarchical tree proceeds top-down, and can be driven interactivelyby the user. At each stage of the algorithm the relevant model parameters are determinedusing the expectation-maximization (E-M) algorithm [17].The density model for a mixture of latent variable models takes the form:p (t ) M0i 1(11)π i p(t i )where M 0 is the number of components of the mixture, and the parametersπiare themixing coefficients, or prior probabilities, corresponding to the mixture componentsp (t i ) . Each component is an independent latent variable model with parameters µi ,2W i and σ i .The hierarchical mixture model is a two-level structure consisting of a single latentvariable model at the top level and a mixture of M 0 such models at the second level.The hierarchy can be extended to a third level by associating a groupGi of latentvariable models with each model i in the second level. The corresponding probabilitydensity can be written in the formp(t ) M0i 1πij G iπ i i p(t i, j )(12)
where thep (t i, j ) again represent independent latent variable models, and the π j icorrespond to sets of mixing coefficients, one for each i, satisfyingjπ j i 1 . Thus,each level of the hierarchy corresponds to a generative model, with lower levels givingmore refined and detailed representations.Determination of the parameters of the models at the third level can again be viewedas a missing data problem in which the missing information corresponds to labelsspecifying which model generated each data point.3.3Generative Topographic MappingThe aim of the Generative Topographic Mapping (GTM, [18]), a probabilistic alternativeto the SOM, that also resorts to Bayesian statistics, is to allow a non-linear transformationfrom latent space to data space but keeping the model computationally tractable. In thisapproach, the data is modeled by a mixture of Gaussians (although alternativedistributions can be used), in which centers of the Gaussians are constrained to lie on alower dimensional manifold. The topographic nature of the mapping comes aboutbecause the kernel centers in the data space preserve the structure of the latent space. Byadequate selection of the form of the non-linear mapping, it is possible to train the modelusing a generalization of the EM algorithm.The GTM provides a well-defined objective function (something that the SOM lacks)and its optimisation, using either non-linear standard techniques or the EM-algorithm, hasbeen proved to converge. As part of this process, the calculation of the GTM learningparameters is grounded in a sound theoretical basis. Bayesian theory can be used in theGTM to calculate a posterior probability of each point in latent space being responsiblefor each point in data space, instead of the SOM sharp map unit membership attributionfor each data point.The GTM belongs to a family of latent space models that model a probabilitydistribution in the (observable) data space by means of latent, or hidden variables. Thelatent space is used to visualize the data, and is usually a discrete square grid on the twodimensional Euclidean space. GTM creates a generative probabilistic model in the dataspace by placing a radially symmetric Gaussian with zero mean and inverse variance.3.4Hierarchical GTMThe probabilistic definition of the GTM allows its extension to a hierarchal setting in astraightforward and principled way [19]. The Hierarchical GTM (HGTM) models thewhole data set at the top level, and then breaks it down into clusters at deeper levels ofthe hierarchy. The hierarchy is defined as follows: HGTM arranges a set of GTMs and their corresponding plots in a tree structure T. The Root is considered to be at level 1, i.e. Level(Root) 1. Children of a model Nwith Level(N) i are at level i 1, i.e. Level(M) i 1, for all M Children(N). Each model M in the hierarchy, except for the Root, has an associated parentconditional mixture coefficient: a prior distribution defined as: p (M Parent(M)).The priors are non-negative and satisfy the consistency condition:p( M N ) 1M Children ( N ) Unconditional priors for the models are recursively calculated as follows:(13)
p (Root) 1, and for other modelsp (M) (14)Level ( M ) p( Path( M )i 2i Path( M ) i 1 )where Path(M) (Root, ,M) is the N-tuple (N Level(M)) of nodes defining the pathin T from Root to M. The distribution associated to the hierarchical model is a mixture of leaf models,p (t T ) p ( M ) p (t M )(15)M Leaves (T )The training of the HGTM is straightforward and proceeds in a recursive fashion (topdown):1. A root GTM is trained and used to generate an overall visualization of the data set.2. The user identifies regions of interest on the visualization map.3. These regions of interest are transformed into the data space and form the basis forbuilding a collection of new, child GTMs.4. The EM algorithm works with responsibilities (posterior probabilities of unitmembership given data observations) moderated by the parent-conditional priorpreviously described.5. After assessing the lower level visualization maps, the user may decide to proceedfurther and model in greater detail some specific portions of these.An automated initialization, resorting to Minimum Description Length (MDL)principles, can be implemented to choose the number and location of sub-models.4ConclusionsIn this brief paper, we have reviewed a number of recent advances on the development ofunsupervised hierarchical models for data visualization and clustering. The setting of dataexploration elements, such as clustering and visualization, into a hierarchical frameworkaugments the amount of information about a data set that models manage to convey.Most real-world problems entail complex data sets that seldom provide enoughinformation in a single snapshot, and interactive hierarchical methods are more likely toprovide an adequate insight into the fine details of the structure of data patterns.Two sub-groups of models have been considered: Heuristic Hierarchical Models andProbabilistic Hierarchical Models. Many advantages can be expected from the definitionof data analysis models according to principled probabilistic theory, amongst them thepossibility of developing these models in a coherent way.References1.2.3.4.Kohonen, T.: Self-Organizing Maps. Berlin: Springer Verlag (1995)Kohonen, T.: Self-organized formation of topologically correct feature maps. BiologicalCybernetics, 43(1), (1982) 59-69Bishop, C.M. & Tipping, M.E.: A hierarchical latent variable model for data visualization.IEEE Transactions on Pattern Analysis and Machine Intelligence, 20(3), (1998) 281-293Alahakoon, D., Halgamuge, S.K. & Srinivasan, B.: Dynamic self-organizing maps withcontrolled growth for knowledge discovery. IEEE Transactions Neural Networks, 11(3),(2000) 601-614
5.6.7.8.9.10.11.12.13.14.15.16.17.18.19.Blackmore, J. & Miikkulainen, R.: Incremental grid growing: Encoding high-dimensionalstructure into a two-dimensional feature map. In Proceedings of the International Conferenceon Neural Networks (ICANN’93). San Francisco, CA, (1993) 450-455Fritzke, B.: Growing grid – a self-organizing network with constant neighborhood range andadaptation strength. Neural Processing Letters, 2(5), (1995) 1-5Miikkulainen, R.: Script recognition with hierarchical feature maps. In Connection Science, 2,(1990) 83-101Merkl, D.: Exploration of text collections with hierarchical feature maps. Proceedings of theAnnual International ACM SIGIR Conference on Research and Development in InformationRetrieval (SIGIR’97), Philadelphia, USA (1997)Luttrell, S. P.: Hierarchical self-organizing networks. In Proceedings of the InternationalConference on Neural Networks (ICANN'89). London, U.K (1989) 2-6Lampinen, J. & Oja, E.: Clustering properties of hierarchical self-organizing maps. Journal ofMathematical Imaging and Vision, 2, (1992) 261-272Kohonen, T., Kaski, S., Lagus, K. & Honkela, T.: Very large two-level SOM for the browsingof newsgroups. In Proceedings of the International Conference on Neural Networks(ICANN'96), Bochum, Germany (1996) 269-274Koikkalainen, P. & Oja, E.: Self-organizing hierarchical feature maps. In Proceedings of theInternational Joint Conference on Neural Networks. San Diego, California, U.S.A. 2, (1990)279-284Dittenbach, M, Merkl, D. & Rauber, A.: The growing hierarchical self-organizing map. InProceedingsof the International Joint Conference on Neural Networks. (IJCNN 2000), Como,Italy 6, (2000) 15-19Dittenbach, M, Rauber, A. & Merkl, D.: Uncovering the hierarchical structure in data usingthe growing hierarchical self-organizing map. Neurocomputing 48(1–4), (2002) 199–216.Jaynes, E.: Probability Theory: The Logic of Science. Cambridge University Press (2003)Cerquides, J.: Improving Bayesian Network Classifiers. PhD Thesis. U.P.C. Barcelona. Spain(2003)Dempster, A.P., Laird, N.M., & Rubin, D.B.: Maximum likelihood from incomplete data viathe EM algorithm. Journal of the Royal Statistical Society, B ,39, (1977) 1-38Bishop, C.M., Svensén, M., & Williams, C.K.I.: GTM: the generative topographic mapping.Neural Computing, 10, (1998) 215-234Ti o, P. & Nabney, I.: Hierarchical GTM: constructing localized non-linear projectionmanifolds in a principled way. IEEE Transactions on Pattern Analysis and MachineIntelligence, 24(5), (2002) 639-656.
Approaches to hierarchical data visualization incorporating SOM entail a "hard" data partition, while probabilistic models allow a "soft" partitioning in which, at any level of hierarchy, data points can effectively belong to more than one model. Fig. 1. An example of a hierarchical model, where more details on the structure of the data are