Transcription
PDHonline Course M226 (5 PDH)Psychrometric Chart Fundamentals andits application to HVAC TroubleshootingInstructor: Timothy D. Blackburn, MBA, PE2012PDH Online PDH Center5272 Meadow Estates DriveFairfax, VA 22030-6658Phone & Fax: 703-988-0088www.PDHonline.orgwww.PDHcenter.comAn Approved Continuing Education Provider
www.PDHcenter.comPDH Course M226www.PDHonline.orgPsychrometric Chart Fundamentals and its application to HVAC TroubleshootingBy: Timothy D. Blackburn, PE, MBACourse ContentIntroductionIf HVAC problems and challenges are to be properly diagnosed and designed, it is essential thatthe Psychrometric chart and psychrometrics in general be clearly understood. This course will review theessential elements of psychrometrics (the behavior of mixtures of air and water vapor under varyingconditions of heat) and the chart that represents it. With this knowledge, you will be able to understandmany of the HVAC challenges that are certain to arise, as well as anticipate problems before they occurand incorporate in your design.Like many self-study courses, you will only get as much from it as you put into it. Plot each stepon your own psychrometric chart. Be certain you understand the basics before studying the examples. Tryto solve the examples for yourself. This is not the type of course you can just read through and take theQuiz – it will take effort. But if you do your best, you should be able to pass the Quiz with ease – whetherbeginner or advanced.Disclaimer – Nothing in this course should be considered consulting engineering for your specificapplication – each situation requires individual analysis.Definitions and ConceptsIt is important to understand the primary concepts and definitions before we begin our study. For someof you, this will be a refresher, and for others an introduction. There are other courses that cover thefundamentals in more detail, but the following are the minimum essentials.Page 1 of 38
www.PDHcenter.comPDH Course M226www.PDHonline.org HVAC – Heating, Ventilation, and Air conditioning Psychrometrics –The behavior of mixtures of air and water vapor under varying conditions of heat Enthalpy Total heat in the air Sensible plus Latent heat Sensible Heat – Changes in temperature that do not alter the moisture content of air Latent Heat – Related to level of moisture in the airBTU (British Thermal Unit) – The amount of heat that must be added to or subtracted from a pound ofwater at 60oF to affect a temperature change of 1oF BTUH or BH – BTU’s per hour MBH – 1000 BTUHTon 1 Ton equals the amount of heat needed to melt 1 ton of ice in one day 12,000 BTUH’sDrybulb Temperature – The temperature reading given by a dry thermometer that gives a directindication as to the sensible heat content of air Wetbulb Temperature – The temperature reading from a wetted bulb that gives a direct indication as tothe total heat content of air Dew Point Temperature – Temperature at which air will begin to release moisture. Relative Humidity (RH) The actual amount of moisture in the air expressed as a percentage of the amount of moisture the airis capable of holding. More technically: The amount of water vapor in the air divided by the amount of water vapor the air can hold (atthe same temperature and pressure.)Page 2 of 38
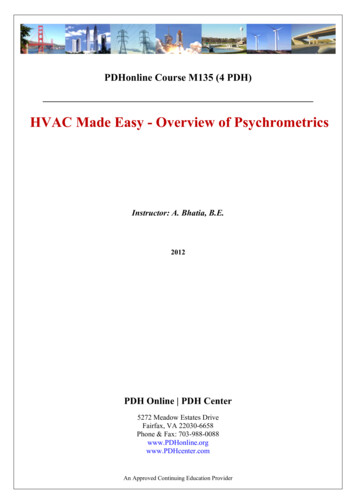
www.PDHcenter.com PDH Course M226www.PDHonline.orgThe ratio of the air's vapor pressure to its saturation vapor pressure.Example: An air sample that is at 50% RH is holding half the moisture it is capable of holding at thesame temperature (at dew point or saturated.) RH is inversely relational to temperature for the same moisture level (grains of moisture per poundof dry air) – warm air can hold more moisture RH is what we sense High RH: Sticking, mold Low RH Affects electronics, promotes static Low RH air is seeking saturation, absorbing moisture wherever it canSpecific Humidity or Humidity Ratio The weight of the water vapor in each pound of dry air Typically grains of moisture/pound of dry air Grain 1/7000 pound Density – Unit weight of dry air at a given temperature and moisture content, #/ft3 Specific Volume – Space occupied by dry air at a given temperature and moisture content (thereciprocal of density), ft3/#The Psychrometric Chart TemplatePause and print off the next page. Make multiple copies, as you will need them in the course. As notedpreviously, if you are to benefit from the course, you must plot each step for yourself. There are noshortcuts in learning this material. The smaller example charts are not intended for you to plot on, butrather instruction – use a clean larger copy to plot each example.Page 3 of 38
www.PDHcenter.comPDH Course M226PSYCHRO M ETRIC CHART7570Sea Levelwww.PDHonline.org8085903001.9BARO METRIC PRESSURE 29.921 inches of .6240BULB90TEAIR50DR Y- FREAT UPE RT EMIONRATSATU9 0%70.975.870.665606070.5.4506510706545%30%75IDH UMT IV E80IT Y20108590956050.34035.2302520.155100-40100 105 110 115 120 125 130 135 140 145 150 155 160 165 170 175 18050DRY BULB TEMPERATURE - FLinric Company Psychrometric Chart, 4050403510150851.3DEW POINT - FOFNDPOUER- BTUPEN THA 10- lb OF6515-15E³/ME .0801.5220R1908530-5PE854025M9045902301520Page 4 of 382530354045ENTHALPY - BTU PER POUND OF DRY AIRETVAPOR PRESSURE - INCHES OF MERCURYWHUMIDITY RATIO - GRAINS OF MOISTURE PER POUND OF DRY AIR9555
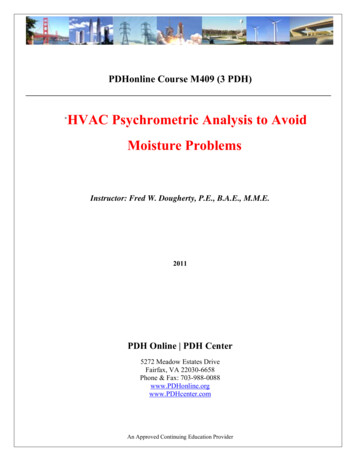
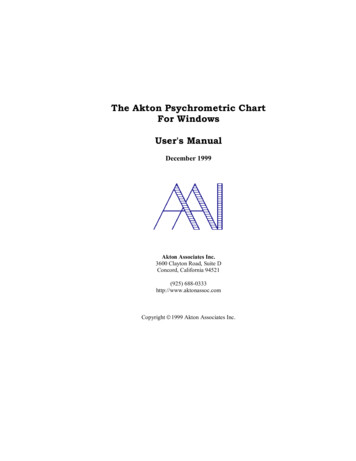
www.PDHcenter.comPDH Course M226www.PDHonline.orgThe Psychrometric Chart – an OverviewBefore we proceed further in our study, let’s learn or refresh regarding the Psychrometric chart. Thefollowing is a summary of the major elements on the chart. Do not continue to the next section until youcan find the following on the chart. Constant Drybulb Temperature: Vertical Lines Constant Dew Point and Humidity Ratio: Horizontal Lines Constant Wetbulb temperature: Upward left sloping lines Relative humidity: Curving lines (100% line is the saturation curve or correlates with Dew Point) Constant specific volume, ft3/# of dry air: Nearly-vertical sloping lines Enthalpy or total heat, BTU/pound of air: Staggered scale left of saturation curve and left slopinglines Humidity Ratio: Right hand scale, grains of moisture/pound of dry air Saturation Curve: 100% RH Curve (or the point at which an air mixture can hold no additionalmoisture at a given temperature); temperature on the curve is the Dew PointThe following is a chart with the above noted (note: this is a standard curve is at Sea Level).Page 5 of 38
www.PDHcenter.comPDH Course M226PSYCHROMETRIC CHART7570Sea Levelwww.PDHonline.org8085903001.9Heavy Text Bullet Slide SampleBAROMETRIC PRESSURE 29.921 inches of E HU8545.34035.2302520.155100-40100 105 110 115 120 125 130 135 140 145 150 155 160 165 170 175 18050DRY BULB TEMPERATURE - FLinric Company Psychrometric Chart, www.linric.com10157065606017575.70%VELATI10% R401DEW POINT - e 6 of 382530354045ENTHALPY - BTU PER POUND OF DRY 001607065555-517011080%6545-10 -5-25 -20 -15807555-30 -25 -20 -15 -108751807050108030105190 FTEMPERATURESATURA TION635200VAPOR PRESSURE - INCHES OF MERCURYAIRDRYOFOUNDERPY-BTUP40901.4210- F85851.5220RATURE904590230TEMPEHUMIDITY RATIO - GRAINS OF MOISTURE PER POUND OF DRY AIR901515BULB5060-5240IRRY AOF D8.WETE ft³/lbLU 14.0Constant dry bulb temperatureConstant Dew Point andHumidity RatioConstant wet bulb temperatureRelative humidity (100% line isthe saturation curve or DewPoint)Constant specific volume, ft3/#of dry airEnthalpy or total heat,BTU/pound of airHumidity ratio or grains ofmoisture per pound of dry airSaturation curve – 100%humidity line or the point atwhich an air mixture can holdno additional moisture at agiven temperature;25temperature on the curve is20the dewpointENTH1.2.17.016.0601.8270
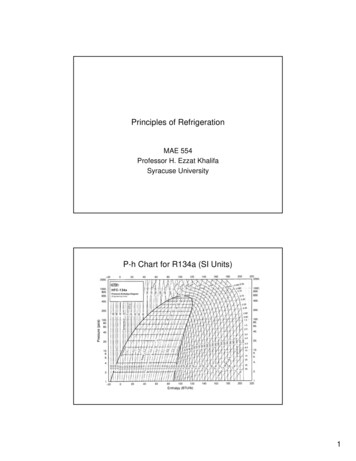
www.PDHcenter.comPDH Course M226www.PDHonline.orgLatent versus Sensible ChangesIn the next graph, let’s look at changes in Latent versus Sensible changes. Latent changes move inthe “Y” axis (associated with moisture content changes), and Sensible changes move in the “X” axis(associated with temperature but not moisture content changes.)PSYCHROMETRIC CHART7570Sea Level808590300Heavy Text Bullet Slide SampleBAROMETRIC PRESSURE 29.921 inches of 501.6240ET90NDOFDRYAIRTURE- FPOUPERERABTUIONTY-EMPAIRDRYSATURATlb OFEN 00 105 110 115 120 125 130 135 140 145 150 155 160 165 170 175 18050DRY BULB TEMPERATURE - FLinric Company Psychrometric Chart, www.linric.com75656070YMIDITVE HUELATI10% R6080.78020%551.21.1DEW POINT - F153013.050-5-25 -20 -15 0505-30 -25 -20 -15 IC757065180SPE807525Latent20015.080901.4210- 0Page 7 of 382530354045ENTHALPY - BTU PER POUND OF DRY AIRWVAPOR PRESSURE - INCHES OF MERCURY9555HUMIDITY RATIO - GRAINS OF MOISTURE PER POUND OF DRY AIRSensible versusLatent: Sensiblechanges arehorizontal, andLatent changes arevertical
www.PDHcenter.comPDH Course M226www.PDHonline.orgRelationship of Dewpoint, RH, Wetbulb, and DrybulbThe following chart provides an example to determine Dewpoint, RH, Wetbulb, or Drybulb if onlytwo of the criteria are known. Drybulb is read with a typical thermometer. When I was in engineeringschool, we determined Wetbulb by using a sling psychrometer. In it was a Drybulb, plus anotherthermometer with a wet gauze. The Wetbulb reading was affected by the moisture content in the air; thelower the air moisture content, the faster the gauze evaporated and the cooler the temperature reading.Today, electronic instrumentation is generally used.PSYCHROMETRIC CHART7570Sea Level8085903001.9Heavy Text Bullet Slide SampleBAROMETRIC PRESSURE 29.921 inches of Mercury29065100280Relationship ofDewpoint, RH,Wetbulb, andDrybulb: Example:What is the Wetbulb temperature of70oF air at 50% TIV% 55100-40100 105 110 115 120 125 130 135 140 145 150 155 160 165 170 175 180DB50DRY BULB TEMPERATURE - FLinric Company Psychrometric Chart, www.linric.com10157055%757565605020%6080.7DEW POINT - 180RH55352560508520Page 8 of 382530354045ENTHALPY - BTU PER POUND OF DRY AIRIR120851.3VAPOR PRESSURE - INCHES OF MERCURY FERATURTEMPEIONRATSATUADRY130HUMIDITY RATIO - GRAINS OF MOISTURE PER POUND OF DRY 5515040353025016014.0WBDP00807565400170lb OF205-5807545-5-25 -20 -15 -10180ft³/UMEVOL3555-30 -25 -20 -15 -10200CIFICSPE40901.4210- B9030155WET9025-59550What is the DewPoint? 17.016.0601.8270
www.PDHcenter.comPDH Course M226www.PDHonline.orgImpact to Relative Humidity from Sensible ChangesThe following chart illustrates the impact to Relative Humidity from changes in temperature (whenmoisture content remains constant.) You will note that Temperature and Relative Humidity are inverselyrelational – the higher the temperature, the lower the RH. The lower the temperature, the higher the RH.PSYCHROMETRIC CHART7570Sea Level808590300Heavy Text Bullet Slide SampleBAROMETRIC PRESSURE 29.921 inches of 501.6120 556065.6.56055.4%30201010YMIDITE HULATIV% RE7580859095605045.34035.2302520.155100-40100 105 110 115 120 125 130 135 140 145 150 155 160 165 170 175 18050DRY BULB TEMPERATURE - FLinric Company Psychrometric Chart, www.linric.com107065606020%70757050%6580.7DEW POINT - F30358080%20251.11520Page 9 of 382530354045ENTHALPY - BTU PER POUND OF DRY AIR1301.2VAPOR PRESSURE - INCHES OF MERCURYAIRDRYPOUPERY-BTUENTHALPSATURATIRRY AOF 001106560550FIFICPEC6510-575901.4210- 7015-10 -5-25 -20 -15807525-30 -25 -20 -15 015BULB9030Answer: 84.85%1024090What if we cool to55oF instead?5WET50Answer: 25.98%-59555HUMIDITY RATIO - GRAINS OF MOISTURE PER POUND OF DRY AIRSensible Changes:Example: If we heat70oF at 50% RH to90oF without addingmoisture, what is thenew RH?
www.PDHcenter.comPDH Course M226www.PDHonline.orgDehumidificationAs we saw in the previous section, when the temperature cools the RH increases. What happenswhen the RH is 100%? It rains. As cools, it eventually reaches its dewpoint and moisture begins toappear. That is what happens when you have a glass of iced tea, and there is moisture on the outside – theair in the immediate vicinity of the glass cools to the point it is fully saturated, and out comes moisture. Inthe following example, we continue on with the previous example to examine what happens when wecontinue to cool.PSYCHROMETRIC CHART7570Sea Level808590300Heavy Text Bullet Slide SampleBAROMETRIC PRESSURE 29.921 inches of 501.6240BULB90TEAIR50DRYOF190RATURE- RATIONALP200lb OFENTHFft³/UMEVOL35- %6560801.975.8706545-501050-55151012.00-5-25 -20 -15 -101052015152020252530303540453013.03525-30 -25 -20 -15 -10403050%3020%20YMIDITVE HUELATI10% R556065.5.4454040350.6707580859095106050DEW POINT - F5.34035.2302520.155100-40100 105 110 115 120 125 130 135 140 145 150 155 160 165 170 175 18050DRY BULB TEMPERATURE - FLinric Company Psychrometric Chart, 0Answer: 50.53oF isthe Dew Point.Cooling below thatpoint removes waterMPERAT9045902301520Page 10 of 382530354045ENTHALPY - BTU PER POUND OF DRY AIRWETVAPOR PRESSURE - INCHES OF MERCURY9555HUMIDITY RATIO - GRAINS OF MOISTURE PER POUND OF DRY AIRDehumidification:In the previousexample, whathappens when I coolbelow 50.53oF?
www.PDHcenter.comPDH Course M226www.PDHonline.orgHumidificationIn the previous example, we learned that we can de-humidify the air by over cooling it. But to addhumidity we must have an external source of moisture. The following example illustrates that we can plotthe results of adding moisture on the Psychrometric chart.PSYCHROMETRIC CHART7570Sea Level808590300Heavy Text Bullet SlideSampleNote: SteamBAROMETRIC PRESSURE 29.921 inches of 4013012070%704501050-551012.00-10 -5-25 -20 07570.765.66560.5.4ELATIV% 0-40100 105 110 115 120 125 130 135 140 145 150 155 160 165 170 175 18050DRY BULB TEMPERATURE - FLinric Company Psychrometric Chart, 30 -25 -20 -15 F901.4210F1520Page 11 of 382530354045ENTHALPY - BTU PER POUND OF DRY AIR FPERATURE-220IRRY AOF DSATURAT- 1.5VAPOR PRESSURE - INCHES OF �/lbUMEVOL35TEMPERATIFICPECWhat is the newDP?BULB1.6240S15.0Answer: 60.81%WET250HUMIDITY RATIO - GRAINS OF MOISTURE PER POUND OF DRY AIR905095increases s enthalpyand lowerstemperature955540951.726095451.8270DEW POINT - FHumidification: At70oF and 50% RH,what is the new RHwhen we add 12gr/lb of moisture?17.016.060Answer:1.929065
www.PDHcenter.comPDH Course M226www.PDHonline.orgEnthalpy ChangesEnthalpy represents the total heat in the air, a summation of Sensible and Latent. Enthalpy ismeasured in BTU/# dry air, and can be determined if you know at least two primary chart parameters. Aswell, when you condition the air, there is a change in enthalpy that can be calculated. The followingexample illustrates how Enthalpy changes can be calculated, as well as changes to enthalpy.PSYCHROMETRIC CHART7570Sea Level808590300Heavy Text Bullet Slide SampleBAROMETRIC PRESSURE 29.921 inches of 501.6 01.975.8704550556065.6.56055.4%30201010YMIDITE HULATIV% RE7580859095605045.34035.2302520.155100-40100 105 110 115 120 125 130 135 140 145 150 155 160 165 170 175 18050DRY BULB TEMPERATURE - FLinric Company Psychrometric Chart, www.linric.com107065606020%70757050%6580.7DEW POINT - 851.31520Page 12 of 382530354045ENTHALPY - BTU PER POUND OF DRY AIRAIRDRYPOUPERY-BTUENTHALP655501707010-5180IRRY AOF D757515-10 -5-25 -20 -15200ft³/lbUMEVOL803060-30 -25 -20 -15 -10FIFICPEC80901.4210- BULB9020524050Answer: 33.6825.33 8.35BTU/Lb Dry Air-5WETVAPOR PRESSURE - INCHES OF MERCURY9555HUMIDITY RATIO - GRAINS OF MOISTURE PER POUND OF DRY AIREnthalpy Changes:Example: What isthe change inenthalpy when yougo from 70F/50%RH to 80F/60% RH?
www.PDHcenter.comPDH Course M226www.PDHonline.orgHeating CyclesHeating cycles can be graphically illustrated on the chart. The following illustrates a typicalheating cycle of an HVAC system.PSYCHROMETRIC CHART7570Sea Level808590300Heavy Text Bullet Slide SampleBAROMETRIC PRESSURE 29.921 inches of 501.612090%1107010080%5 04 (SA)%ELATIV% 100-40100 105 110 115 120 125 130 135 140 145 150 155 160 165 170 175 18050DRY BULB TEMPERATURE - FLinric Company Psychrometric Chart, www.linric.com75.7500%20%5575601040.98055301 (OA)20170%30805041.21.180%151525851520Page 13 of 382530354045ENTHALPY - BTU PER POUND OF DRY AIR FPERATURETEMIONSATURAT130851.3VAPOR PRESSURE - INCHES OF MERCURYAIRDRYERPBTUPYALPENTH140AIRDRY12.01010150lb 5075652 (RA)60505CIFICSPE653 45(MA)020018075550F7010-5803015-5-25 -20 -15 -1080901.4210- 30 -25 -20 -15 -10BULB902510240502015WETDEW POINT - FOutside Air (1) is mixed withroom Return Air (2) andresults in Mixed Air (3).Mixed Air is heated upto (4). Humidity may beadded to (5), the SupplyAir or via spacehumidifiers. The roomabsorbs heat (andmoisture with ventilationor special process, etc.)resulting in Return Air(2).-59555HUMIDITY RATIO - GRAINS OF MOISTURE PER POUND OF DRY AIRHeating Cycle
www.PDHcenter.comPDH Course M226www.PDHonline.orgCooling CycleSimilar to the previous example, the Cooling Cycle can also be plotted on the Chart as follows.PSYCHROMETRIC CHART7570Sea Level8085903001.9Heavy Text Bullet Slide SampleBAROMETRIC PRESSURE 29.921 inches of .624090AIR50URE- FPOUPERRATY-15014075130DRYSATU80lb OFR ATIONTALP160³/ME 30757090%11070%%403525501050-551012.00-5-25 -20 -15 -102015152020252530302 570.66560.5.4605045.34035.2302520.155100-40100 105 110 115 120 125 130 135 140 145 150 155 160 165 170 175 18050DRY BULB TEMPERATURE - FLinric Company Psychrometric Chart, 13.040301%40453508050501.21.1703 (MA)%554 (SA)585505045-30 -25 -20 -15 -106090851.3806055101 (OA)14.0151015706560-510080%652520901.4210- F190851.522085NDOFDRY904590230TEMPERATURE20Page 14 of 382530354045ENTHALPY - BTU PER POUND OF DRY AIRBULBDEW POINT - FOutside Air (1) is mixed withroom Return Air (2) andresults in Mixed Air (3).Mixed Air is cooled anddehumidified tosaturation to (4). Theroom heat and moistureis transferred to to theReturn Air (2).WETVAPOR PRESSURE - INCHES OF MERCURY9555HUMIDITY RATIO - GRAINS OF MOISTURE PER POUND OF DRY AIRCooling Cycle
www.PDHcenter.comPDH Course M226www.PDHonline.orgTry it yourself! (A Pop Quiz)(This isn’t the official course Quiz)Now that you have reviewed (or learned) the basics of psychrometrics and the chart, give a try toanswer the following (Print off this page and the Chart at the beginning of the course; circle the bestanswer):For an air mixture of 74F and 45% RH, determine the following:1.What is the dewpoint ?a)51b)41c)652.What is the enthalpy?a)11 BTU/# Dry Airb)27 BTU/# Dry Airc)31 BTU/# Dry Air3.How many grains of moisture/# dry air?a)33b)40c)564. What is the specific volume in cf/# dry air?Page 15 of 38
www.PDHcenter.comPDH Course M226a. 13.6b. 11.2c. 12.15.What is the wetbulb temperature?a.50b.60c.74Page 16 of 38www.PDHonline.org
www.PDHcenter.comPDH Course M226www.PDHonline.orgPop Quiz AnswersThe following are the correct answers: 1-a; 2-b; 3-c; 4-a; 5-b. How well did you do? If youstruggled with this, the following are the Charts that give a step-by-step illustration – compare it to yourchart.PSYCHROMETRIC CHART7570Sea Level808590300Heavy Text Bullet Slide SampleBAROMETRIC PRESSURE 29.921 inches of 501.624090AIR50DRYOF 130AIRDRY30170lb 207090%1102070%%3501050-551012.00-5-25 -20 -15 51070.66560.5.470E HULATIV% 40100 105 110 115 120 125 130 135 140 145 150 155 160 165 170 175 18050DRY BULB TEMPERATURE - FLinric Company Psychrometric Chart, 06040401.21.170%50585505545-30 -25 -20 -15 01.4210- 85851.5220URE904590230TEMPERAT1520Page 17 of 382530354045ENTHALPY - BTU PER POUND OF DRY AIRBULBVAPOR PRESSURE - INCHES OF MERCURYWETHUMIDITY RATIO - GRAINS OF MOISTURE PER POUND OF DRY AIR9555DEW POINT - FStep 1: Plot theconditions – pick apoint at 74oF DBand 45% RH
www.PDHcenter.comPDH Course M226PSYCHROMETRIC CHART7570Sea Levelwww.PDHonline.org808590300Heavy Text Bullet Slide SampleBAROMETRIC PRESSURE 29.921 inches of 501.62409050AIRDRYOF THlb .870656070.6.5.4506510706560%%30E HULATIV% 40100 105 110 115 120 125 130 135 140 145 150 155 160 165 170 175 18050DRY BULB TEMPERATURE - FLinric Company Psychrometric Chart, 15014.04030016040350-57540505-5-25 -20 -15 -10605545-30 -25 -20 -15 3020-5F15.0 Read HumidityRatio on the right,56.37 grains/poundof dry air- 19085901.4210854035220URE90451.5DEW POINT - F Read Dewpoint onthe left at the 100%saturation curve,51.34oF90230TEMPERAT1520Page 18 of 382530354045ENTHALPY - BTU PER POUND OF DRY AIRBULBVAPOR PRESSURE - INCHES OF MERCURYWETHUMIDITY RATIO - GRAINS OF MOISTURE PER POUND OF DRY AIRStep 2: Draw ahorizontal line.9555
www.PDHcenter.comPDH Course M226PSYCHROMETRIC CHART7570Sea Levelwww.PDHonline.org808590300Heavy Text Bullet Slide SampleBAROMETRIC PRESSURE 29.921 inches of 501.6240BULB90AIR50OFDRY9045190 0Y AIRSATURAT35180ROF 554045-501050-55151012.0-10 -5-25 -20 -1510502015152020252530303540455060%3020ITYUMIDVE HELATI10% .34035.2302520.155100-40100 105 110 115 120 125 130 135 140 145 150 155 160 165 170 175 18050DRY BULB TEMPERATURE - FLinric Company Psychrometric Chart, www.linric.com75.75020%55808055%3013.025-30 -25 -20 -15 15307065600100%652520901.4210- F85851.5220URECIFICSPEAt the saturationcurve Wet Bulb 60oFPERAT15.0Enthalpy 26.57BTU/# dry air90230TEM1520Page 19 of 382530354045ENTHALPY - BTU PER POUND OF DRY AIRETVAPOR PRESSURE - INCHES OF MERCURYWHUMIDITY RATIO - GRAINS OF MOISTURE PER POUND OF DRY AIR9555DEW POINT - FStep 3: Drawdiagonal lines andread
www.PDHcenter.comPDH Course M226PSYCHROMETRIC CHART7570Sea Levelwww.PDHonline.org8085903001.9Heavy Text Bullet Slide SampleBAROMETRIC PRESSURE 29.921 inches of .6240BULB90AIR50RYOFDND190URE- 70lb OFR ATIONTALP35180ft³/UMEVOLBTU- 5.870654550%3020ITYUMIDVE HELATI10% 5100-40100 105 110 115 120 125 130 135 140 145 150 155 160 165 170 175 18050DRY BULB TEMPERATURE - F107065600%2 0%Linric Company Psychrometric Chart, www.linric.com75.7DEW POINT - F25.980553013.001050-51512.0-5-25 -20 -15 45-30 -25 -20 -15 Page 20 of 382530354045ENTHALPY - BTU PER POUND OF DRY AIRWETVAPOR PRESSURE - INCHES OF MERCURY9555HUMIDITY RATIO - GRAINS OF MOISTURE PER POUND OF DRY AIRStep 4: Draw a lineparallel to thespecific volume 13.6 ft3/# dry air
www.PDHcenter.comPDH Course M226www.PDHonline.orgHVAC Troubleshooting ExamplesNow lets consider some specific HVAC troubleshooting examples. Before looking at the chartsprovided with the answers, try to plot the information yourself. If you don’t do this, you will not be ableto follow the examples. Some of the examples will be more challenging than others – if you don’t have aHVAC background, you likely will struggle at some points. Don’t be overly alarmed. If you have astrong grasp to this point, you are well on your way and passing the Quiz should be no problem. The goalfor the student is to be able to use the Psychrometric chart to solve virtually any HVAC problem/challengethat involves air temperature/moisture issues.HVAC Troubleshooting Example #1You have a complaint of moisture condensing in a cooling chamber in a packaging line. You find youneed to cool the chamber to 40oF. The desired room temperature is 70oF. A. What relative humidity in the space is needed? Answer: To keep the condensation from occurring, keep the RH below 100% (say 90%) at thecooling chamber temperature (40oF). Plot this condition, and draw a horizontal line thatintersects 70oF and read the RH, which is 30.15% (Note: This is very low and uncomfortable foroccupants – consider a local environment) B. Answer: The lowest discharge temperature of the airhandler is 52oF. Can you satisfy theconditions needed above? No. Plot from 52oF and 90% RH horizontally to 70oF, and the minimum RH expected is 47.51% 30.15% - condensation will occur. (To lower further would require more expensive systems.)Page 21 of 38
www.PDHcenter.comPDH Course M226PSYCHROMETRIC CHART7570Sea Levelwww.PDHonline.org8085903001.9Heavy Text Bullet Slide SampleBAROMETRIC PRESSURE 29.921 inches of .6240BULB90AIR50RYOFDND190URE- 70lb OFR ATIONTALP35180ft³/UMEVOLBTU- 5.870654550%3020ITYUMIDVE HELATI10% 5100-40100 105 110 115 120 125 130 135 140 145 150 155 160 165 170 175 18050DRY BULB TEMPERATURE - F107065600%2 0%Linric Company Psychrometric Chart, www.linric.com75.7DEW POINT - F25.980553013.001050-51512.0-5-25 -20 -15 45-30 -25 -20 -15 Page 22 of 382530354045ENTHALPY - BTU PER POUND OF DRY AIRWETVAPOR PRESSURE - INCHES OF MERCURY9555HUMIDITY RATIO - GRAINS OF MOISTURE PER POUND OF DRY AIRExample #1
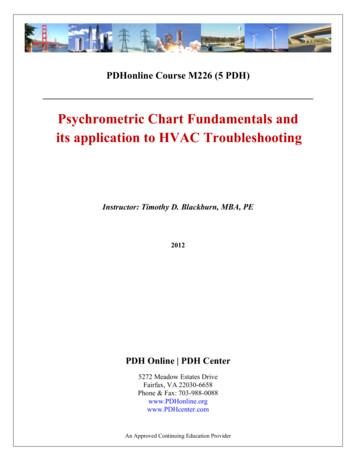
www.PDHcenter.comPDH Course M226www.PDHonline.orgHVAC Troubleshooting Example #2 You would like to humidify a space that has a 100% outside air unit to 50% RH in the winter, andwould like to keep the discharge RH from exceeding 80% (ignoring any latent gains in the space).However, you get frequent low humidity alarms in the winter. Why? First, check to see if the Psychrometrics are possible. Plot the conditions off the coil, 52oF discharge at 80%, and draw a horizontal line to 70oF. Themaximum RH possible is 42.23% 50% - system will not reach conditions under some winteroutside air possibilities. Note: It may be possible to raise the discharge temperature to absorb more moisture and/or raisepermitted RH after the coil.Page 23 of 38
www.PDHcenter.comPDH Course M226PSYCHROMETRIC CHART7570Sea Levelwww.PDHonline.org8085903001.9Heavy Text Bullet Slide SampleBAROMETRIC PRESSURE 29.921 inches of .6240BULB90AIR50RYOFDND190URE- 70lb OFR ATIONTALP35180ft³/UMEVOLBTU- 5.870654550%3020ITYUMIDVE HELATI10% 5100-40100 105 110 115 120 125 130 135 140 145 150 155 160 165 170 175 18050DRY BULB TEMPERATURE - F107065600%2 0%Linric Company P
Psychrometric Chart Fundamentals and its application to HVAC Troubleshooting By: Timothy D. Blackburn, PE, MBA Course Content Introduction If HVAC problems and challenges are to be properly diagnosed and designed, it is essential that the Psychrometric chart and psychrometrics in g