Transcription
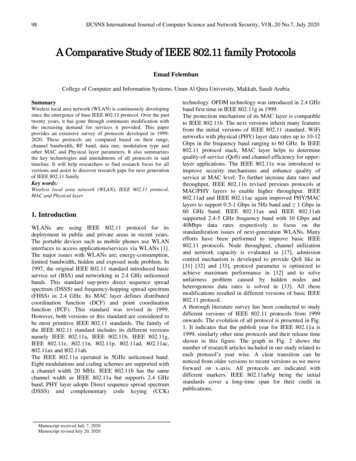
302IEEE TRANSACTIONS ON VISUALIZATION AND COMPUTER GRAPHICS,VOL. 10,NO. 3,MAY/JUNE 2004Hierarchical Data Visualization Usinga Fast Rectangle-Packing AlgorithmTakayuki Itoh, Member, IEEE Computer Society, Yumi Yamaguchi,Yuko Ikehata, and Yasumasa KajinagaAbstract—This paper presents a technique for the representation of large-scale hierarchical data which aims to provide goodoverviews of complete structures and the content of the data in one display space. The technique represents the data by using nestedrectangles. It first packs icons or thumbnails of the lowest-level data and then generates rectangular borders that enclose the packeddata. It repeats the process of generating rectangles that enclose the lower-level rectangles until the highest-level rectangles arepacked. This paper presents two rectangle-packing algorithms for placing items of hierarchical data onto display spaces. Thealgorithms refer to Delaunay triangular meshes connecting the centers of rectangles to find gaps where rectangles can be placed. Thefirst algorithm places rectangles where they do not overlap each other and where the extension of the layout area is minimal. Thesecond algorithm places rectangles by referring to templates describing the ideal positions for nodes of input data. It places rectangleswhere they do not overlap each other and where the combination of the layout area and the distances between the positions describedin the template and the actual positions is minimal. It can smoothly represent time-varying data by referring to templates that describeprevious layout results. It is also suitable for semantics-based or design-based data layout by generating templates according to thesemantics or design.Index Terms—Hierarchical data, Delaunay triangular mesh, rectangle packing.æ1INTRODUCTIONTHERE are various kinds of hierarchical data around usand it is therefore important to provide visualizationsystems for such data. Some of them first represent higherlevel portions of the hierarchical data and provide userinterfaces to interactively explore lower-level portions.Others represent the overview of the data by placing allportions into display spaces.Tree-based representation methods [5], [12], [13] providegood interfaces for exploring hierarchical data. Thesemethods often first place a specific node (i.e., the node atthe top of the hierarchy or a user-specified node) at thecenter of a display space and then place child nodes aroundthe focal node. They do not always display all parts of thehierarchical data, but provide an interface to select andfocus on the parts users are interested in. These interfacesare especially useful for navigation by end users.On the other hand, some other visualization methodsprovide good views of entire hierarchical data sets.Treemap [1], [2], [4], [11], [18] is a well-known space-fillingvisualization technique that places all parts of the data ontoone display space. The technique proposed in this paper iscloser to the space-filling techniques rather than the treebased techniques.This paper presents a technique that represents hierarchical data in compact display spaces. The techniquerepresents hierarchical data as a set of nested rectangles, in. The authors are with IBM Research, Tokyo Research Laboratory, 1623-14Shimo-tsuruma, Yamato-shi, Kanagawa 242-8502 Japan.E-mail: {itot, yyumi, ikehata, kajinaga}@trl.ibm.com.Manuscript received 16 Mar. 2003; revised 22 Sept. 2003; accepted 14 Oct.2003.For information on obtaining reprints of this article, please send e-mail to:tvcg@computer.org, and reference IEEECS Log Number TVCG-0002-0103.1077-2626/04/ 20.00 ß 2004 IEEEcontrast to many existing tree-based data visualizationtechniques. Fig. 1 is an example of a representation usingour technique. It first packs rectangular icons or thumbnailsthat denote leaf nodes under a nonleaf node withoutoverlapping each other and encloses them by a rectangularborder that denotes the nonleaf node. It then repeats theprocess, enclosing the sets of nodes by rectangles, from thelowest level to the highest level. It finally places all of thepieces of hierarchical data onto a display area.We were motivated to develop the presented techniqueby the requirements for the visualization of Web sites. Themain requirement was monitoring the attributes of thousands of Web pages, where the attributes include accessfrequency and last update time. We therefore aimed to packthousands of icons representing Web pages into one displayspace. We avoided the overlap of icons so that all icons canbe visualized without viewing operations. We representedall Web pages as equisized icons so that they can be evenlycompared. We categorized the icons inside squarishsubspaces according to the directory structure of the Website so that Web pages under the same directory can bevisually recognized as a group of icons. Fig. 1 shows howthe presented technique represents thousands of Web pagesin one display space without overlap.Moreover, we aimed to roughly control the positions ofthe icons. It is convenient if icons of large-scale data arealigned according to user-specified semantics or placedaccording to users’ designs because that makes it easier tosearch for interesting icons in thousands of displayed icons.Also, it is convenient if icons are placed to look similar tothe layout results of similar data. These are reasons why weaimed to control their positions. It is an importantrequirement for the visualization of Web sites because theWeb pages of Web sites often increase or decreasegradually. The hierarchical data of a Web site with smallPublished by the IEEE Computer Society
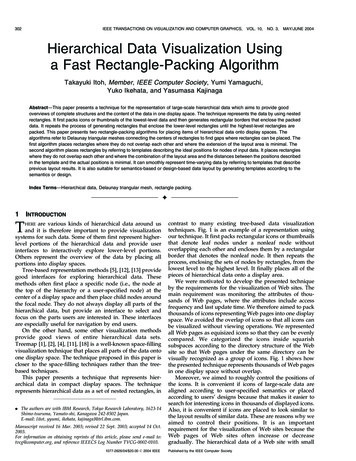
ITOH ET AL.: HIERARCHICAL DATA VISUALIZATION USING A FAST RECTANGLE-PACKING ALGORITHM303Fig. 1. Examples of the representation of hierarchical data. Colored dots denote leaf nodes and gray rectangular borders denote nonleaf nodes. Leafnodes of this data denote the Web pages of a Web site and the nonleaf nodes of the data denote the directory hierarchy. The leaf nodes are coloredaccording to their last update time and given heights according to their access frequencies.time differences would therefore be similar and suchsimilar data should be similarly represented.According to these motivations, we developed a visualization technique that has the following features:Feature 1: Efficient use of display spaces. It is often usefulif visualization techniques pack all data items in alimited display space to provide a good overview.Traditional orthogonal tree-based systems, such aswell-known file system viewers, have a bottleneck inthat they may need a large display space if there aremany nodes under one nonleaf node or if there is a deephierarchy.Feature 2: No overlaps between nodes. Some visualizationmethods may cause nodes to overlap in defocusedregions. Our technique does not overlap them, so itprovides a uniform overview of the data.Feature 3: Aspect ratio of subspaces. When visualizationtechniques subdivide a display space to represent theparts of the given data, squarish subspaces are usuallypreferable over thin subspaces so that users can visuallyrecognize the parts. Therefore, aspect ratios of subspacesshould be considered.Feature 4: Flexible placement of arbitrarily shaped nodes.When data items are represented as rectangular icons,we often assume that the aspect ratios and sizes of allicons should be entirely unified. On the other hand, wealso assume that the aspect ratios and sizes of all theicons should be specifiable by users and they may evenbe varied. This makes it possible to visually emphasizeimportant data items.Feature 5: Similarity. It is desirable that similar data besimilarly represented. For example, it is desirable thattime-varying data be represented without drasticallychanging the layout of data items. To satisfy this feature,data items from similar data sets should be similarlyplaced onto the display spaces.Feature 6: Semantics of placement. It is desirable that thepositions of data items can be calculated according touser-specified semantics, e.g., alphabetical order, score ofdata items, or a user’s design.This paper presents an algorithm for quickly packing aset of arbitrarily sized rectangles in a small display space,which is called “mesh-edge-based rectangle packing.” Themesh-edge-based algorithm is applied to the presentedvisualization technique so that it interactively displayslarge-scale hierarchical data, where icons, thumbnails, orborders are treated as arbitrarily sized rectangles. Themesh-edge-based algorithm places a set of rectangles one byone, while it looks for gaps between previously placedrectangles where the remaining rectangles can be placedwithout overlapping. It generates a Delaunay triangularmesh that connects the centers of the placed rectangles andrefers to it to quickly find the gaps. It updates the mesh byconnecting the centers of the placed rectangles one by one.This reduces the usage of display space, avoids overlapsbetween data items, and quickly places all of the data items.Using the algorithm, the visualization technique satisfiesFeatures 1, 2, 3, and 4.This paper also presents an extension of the rectanglepacking algorithm, which is called “template-based rectangle packing” in this paper, that refers to templatesdescribing the ideal positions of the nodes of input dataso that the presented visualization technique satisfiesFeatures 5 and 6. The template-based algorithm placesrectangles as close as possible to the ideal positionsdescribed in the templates, while it still reduces the usageof display space and avoids overlaps among the data items.Template positions can be created from semantics of nodes,rough design by users, or the positions of nodes in aprevious time step.We implemented the proposed technique, measured thecomputation time and layout results, and compared it withexisting techniques. Section 6 describes the results of thesemeasurements.2RELATED WORK2.1 Tree-Based VisualizationTree representation is the most popular hierarchical datavisualization technique, used in many programs such aswell-known file system viewers. Several variations, such asthe Hyperbolic Tree [13], Cone Tree [5], Fractal Views [12],and NicheWorks [22], have been described for the interactive visualization of large-scale tree data sets. Thesetechniques are suitable for visualizing the higher-level datafirst and then exploring the lower-level data according tothe users’ choices. They are also suitable for visualizing theconnectivity among nodes. Carriere and Kazman represented all parts of large-scale hierarchical data by using aCone Tree in [5]. Wills also represented such data by usingNicheWorks [22]. These provide good overviews of thedata, but their results contain sparse regions.2.2 Space-Filling VisualizationA Treemap [11], which represents hierarchical data in amanner like nested column charts, is a well-known spacefilling approach for hierarchical data visualization. Thespace-filling approach is especially useful for representa-
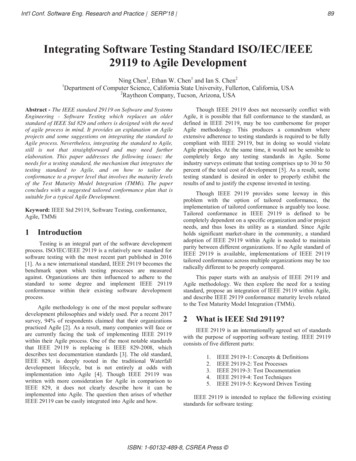
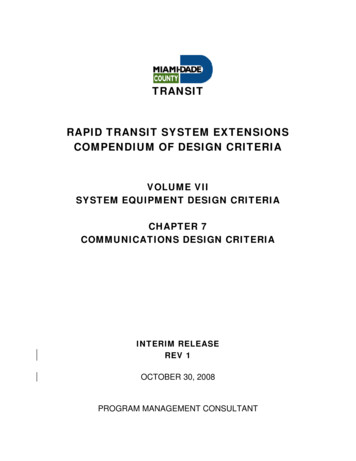
304IEEE TRANSACTIONS ON VISUALIZATION AND COMPUTER GRAPHICS,tions appropriate to visualizing quantitative data attributes,as opposed to seeing connectivity, for which tree-basedtechniques may be more appropriate. This approach is alsosuitable for representing all of the data in a compact displayspace. The technique presented in this paper is close toTreemap in terms of providing overviews of the data.Treemap satisfies Features 1 and 2 since it quickly placesall parts of the data into one display space without overlap.However, it has shape-related limitations in that some ofdata items may be very thin. Squarified Treemap [4]improved the shapes of the rectangular subspaces so thatit satisfies Feature 3. Ordered Treemap [18], [2] placed thedata items in the order of user-specified semantics so that itsatisfies Feature 6, in addition to improving the shapes ofthe rectangular subspaces. Such an ordered layout is alsouseful for dynamically updated data and, therefore, itsatisfies Feature 5. However, they still do not guarantee theaspect ratios of the lowest-level data items. QuantumTreemap and Bubblemaps [1], [2] were recently proposedfor the layout of icons or thumbnails when those aspectratios are fixed, so that they satisfy Feature 4. As describedin [2], the stable layout of dynamic data is a future researchdirection. The template-based algorithm presented in thispaper addresses this issue.Nested pie charts are also a space-filling approachapplied to hierarchical data visualization [6], [21]. Theyalso have shape-related limitations.2.3 Semitransparent 3D VisualizationInformation cubes [17] is a 3D hierarchical data visualization approach, which positions data in nested semitransparent hexahedrons. H-BLOBS [20] is also a 3D hierarchicaldata visualization approach, positioning data in nestedsemitransparent isosurfaces. These approaches have limitations in that they require a graphics environment supporting 3D semitransparent rendering and in that users’ need3D manipulation skills. Also, the computation times fordata layout are not clearly mentioned in their papers.2.4 Graph LayoutData layout techniques are important not only for hierarchical data visualization but also for graph visualization.The force-directed algorithm is a famous graph layoutapproach which applies spring models to nodes and arcs. Itis somewhat computationally unstable and expensive foriterative dynamics calculations, but, recently, many improved algorithms have been reported for large-scale andclustered graphs [9], [16]. Gansner et al. presented animproved force-directed approach [8] that forms a Voronoidiagram of nodes during each iterative calculation step. Itmoves nodes to the centers of the Voronoi polygons torefine the configuration. The heuristic used in this paper issimilar to theirs. Freivalds et al. presented a space-efficientmethod for the representation of disconnected graphs [7]. Itapplies a rectangle packing technique to tightly place thedisconnected parts of graphs.2.5 Rectangle PackingFor our representation, a set of nested rectangles must beproperly packed in a display region so that the displayregion is compact. A fast rectangle-packing algorithm istherefore a key technology for our representation. Thepacking problem is well-known in the field of VLSI circuitdesign [15], for the layout of mechanical parts onto sheetVOL. 10,NO. 3,MAY/JUNE 2004Fig. 2. Algorithmic overview of the layout process of the presentedtechnique. Numbers in this figure denote the order of the process.metal, and for the layout of parts of clothes. Many packingalgorithms apply various optimization schemes such asgenetic algorithms to minimize the layout areas. However,these algorithms often require minutes or even hours ofcomputation time to find the optimized configurations and,therefore, they are not suitable for interactive visualizationtechniques. Our approach does not need to perfectlyminimize the layout space, but only needs to find areasonable configuration within a few seconds in order toprovide an interactive visualization.A good heuristic for fast object packing has beenproposed for the purpose of texture generation [10]. Whilethe method packs objects of semiuniform sizes as textures,our problem must deal with widely varied sizes ofrectangles.Space management has been studied in some visualization and user interface work. Design Galleries [14] tried tooptimize the distribution of data items on display spaces,but it does not consider their overlap. The space manager[3] of Bell et al. tried to avoid the overlap of rectangularobjects on display spaces during the addition and deletionof the objects, but it does not consider the minimization ofthe display spaces.3OVERVIEWOFHIERARCHICAL DATA LAYOUTThis section presents an overview of the proposedhierarchical data visualization technique, especially forproviding an overview of large-scale, nonuniformly nestedhierarchical data. The technique packs rectangular icons inrectangular regions and then repeats the packing ofrectangular regions to represent the hierarchy.Fig. 2 shows an illustration of the order of hierarchicaldata layout in the presented technique. The technique firstpacks icons (painted square dots in Fig. 2) that denote leafnodes and then encloses them by rectangular borders thatdenote nonleaf nodes. Similarly, it packs a set of rectanglesthat belong to higher levels and generates the largerrectangles that enclose them. Repeating the process fromthe lowest level toward the highest level, the techniqueplaces all of the data onto the layout area.Fig. 3 shows the tree structure of the hierarchical data weused as input data and the order of layout in the technique.To define the order of the layout process, the techniquetraverses the hierarchy using a breadth-first search algorithm, starting from the highest level of the data. It thenplaces the data for each level in the reverse order of thattraversal.
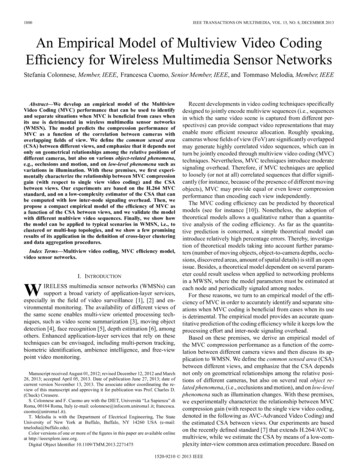
ITOH ET AL.: HIERARCHICAL DATA VISUALIZATION USING A FAST RECTANGLE-PACKING ALGORITHM305areas, as shown in Fig. 4. It first places larger rectangles, andthen searches for gaps to insert smaller rectangles.Fig. 3. Definition of the order of the layout using a breadth-first traversal.Each node of the tree structure in this figure denotes a rectangle in Fig.2. The hierarchical structure and the ordering in this figure correspondexactly to Fig. 2.Treating icons, thumbnails, and rectangular borders as aset of rectangles, the presented hierarchical data visualization technique applies a rectangle-packing algorithm toplace them onto one display space. The packing algorithmplaces the rectangles tightly inside a small rectangular areaand encloses them by a bigger rectangular border thatdenotes the parent nonleaf node.If all nodes in a level are leaf-nodes and their sizes andaspect ratios are not specified, our implementation assumesthat all nodes are represented by equal squares. In this case,the implementation places them onto an orthogonal regulargrid, without using the rectangle packing algorithm. Whenthe level contains nl nodes, the implementation calculatespffiffiffiffiffithe rounded value of nl , and sets the horizontal or verticalnumber of squares to that value. In Fig. 2, a set of nodesinside rectangular borders, labeled as 1, 2, 3, 4, 5, and 7, areplaced onto the grid.If the sizes and aspect ratios of the rectangles vary, thetechnique needs more robust rectangle packing algorithms.Sections 4 and 5 present the details of two rectangle-packingalgorithms.4MESH-EDGE-BASED RECTANGLE PACKINGALGORITHMThis section presents the algorithm for quickly packing a setof rectangles, which is used for the presented hierarchicaldata visualization technique. Here, let us assume thatn rectangles are given and the packing algorithm positionsall of them onto an xy-plane while it tries to minimize thelayout area. Let us also assume that all edges of therectangles are parallel to the x-axis or y-axis. Under theseassumptions, the algorithm places the rectangles one byone. Our implementation places rectangles in order of their4.1 Data StructuresThis paper formalizes the problem as follows: Givenrectangles R ¼ fr1 ; . . . ; rn g, the algorithm places the set ofrectangles one by one. Here, the algorithm favorsaccelerating the rectangle packing process rather thanperfectly minimizing the layout space. We therefore didnot apply optimization schemes to find the configurationof the rectangles, but used a heuristic to quickly find gapsand place the remaining rectangles in the gaps. Theheuristic uses a triangular mesh connecting the centers ofthe previously placed rectangles, as shown in Fig. 5. Letus denote the mesh as MðV ; E; T Þ consisting of verticesV ¼ fv1 . . . vnþ4 g, edges E ¼ fe1 . . . el g, and trianglesT ¼ ft1 . . . tm g. The algorithm first positions the largestrectangle r1 at the center of the layout area and generates arectangular space that entirely encloses the positionedrectangle. Let the space be S, its four corner vertices be v1to v4 , and the center of ri be viþ4 . We initially define the sizeof S as twice the size of r1 . The algorithm then generatesfour triangles t1 to t4 , which connect the five vertices v1 tov5 , as shown in Fig. 5a. Placing each new rectangle ri one byone, the algorithm updates M as shown in Fig. 5, byconnecting the new vertex viþ4 to several vertices andmodifying several triangles. Note that M is independentlygenerated for each set of rectangles under one nonleaf node.While deciding on a position in which to place arectangle, the algorithm calculates candidate positions onE and evaluates the candidate positions. Section 4.2describes the order of visiting elements in E andSection 4.3 describes the evaluation of the candidatepositions. Section 4.4 describes the modification of thetriangular mesh. Section 4.5 describes the summary of thealgorithm.4.2 Order of Referring to the Mesh EdgesThe algorithm places the rectangles one by one while itsatisfies Features 1, 2, and 3. It searches for a position toplace the rectangle, which satisfies the following conditionsas much as possible:Condition 1: No overlap between rk and any previouslyplaced rectangles.Condition 2: Minimum extension of the layout area S andkeep aspect ratio of S close to its preferred value.Here, the preferred aspect ratio in Condition 2 is thesame as the aspect ratio of the display or window space forFig. 4. Illustration of layout of rectangles using the presented algorithm. The algorithm first places the largest rectange and then places the others inthe order of their areas while it searches for gaps where they can be placed without overlaps.
306IEEE TRANSACTIONS ON VISUALIZATION AND COMPUTER GRAPHICS,VOL. 10,NO. 3,MAY/JUNE 2004Fig. 5. Processing flow of rectangle placement and update of mesh M.the highest level and 1 for the other levels based on theheuristics that squarish region is easier to visually recognize, as described in Feature 3.To quickly search for positions where rectangles can beplaced satisfying the above conditions, the algorithm pickssuitable positions by using the following two strategies:Strategy 1: It favors selecting sparsely populated regionssince it is easier to place rectangles in such placeswithout overlapping with other rectangles.Strategy 2: It favors selecting interior positions since it iseasier to place rectangles in such locations withoutenlarging the layout space.Fig. 6a shows an example of a triangular mesh andrectangles. Here, let El be the length of a mesh edge, El1 isthe length of the part of the edge that is inside the rectanglewhose center places it at an end of the edge, and El2 is thelength of the other part of the edge that is inside anotherrectangle, as shown in Fig. 6b. Our technique calculates thevalues of Elr ¼ El ðEl1 þ El2 Þ, the length of the remaining part of the edge lying outside the two rectangles. Here,the technique lets El1 or El2 take the value of zero when theends of the edge are on vi ði ¼ 1::4Þ.This is because it is morelikely that gaps will be found around mesh edges whose Elrvalues are larger. The numbers in Fig. 6c denote that theedges are ordered from the largest Elr to the smallest. Thealgorithm searches for gaps on the edges in this order sothat it satisfies Strategy 1.Fig. 6. (a) Delaunay triangular mesh connecting centers of previouslyplaced rectangles. (b) Calculation of values of ELr . (c) Order of the ELrvalues.We use a Delaunay triangular mesh for the algorithmaccording to our heuristics that Delaunay triangulationmakes candidate positions well-distributed. Since thedefinition of Delaunay triangulation is the triangulationthat maximizes the minimum angle of M, it avoids makingcloser candidate positions by adjacent edges connected witha narrow angle.At the same time, the algorithm counts cej , the number ofcorner vertices v1 to v4 touching the edge ej . Fig. 7a showsan example of the distribution of cej . This figure shows thatinterior mesh edges have the smaller cej values.Thealgorithm then groups the mesh edges according to theircej values. The algorithm starts the trial placement ofrectangles on the edges. It first extracts edges from the cej ¼0 group, then the cej ¼ 1 group, and, finally, the cej ¼ 2group, so that it satisfies Strategy 2.The algorithm extracts edges in each group in the sortedorder, starting from the edge that has the largest Elr value.The algorithm calculates at most two candidate positionswhere rk touches the rectangles previously placed at theends of ej , as shown by the two dotted rectangles in Fig. 7b,and tries to place rk at each of these positions. For cej ¼ 1edges, the technique tries to place rk at a position where rktouches the rectangle previously placed located at one of theends of ej . In the case of cej ¼ 2 edges, the technique tries toplace rk at the center of ej because there are no rectangles atthe ends of cej ¼ 2 edges.Fig. 7. (a) Values of cej for edges. (b) Two positions to try to place thecurrent rectangle.
ITOH ET AL.: HIERARCHICAL DATA VISUALIZATION USING A FAST RECTANGLE-PACKING ALGORITHM307Fig. 8. (a) A rectangle and triangular mesh. (b) One more rectangle is placed on a mesh edge. (c) Corners of S are moved when the placement of thecurrent rectangle requires enlarging the layout region S.4.3 Evaluation of Candidate PositionsGiven a candidate position, the algorithm checks if the pointsatisfies the two conditions described in Section 4.2. Startingfrom the cej ¼ 0 edges, the algorithm refers to edges in thesorted order and calculates candidate positions on the edges.The algorithm then attempts to place rk at the candidatepositions. It checks overlaps between rk and previouslyplaced rectangles and calculates enlargement of S. If thealgorithm finds that one of the candidate positions satisfiesboth conditions, it decides to place rk there and selects thenext rectangle. Otherwise, the algorithm selects the next edgeto check to see if it satisfies both conditions. If no cej ¼ 0 edgesatisfies both conditions, the algorithm continues with thecej ¼ 1 edges and, finally, the cej ¼ 2 edges.Even if the candidate position satisfies only Condition 1,the algorithm can place rk after enlarging S. In this case, thealgorithm evaluates the point. Our implementation evaluates points using a combination of layout area and layoutaspect ratio. It calculates the value aA þ rR, where a and rare user-defined positive values. A is calculated as follows:A ¼ Aafter Abefore ;where Aafter is the area of S after the placement of rk andAbefore is the area of S before the placement. Aafter can becalculated after the enlargement of S described inSection 4.4. R is calculated as follows: Rs Rbest ðRs Rbest ÞR¼Rbest Rs ðRbest Rs Þ;where Rs is the aspect ratio of S after the placement of rkand Rbest is the preferred aspect ratio, the aspect ratio of thedisplay or window space for the highest-level of thehierarchy and 1 for the other levels. Again, Rs can becalculated after the enlargement of S described inSection 4.4. We usually define the value of a and r asa ¼ r ¼ 1, but it depends on the requirements of users: If theefficiency of the use of display spaces is important, a shouldbe larger than r.If aA þ rR calculated on the candidate position is smallerthan the smallest in the values of previously processedcandidate positions, the algorithm saves the candidateposition with this aA þ rR value.If no candidate positionssatisfy both Conditions 1 and 2, the algorithm places rk atthe most recently saved candidate position because this wasevaluated as the best position.4.4Local Modification of the Triangular Mesh afterthe Addition of Each RectangleIf it is decided to place the rectangle ri at acandidate position that does not satisfy Condition 2,the algorithm enlarges S by moving some of thevi ði ¼ 1::4Þ, as shown in Fig. 8. Here, let the positionsof vi ði ¼ 1::4Þ are ðx1 ; y1 Þ; ðx2 ; y1 Þ; ðx2 ; y2 Þ; ðx1 ; y2 Þ, wherex1 x2 ; y1 y2 . Also, we position the four corners of ri atðxa ; ya Þ; ðxb ; ya Þ; ðxb ; yb Þ; ðxa ; yb Þ, where xa xb ; ya yb . The algorithm enlarges S by recalculating the position of vi ði ¼ 1::4Þas follows:if xa x1 then x1 ¼ xa mgn;if ya y1 then y1 ¼ ya mgn;if xb x2 then x2 ¼ xb þ mgn; andif yb y2 then y2 ¼ yb þ mgn:Here, mgn is a constant positive value. Our implementationapplies mgn ¼ 0:1Sw if Sw Sh ; otherwise, mgn ¼ 0:1Sh ,where Sw is the width of S and Sh is the height of S.After the algorithm places ri by using the above steps, asshown in Fig. 9a, it updates the triangular mesh by adding thecenter of the placed rectangle viþ4 to the mesh. This processfirst connects viþ4 to the two other vertices of the triangles thatshare the edge ej and divides each of the triangles into twonew triangles, as shown in Fig. 9b. The process then locallymodifies the mesh, starting from the triangles that share thenewly added edges. It selects an adjacent triangle to modifyand swaps their shared edge to improve the triangles, asshown in Fig. 9c. The modification is recursively repeatedbetween the modified triangles and their adjacent trianglesuntil no triangles are modified. The detailed algorithm of themesh modification is described in [19].4.5 Algorithm SummaryFig. 10 shows the pseudocode of the algorithm. Here, weconsider the complexity in terms of the number of rectanglesn and assume that the numbers of vertices, edges, andtriangles of a mesh are all proportional to n. To place all of therectangles, the algorithm requires at least Oðn log nÞ computation time on average for the creation and modification of theDelaunay mesh described in Section 4.4. It also requiresOðn log nÞ for sorting the rectangles according to their areasand the mesh edges according to their Elr values. In addition,the algorithm requires Oðn2 Þ computation time when itchecks for the overlap among the rectangles currently beingplaced and all of the previously placed rectangles. Managingthe previously placed rectangles by using additional data
308IEEE TRANS
A Treemap [11], which represents hierarchical data in a manner like nested column charts, is a well-known space-filling approach for hierarchical data visualization. The space-filling approach is especially useful for representa-ITOH ET AL.: HIERARCHICAL DATA VISUALIZATION USING A FAST RECTANGLE-PACKING ALGORITHM 303 Fig. 1.