Transcription
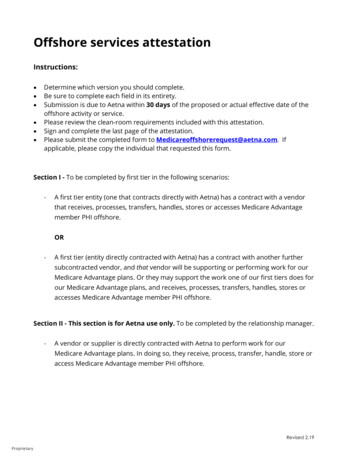
HYDROGRAPHIC SURVEYREPORT103628-ENN-MMT-SUR-REP-SURVECRREVISION 02 CLIENT REVIEWOCTOBER 2020THOR OFFSHORE WIND FARMEXPORT CABLE ROUTEDANISH NORTH SEAAUGUST-SEPTEMBER 2020MMT SWEDEN AB SVEN KÄLLFELTS GATA 11 SE-426 71 VÄSTRA FRÖLUNDA, SWEDENPHONE: 46 (0)31 762 03 00 EMAIL: INFO@MMT.SE WEBSITE: MMT.SE
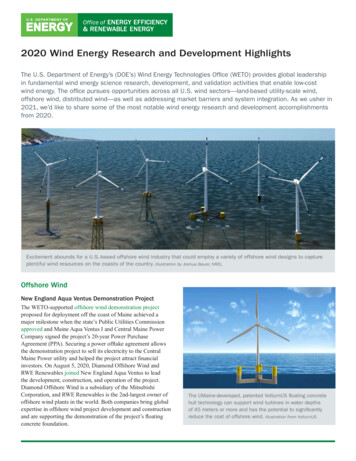
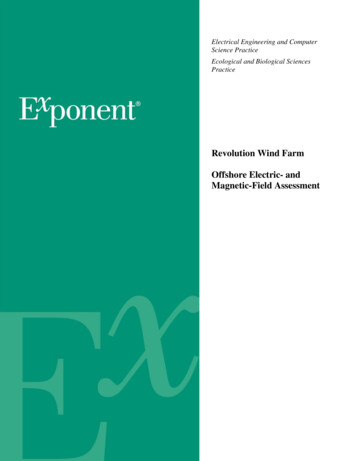
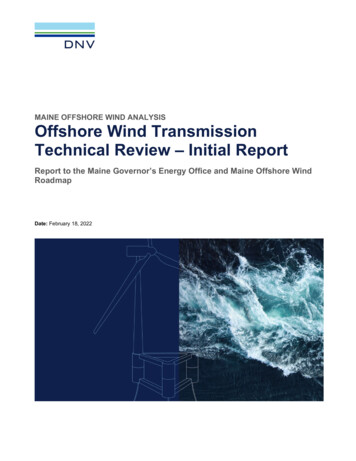
CLIENT: ENERGINETGEOPHYSICAL SURVEY REPORT ECR 103628-ENN-MMT-SUR-REP-SURVECREXECUTIVE SUMMARYTHOR OFFSHORE WIND FARM AND EXPORT CABLE ROUTES OVERVIEWEnerginet are developing the proposed Thor Offshore Wind Farm in the Danish sector of the North Sea(Figure 2). MMT have been contracted to provide hydrographical surveys covering the Offshore WindFarm and two export cable route options to the landfall location in Jutland, Denmark. The OWF surveyarea is referred to as OWF, while the export cable route surveys are referred to as ECR. This reportcovers the results of the surface difference comparison for the two export cable route survey corridors.An overview image of routes R2 and R3 are presented in Figure 1.Figure 1 Overview of Export Cable Routes R2 and R3.PAGE 2
CLIENT: ENERGINETGEOPHYSICAL SURVEY REPORT ECR 103628-ENN-MMT-SUR-REP-SURVECRPRINCIPAL ROUTE POINTS – ROUTE 2Geodetic Datum & Projection: ETRS89 UTM Zone 32N (EPSG 25832)PointKPLatitude (dd.dddd)Longitude(dd.dddd)Easting (m)Northing (m)Start: Landfall 10.00056.45718.12814462636257296End: OWF Entry221.44456.40727.79284255046252058PRINCIPAL ROUTE POINTS – ROUTE 3Geodetic Datum & Projection: ETRS89 UTM Zone 32N (EPSG 25832)PointKPLatitude (dd.dddd)Longitude(dd.dddd)Easting (m)Northing (m)Start: Landfall 10.00056.45498.11294462636257296End: OWF Entry324.40056.34447.79154253046245071SURFACE DIFFERENCE RESULTSIn the nearshore zone where the R2 and R3 survey corridors overlap the seabed was found to behighly dynamic. The maximum positive (depositional) and negative (erosional) depth changes for theentire ECR survey area were found here, 2.22 m and -2.71 m.These depth changes relate to the increase in depth of a channel that runs parallel to the shorelinebetween KP 0.485 and KP 0.680 (relative to the R2 route) and a shoreward shift in position of a barfeature between KP 0.680 and KP 0.790 (relative to the R2 route). The scoured channel in thenearshore area exposed a wreck that had only been partially observed in the 2019 bathymetry data.The surface difference results showed that areas of mobile seabed were present along the offshoreparts of both R2 and R3 with changes in depth typically within /-0.5 m according to depth profilesextracted from the cable route positions. Measurements of bedform migration suggested that transportwas generally in a north-northeasterly direction with orientations ranging between 007 and 025 .Measurements of horizontal displacement range between 15 m and 50 m since the 2019 survey wasconducted and the range of depth change in the offshore parts of the survey corridors was typicallywithin /-1.0 m.The direction of movement is derived from the displacement of features that can be correlated betweenprofiles, such as crests and troughs that have similar forms, rather than interpreted from themorphology of the bedform itself.A qualitative comparison of both routes suggested that R2 exhibited a greater degree of mobility. Thereare extensive sections of R3 where depth changes were within the vertical uncertainty of the MBESdata ( /-0.15 m). This is offset however by an extensive area of mobile seabed between KP 4.0 andKP 8.0 of R3. This mobile zone extends into R2 but only intersects the route in two sections betweenKP 3.25 and KP 3.80 and KP 4.80 and KP 5.50.PAGE 3
CLIENT: ENERGINETGEOPHYSICAL SURVEY REPORT ECR 103628-ENN-MMT-SUR-REP-SURVECRREVISION Issue for Client ReviewDJOKG012020-10-11Issue for Internal ReviewDJOKGCLIENT APPROVALREVISION LOGDATESECTIONCHANGEDOCUMENT CONTROLRESPONSIBILITYPOSITIONNAMEContentSenior Data ProcessorAndrew Stanley/Chris BulfordContent, CheckProject Report CoordinatorDavid Oakley/Darryl PickworthCheckDocument ControllerAnders ErikssonApprovalProject ManagerKarin GunnessonPAGE 4
CLIENT: ENERGINETGEOPHYSICAL SURVEY REPORT ECR 103628-ENN-MMT-SUR-REP-SURVECRTABLE OF CONTENTS1.1 1.2 1.3 1.4 1.5 1.6 1.6.1 1.6.2 1.7 1.8 INTRODUCTION. 9PROJECT INFORMATION .9SURVEY INFORMATION – ECR . 10SURVEY OBJECTIVES . 11SCOPE OF WORK . 11PURPOSE OF DOCUMENT . 12REPORT STRUCTURE . 12HYDROGRAPHIC SURVEY REPORT . 12CHARTS . 12REFERENCE DOCUMENTS . 13CORRIDOR LINE PLAN . 132.1 2.1.1 2.1.2 2.1.3 2.1.4 2.1.5 2.2 2.3 2.4 SURVEY PARAMETERS . 14GEODETIC DATUM AND GRID COORDINATE SYSTEM . 14ACQUISITION . 14PROCESSING . 14TRANSFORMATION PARAMETERS . 15PROJECTION PARAMETERS . 15VERTICAL REFERENCE . 16VERTICAL DATUM . 17TIME DATUM . 17KP PROTOCOL . 183.1 3.2 SURVEY VESSELS . 19M/V GUARDIAN . 19M/V PLASTICBEAM. 204.1 DATA PROCESSING AND INTERPRETATION METHODS . 21BATHYMETRY. 215.1 PROCESSED DATA QUALITY . 25BATHYMETRY DATA . 25RESULTS . 277.1 7.2 7.3 SURFACE DIFFERENCE RESULTS . 33NEARSHORE ZONE . 35ROUTE 2: KP 0.000 TO KP 21.444 . 40ROUTE 3: KP 0.000 TO KP 24.401 . 45CONCLUSIONS . 49RESERVATIONS AND RECOMMENDATIONS . 50DATA INDEX . 51PAGE 5
CLIENT: ENERGINETGEOPHYSICAL SURVEY REPORT ECR 103628-ENN-MMT-SUR-REP-SURVECRAPPENDICESAPPENDIX A APPENDIX B APPENDIX C ROUTE POSITION LIST (RPL) . 52CHART LIST . 52PROFILE GRAPHS . 52LIST OF FIGURESFigure 1 Overview of Export Cable Routes R2 and R3. . 2Figure 2 Thor Offshore Wind Farm and Export Cable Routes area overview. . 9Figure 3 Overview of the Export Cable Routes. . 11Figure 4 Overview of the relation between different vertical references. . 17Figure 5 M/V Guardian . 19Figure 6 M/V Plasticbeam . 20Figure 7 Workflow MBES processing. . 22Figure 8 Contour export parameters for the ECR and OWF. . 22Figure 9 Example of exported contours with 50 cm interval in the nearshore zone of the ECR. . 23Figure 10 Overview of bathymetry data tile schema used for the ECR. . 24Figure 11 Overview of the sounding density surface for ECR. . 25Figure 12 Map of survey lines by M/V Plasticbeam (pink) and M/V Guardian (green) in the nearshorezone of the ECR. . 26Figure 13 Overview of ECR coverage achieved in 2019 (top) and 2020 (bottom). . 28Figure 14 Overview of ECR nearshore coverage achieved in 2019 (top) and 2020 (bottom). . 29Figure 15 Exposure of charted wreck in 2020 survey (bottom) compared with 2019 (top). . 30Figure 16 Change in R2 seabed texture between 2019 and 2020. . 31Figure 17 Change in R3 seabed texture between 2019 and 2020. . 32Figure 18 Overview of the ECR surface difference results. . 34Figure 19 Surface difference results in the nearshore zone of the ECR. . 35Figure 20 Profile through the northern part of the dynamic nearshore zone with 2020 bathy surfaceshown. . 36Figure 21 Profile through the central part of the dynamic nearshore zone with 2020 bathy surfaceshown. . 37Figure 22 Profile through the southern part of the dynamic nearshore zone with 2020 bathy surfaceshown. . 38Figure 23 Sinuous erosional feature in overlapping zone of R2 and R3. . 39Figure 24 R2 Depth Profile Comparison Chart. 40Figure 25 Profile across ECR R2 between KP 5.0 and 5.5. . 41Figure 26 Profile across ECR R2 between KP 15.0 and 16.0. 42Figure 27 Profile across ECR R2 at KP 18.5 . 43Figure 28 Profile across ECR R2 at KP 20 . 44Figure 29 R3 Depth Comparison Profile Chart. 45Figure 30 Profile across ECR R3 at KP 6.5 . 46Figure 31 Profile across ECR R3 at KP 12.5 . 47Figure 32 Profile across ECR R3 at KP 20.5 . 48LIST OF TABLESTable 1 Project details. . 10Table 2 Export cable route extents. . 10Table 3 Reference documents . 13Table 4 Survey line parameters. . 13Table 5 Survey line breakdown. . 13Table 6 Geodetic parameters used during acquisition. . 14PAGE 6
CLIENT: ENERGINETGEOPHYSICAL SURVEY REPORT ECR 103628-ENN-MMT-SUR-REP-SURVECRTable 7 Geodetic parameters used during processing. . 14Table 8 Transformation parameters. . 15Table 9 Test coordinate for datum shift. . 15Table 10 Projection parameters. . 15Table 11 Vertical reference. . 16Table 12 Vessel-mounted equipment . 19Table 13 Vessel-mounted equipment . 20Table 14 Deliverables. . 51PAGE 7
CLIENT: ENERGINETGEOPHYSICAL SURVEY REPORT ECR 103628-ENN-MMT-SUR-REP-SURVECRABBREVIATIONS AND DEFINITIONSCADComputer Aided DesignDPRDaily Progress ReportDTMDigital Terrain ModelDTUTechnical University of DenmarkEEZExclusive Economic ZoneEPSGEuropean Petroleum Survey GroupETRSEuropean Terrestrial Reference SystemGISGeographic Information SystemGNSSGlobal Navigation Satellite SystemsGRSGeodetic Reference SystemIHOInternational Hydrographic OrganizationINSInertial Navigation SystemISOInternational Organization for StandardizationITRFInternational Terrestrial Reference FrameKPKilometre PostM/VMotorised VesselMBESMultibeam Echo SounderMSLMean Sea LevelOWFOffshore Wind FarmPPSPulse Per SecondQCQuality ControlRPLRoute Position ListRTKReal-time KinematicSOWScope of WorkSVSSound Velocity SensorTPUTotal Propagated UncertaintyTVUTotal Vertical UncertaintyUTCCoordinated Universal TimeUTMUniversal Transverse MercatorPAGE 8
CLIENT: ENERGINETGEOPHYSICAL SURVEY REPORT ECR 103628-ENN-MMT-SUR-REP-SURVECRINTRODUCTION1.1 PROJECT INFORMATIONEnerginet are developing the proposed Thor Offshore Wind Farm in the Danish sector of the North Sea.MMT have been contracted to provide a comparative hydrographic survey covering the Offshore WindFarm (OWF) and two export cable route (ECR) options connecting the OWF to the landfall location nearSøndeby Gårde in Jutland, Denmark.This report covers two export cable route survey corridors including the common nearshore area at thelandfall location. A summary of project details is presented in Table 1.Figure 2 Thor Offshore Wind Farm and Export Cable Routes area overview.PAGE 9
CLIENT: ENERGINETGEOPHYSICAL SURVEY REPORT ECR 103628-ENN-MMT-SUR-REP-SURVECRTable 1 Project details.CLIENT:EnerginetPROJECT:Thor Hydrographic SurveyMMT SWEDEN AB (MMT) PROJECT NUMBER: 103628SURVEY TYPE:Hydrographic export cable route surveyAREA:Danish North SeaSURVEY PERIOD:July – September 2020SURVEY VESSELS:M/V Guardian / M/V PlasticbeamMMT PROJECT MANAGER:Karin GunnessonCLIENT PROJECT MANAGER:Jens Colberg-Larsen1.2 SURVEY INFORMATION – ECRThe ECR work scope comprises two tasks including: Project Management and Administration Bathymetric surveysThe export cable route surveys cover two export routes, numbered 2 and 3, from Jutland, Denmark tothe proposed Thor Offshore Wind Farm location in the Danish sector of the North Sea. This also consistsof a nearshore survey where both export cable route options make landfall north of the coastal town ofThorsminde (Figure 2). Export route 2 runs from the Landfall 1 location to the OWF Entry 2 point. Exportroute 3 runs from the Landfall 1 location to the OWF Entry 3 point. Route extents are shown in Table 2.The nearshore ( -10 m water depth) bathymetric survey was conducted by the M/V Plasticbeam andthe offshore bathymetric survey was completed by the M/V Guardian. M/V Plasticbeam assisted withadditional coverage in the offshore part of the ECR. Both survey operations comprised solely ofmultibeam echo sounder (MBES) data.This report covers the nearshore and export cable route survey works acquired by MMT.Table 2 Export cable route extents.NumberStart KPEnd KPRoute 20.00021.444Route 30.00024.401PAGE 10
CLIENT: ENERGINETGEOPHYSICAL SURVEY REPORT ECR 103628-ENN-MMT-SUR-REP-SURVECRFigure 3 Overview of the Export Cable Routes.1.3 SURVEY OBJECTIVESThe survey encompassed a bathymetric mapping through hull-mounted Multi-Beam Echo-Soundingwith coverage of the OWF area (OWF) and the proposed export cable routes R2 and R3 (ECR). Aspatial resolution of 4 (four) soundings per square meter was achieved.The results of the bathymetric mapping are to be processed, interpreted and compared with thebathymetric datasets from 2019 with the purpose of investigating the dynamic nature of the seabed.This is in the form of this report as well as charts and digital deliverables.1.4 SCOPE OF WORKFor the ECR the following work packages are included in the scope of work (SOW): Work Package A – Offshore Cable Route Survey 10 m Water DepthA full hydrographic seabed survey of the entire cable route corridor to the 10 m water-line tomap bathymetry. Work Package B – Nearshore and Landfall Survey 10 m Water DepthA full hydrographic seabed survey of the entire cable route corridor from the 10 m water-line tolandfall to map bathymetry. Work Package C – Reporting and data deliveryThe results of the investigations shall be processed, interpreted and supplied as a number ofreports, charts and a set of digital deliverables.PAGE 11
CLIENT: ENERGINETGEOPHYSICAL SURVEY REPORT ECR 103628-ENN-MMT-SUR-REP-SURVECR1.5 PURPOSE OF DOCUMENTThis report details the interpretation of the hydrographic survey results from the landfall and offshorewind farm export cable route surveys.The report summarises the results of the surface difference analysis that was performed on the 2020and 2019 bathymetry data.A separate report includes the results of the Offshore Wind Farm survey. A full list of reports is given inTable 3 (Reference Documents).1.6 REPORT STRUCTUREThe results from the ECR survey campaign are presented in two separate reports. Operations Report (single report for OWF and ECR operations) Hydrographic Survey Report (this report)The Hydrographic Survey Report, includes an alignment chart series and north up charts. A full chartlist is provided within Appendix B 1.6.1 HYDROGRAPHIC SURVEY REPORTThis report presents the ECR Hydrographic Survey results.Attached to the report are the following appendices: Appendix A Route Position List (RPL) Appendix B Chart List Appendix C Profile Graphs1.6.2 CHARTSThe MMT Charts describe and illustrate the results from the survey. The charts include two sets of NorthUp chart with a scale of 1:10 000.The charts contain background data (existing infrastructure, EEZ, 12 nautical mile zone and wreckdatabase) alongside survey results.A list of all produced charts is presented in Appendix B .NORTH UP CHARTSThe two sets of North up charts, in A3 Pdf booklet format, show the following: Bathymetry presented as a shaded relief colour image, overlaid with contour lines (1 m (minor)and 5 m (major, with depth labels)); Surface difference results presented as a colour image with variable colour intervals (stepincreasing with increasing displacement either side of 0.0 m).PAGE 12
CLIENT: ENERGINETGEOPHYSICAL SURVEY REPORT ECR 103628-ENN-MMT-SUR-REP-SURVECR1.7 REFERENCE DOCUMENTSThe documents used as references to this report are presented in Table 3.Table 3 Reference documentsDocument bilisation and Calibration Report bilisation and Calibration Report ons Report (OWF & ECR)MMT103628-ENN-MMT-SUR-REP-SURVOWFHydrographic Survey Report Thor OffshoreWind FarmMMT103628-ENN-MMT-SUR-REP-SURVECRHydrographic Survey Report Export CableRouteMMT1.8 CORRIDOR LINE PLANThe ECR survey line spacing and minimum parameters are detailed in Table 4.A breakdown of the survey lines is provided in Table 5.Table 4 Survey line parameters.Geophysical Survey SettingsScopeRoute 2Length 21.444 kmRoute 3Length 24.401 kmLine spacing offshore geophysical Main Lines50 mLine spacing nearshore geophysical Main Lines15 mTable 5 Survey line breakdown.Survey Line BreakdownScopeOffshore geophysical Main Lines760.5 km/1162 LinesNearshore geophysical Main Lines95.5 km/212 LinesPAGE 13
CLIENT: ENERGINETGEOPHYSICAL SURVEY REPORT ECR 103628-ENN-MMT-SUR-REP-SURVECRSURVEY PARAMETERS2.1 GEODETIC DATUM AND GRID COORDINATE SYSTEM2.1.1 ACQUISITIONThe geodetic datum used for survey equipment during acquisition is presented in Table 6.Table 6 Geodetic parameters used during acquisition.HORIZONTAL DATUM: ITRF2014DatumITRF2014ESPG Datum code1165SpheroidGRS80Semi-major axis6 378 137.000mSemi-minor axis6 356 752.314mInverse Flattening (1/f)298.2572221012.1.2 PROCESSINGThe geodetic datum used during processing and reporting is presented in Table 7.Table 7 Geodetic parameters used during processing.HORIZONTAL DATUM: ETRS89DatumETRS89ESPG Datum Code4936SpheroidGRS80Semi-major axis6 378 137.000mSemi-minor axis6 356 752.314mInverse Flattening (1/f)298.257222101PAGE 14
CLIENT: ENERGINETGEOPHYSICAL SURVEY REPORT ECR 103628-ENN-MMT-SUR-REP-SURVECR2.1.3 TRANSFORMATION PARAMETERSThe transformation parameters used to convert from acquisitionprocessing/reporting datum (ETRS89) are presented in Table 8.datum(ITRF2014)Table 8 Transformation parameters.DATUM SHIFT FROM ITRF2014 TO ETRS89(RIGHT-HANDED CONVENTION FOR ROTATION - COORDINATE FRAME ROTATION)PARAMETERSEPOCH 2019.5Shift dX (m) 0.099440Shift dY (m) 0.064160Shift dZ (m)-0.120400Rotation rX (“)-0.00313900Rotation rY (“)-0.01334000Rotation rZ (“) 0.02369500Scale Factor (ppm) 0.0030100000Table 9 Test coordinate for datum shift.UTMZoneDatumEasting (m)Northing (m)LatitudeLongitudeITRF 2014399264.776232328.0856 13' 30,608" N7 22' 31,004" EETRS 89399264.286232327.5456 13' 30.590" N7 22' 30.975" EITRF 2014425649.006264590.0056 31' 11.332" N7 47' 29.609" EETRS 89425648.516264589.465456 31' 11.314" N7 47' 29.581" EITRF 2014446353.506233387.1556 14' 32.370" N8 8' 3.841" EETRS 89446353.016233386.616956 14' 32.352" N8 8' 3.813" E323232LocationPoint 12.1.4 PROJECTION PARAMETERSThe projection parameters used for processing and reporting are presented in Table 10.Table 10 Projection parameters.PROJECTION PARAMETERSProjectionUTMZone32 NCentral Meridian09 00’ 00’’ ELatitude origin0False Northing0mFalse Easting500 000 mCentral Scale Factor0.9996UnitsmetresPAGE 15Point 2Point 3to
CLIENT: ENERGINETGEOPHYSICAL SURVEY REPORT ECR 103628-ENN-MMT-SUR-REP-SURVECR2.1.5 VERTICAL REFERENCEThe vertical reference parameters used for processing and reporting are presented in Table 11.Table 11 Vertical reference.VERTICAL REFERENCE PARAMETERSVertical referenceMSLHeight modelDTU15PAGE 16
CLIENT: ENERGINETGEOPHYSICAL SURVEY REPORT ECR 103628-ENN-MMT-SUR-REP-SURVECR2.2 VERTICAL DATUMGlobal navigation satellite system (GNSS) tide was used to reduce the bathymetry data to Mean SeaLevel (MSL) the defined vertical reference level (Figure 4). The vertical datum for all depth and/or heightmeasurements was MSL via DTU15 MSL Reduction from WGS84-based ellipsoid heights.This tidal reduction methodology encompasses all vertical movement of the vessel, including tidal effectand vessel movement due to waves and currents. The short variations in height are identified as heaveand the long variations as tide.This methodology is very robust since it is not limited by the filter settings defined online and providesvery good results in complicated mixed wave and swell patterns. The use of high-accuracy RTKpositioning online means that there is no need to post-process the vessel navigation before it is appliedonto the multibeam echo sounder (MBES) data.The GNSS tide methodology has proven to be very accurate as it accounts for any changes in heightcaused by changes in atmospheric pressure, storm surge, squat, loading or any other effect notaccounted for in a tidal prediction.Figure 4 Overview of the relation between different vertical references.2.3 TIME DATUMCoordinated universal time (UTC) is used on all survey systems on board the vessel. Thesynchronisation of the vessels on board system is governed by the pulse per second (PPS) issued bythe primary positioning system. All displays, overlays and logbooks are annotated in UTC as well as thedaily progress report (DPR) that is referred to UTC.PAGE 17
CLIENT: ENERGINETGEOPHYSICAL SURVEY REPORT ECR 103628-ENN-MMT-SUR-REP-SURVECR2.4 KP PROTOCOLFor the export cable routes, the routes are based off the client supplied RPL REV04.KP 0.000 is located at landfall and KP values increase towards the OWF survey area entry points.KPs were calculated based upon the relevant UTM mapping projection zone and were at all timesrelated to the selected route. The KP databases used, provided by the client were: REV04 LF1-ENTRY2 20190603 JCO – Route 2 REV04 LF1-ENTRY3 20190603 JCO – Route 3PAGE 18
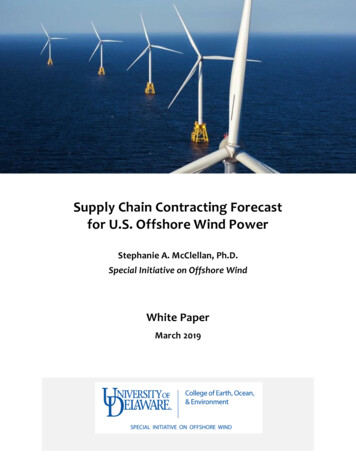
CLIENT: ENERGINETGEOPHYSICAL SURVEY REPORT ECR 103628-ENN-MMT-SUR-REP-SURVECRSURVEY VESSELS3.1 M/V GUARDIANThe M/V Guardian is a multipurpose vessel that is operated by MMT. All of the survey equipment isregularly calibrated, references to which are made within the MAC report where appropriate. Theproposed project development area, offshore wind farm block and two proposed cable routes, off thecoast of Jutland for Energinet was surveyed by M/V Guardian in water depths between -4 m and -35 m.Figure 5 M/V GuardianTable 12 Vessel-mounted equipmentINSTRUMENTNAMEPrimary Positioning SystemSeptentrio AsteRx-U MarineSecondary Positioning SystemC&C Technologies C-Nav3050 (C1/C2 corrections)Primary Gyro and INS SystemIxBlue Hydrins IIISurvey Navigation SystemQPS QINSyMultibeam Echo Sounder(Medium to Shallow Water)Reason Seabat T50-RSound velocityMVP30 / AML Base X2 / Valeport MiniSVSPAGE 19
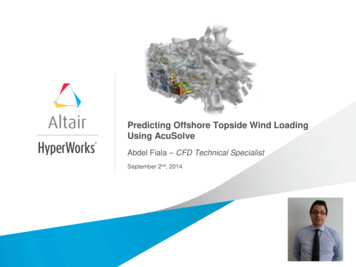
CLIENT: ENERGINETGEOPHYSICAL SURVEY REPORT ECR 103628-ENN-MMT-SUR-REP-SURVECR3.2 M/V PLASTICBEAMThe M/V Plasticbeam is a temporarily fitted hydrographical survey vessel, owned and operated by MMT.It operated in 0 m to -8 m water depth to undertake the near shore survey where the export cable routemakes landfall near Søndeby Gårde on the west coast of Denmark.Figure 6 M/V PlasticbeamTable 13 Vessel-mounted equipmentINSTRUMENTNAMEPrimary Positioning and INS SystemApplanix POS MV 320 with MarineStar G2 correctionsSound Velocity SensorValeport MiniSVS deck cast (S/N 35227)Multibeam EchosounderNorbit iWBMSGPS positioningHemisphere GNSS S321 smart antenna kitPAGE 20
CLIENT: ENERGINETGEOPHYSICAL SURVEY REPORT ECR 103628-ENN-MMT-SUR-REP-SURVECRDATA PROCESSING AND INTERPRETATION METHODS4.1 BATHYMETRYThe objective of the processing workflow is to create a Digital Terrain Model (DTM) that provides themost realistic representation of the seabed with the highest possible detail. The processing scheme forMBES data comprised two main scopes: horizontal and verti
The export cable route surveys cover two export routes, numbered 2 and 3, from Jutland, Denmark to the proposed Thor Offshore Wind Farm location in the Danish sector of the North Sea. This also consists of a nearshore survey where both export cable route options make landfall north of the coastal town of Thorsminde (Figure 2).