Transcription
Supply Chain Contracting Forecastfor U.S. Offshore Wind PowerStephanie A. McClellan, Ph.D.Special Initiative on Offshore WindWhite PaperMarch 2019Special Initiative on Offshore Wind1
ABOUT THE SPECIAL INITIATIVE ON OFFSHORE WINDThe Special Initiative on Offshore Wind (SIOW) is an independent project at theUniversity of Delaware’s College of Earth, Ocean and Environment that supports theadvancement of offshore wind power as part of a comprehensive solution to the mostpressing energy problems facing the United States. SIOW provides expertise, analysis,information sharing and strategic partnership with industry, advocacy and governmentstakeholders to build understanding and drive the deployment of offshore wind.ACKNOWLEDGMENTSThe Rockefeller Brothers Fund provided funding to SIOW to prepare this study. Manythanks to Doug Pfeister, Daniel Stevens, AJ Negrelli and Emily Kuhn at TheRenewables Consulting Group (RCG) who completed the analyses for this report.Thanks also to Kevin Pearce, Michael Stephenson, Walt Musial and Willett Kemptonfor their review of the paper. Lastly, thank you to the National Ocean IndustriesAssociation (NOIA) for their assistance in communicating the findings containedherein to the oil and gas industry. All errors and omissions are the author’s.RenewablesConsultingGroupPhoto – Block Island offshore wind farm, Rhode Island. Source – Vox.com, June 14, de-island-zinkeSpecial Initiative on Offshore Wind2
TABLE OF CONTENTSABOUT THE SPECIAL INITIATIVE ON OFFSHORE WIND . 2ACKNOWLEDGMENTS . 2TABLE OF CONTENTS . 3LIST OF FIGURES/CHARTS. 4LIST OF TABLES . 4LIST OF ACRONYMS AND ABBREVIATIONS . 5EXECUTIVE SUMMARY . 6BACKGROUND. 8METHODS. 9Part 1: Offshore wind power contracting forecast . 9Part 2: Supply chain contracting forecast — quantities . 13Part 3: Supply chain contracting forecast — CAPEX . 15FINDINGS . 17Part 1: Offshore wind power contracting forecast . 17Part 2: Supply chain contracting forecast — quantities . 19Part 3: Supply chain contracting forecast — CAPEX . 23CONCLUSIONS & TAKEAWAYS . 27APPENDIX. 29Special Initiative on Offshore Wind3
LIST OF FIGURESPageFigure ES-1. Offshore Wind Supply Chain Contracts CAPEX Forecast. 6Figure ES-2. Offshore Wind Power Contract Forecast 2018-2030 . 7Figure 1.Time Delay (Gap) Between Power and Supply Chain Signing . 14Figure 2.CAPEX Contracts as a Percent of Total CAPEX costs . 16Figure 3.Offshore Wind Power Contract Forecast 2018-2030 . 18Figure 4.Turbine and Foundation Quantities Forecast . 20Figure 5.Offshore Transmission Components Quantities Forecast. 21Figure 6.Array Cable Length Forecast . 21Figure 7.Onshore Transmission Components Quantities Forecast . 22Figure 8.Offshore Wind Supply Chain Contracts Cumulative CAPEX Forecast . 23Figure 9.Turbine and Foundation Components CAPEX Forecast. 24Figure 10. Offshore Transmission Components CAPEX Forecast. 25Figure 11. Onshore Transmission Components CAPEX Forecast . 25Figure 12. Array Cable and ‘Other’ CAPEX Forecast . 26Figure 13. CAPEX by Procurement Status . 27LIST OF TABLESTable 1.Table 2.Table 3.Table 4.Table 5.Table 6.Power Contracts Forecast by Category . 12Components Considered in Analysis . 13Offshore Wind Power Contracts Forecast by State . 17Estimated Quantities of Components Required by 2030 . 19Estimated Cumulative CAPEX by Component Type . 26Assumptions for States' Procurements . 29Special Initiative on Offshore Wind4
LIST OF ACRONYMS AND SIOWWTGBureau of Ocean Energy ManagementCapital expenditureEngineering, Procurement, Construction & InstallationGigawattLevelized cost of energyMegawattOffshore Renewable Energy CreditPower Purchase AgreementRenewables Consulting GroupRequest for proposalRenewable Portfolio StandardSpecial Initiative on Offshore WindWind Turbine GeneratorSpecial Initiative on Offshore Wind5
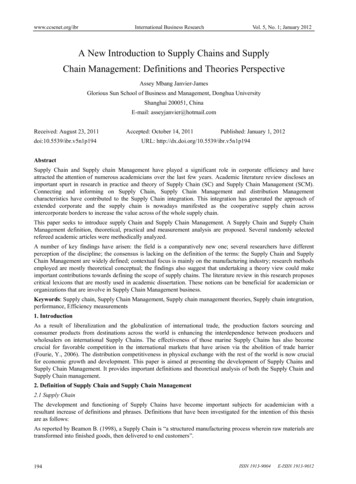
EXECUTIVE SUMMARYAmerica's growing offshore wind power industry — now projected to generate18.6 GW of clean, cost-effective power in seven states on the Atlantic Seaboard by2030 — is presenting a nearly 70 billion CAPEX revenue opportunity to businessesin the offshore wind power supply chain over the course of the next decade.In this white paper, the Special Initiative on Offshore Wind (SIOW) quantifies theextensive supply chain business opportunities this 70 billion CAPEX is creating tobuild out the U.S. offshore wind sector between now and 2030, with quantificationbroken down by industry component, by state, and by year through 2030.As such, SIOW’s first-of-its-kind analysis offers a road map on the timing and paceof power and supply chain contracting prospects for U.S. offshore wind powersuppliers and vendors. The analysis also provides an overview for states looking toattract supply chain facilities and build necessary infrastructure for offshore windindustry development.Key industry components required to achieve an almost 70 billion utility-scalebuild-out of America's offshore wind power capacity by 2030 include:More than 1,700 offshore wind turbines & towers . 29.6 billionMore than 1,750 offshore turbine & substation foundations . 16.2 billionMore than 8,000 kilometers of upland, export & array cables . 10.3 billionMore than 60 onshore & offshore substations . 6.8 billionMarine support, insurance & project management . 5.3 billionTOTAL by 2030: 68.2 billionFigure ES-1:Offshore Wind Supply Chain Contracts Cumulative CAPEX Forecast 80bCAPEX estimate 70b 60b 50b 40b 30b 20b 10b re substation EPCIUpland cable EPCIOffshore substation EPCIExport cable EPCIArray cable EPCIFoundation EPCIWTG EPCIOther (insurance, marine support, PM)Annual CAPEXSpecial Initiative on Offshore Wind6
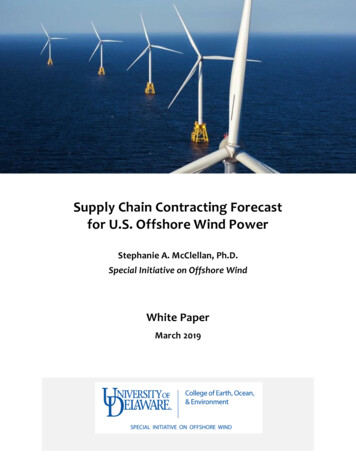
This paper also provides forecasts of state offshore wind power procurementsthrough 2030. Market visibility to rising state commitments is generatingeconomies of scale and driving sustained industry momentum.New Jersey . 3,500 MWNew York . (9,000 MW by 2035) 7,730 MWMassachusetts . 3,200 MWConnecticut . 2,000 MWRhode Island . 1,000 MWMaryland . 1,200 MWVirginia . 12 MWTOTAL by 2030: 18,642 MWES Figure ES 2:Offshore Wind Power Contracts Forecast 2018 – 2030*20,000Procurement Volume 0262027202820292030VA* Data for Virginia included in this chart is not visible due to the small sizeof the contract (12 MW) compared with the overall scale of procurements.Taken together, these state commitments amount to almost 20 GW of offshorewind power and represent a 68 billion capital investment that will require asignificant number of suppliers from many states around the country.This SIOW white paper offers a new, granular view of what this utility-scaleconstruction effort will mean for companies that can meet the demands of thisgrowing industry. For states, it is also a timely indicator of the sizeable volume ofcomponents needed to meet the state's goal and the pace of offshore wind powerprocurements. As states work to secure supply chain facilities, the forecastspresented here have implications for timing offshore wind industryinfrastructure development and supply chain incentives.Special Initiative on Offshore Wind7
BACKGROUNDThe U.S. offshore wind power sector is well underway. In 2016, the nation’s firstoffshore wind farm was commissioned off Block Island, Rhode Island (30 MW). Today,offshore wind farms totaling 1.6 GW of capacity are contracted to provide electricityin Massachusetts (800 MW), Connecticut (300 MW), New York (130 MW), Maryland(368 MW) and Virginia (12 MW). Additional offshore wind power contracts areexpected to be signed in 2019, including in Rhode Island (400 MW), New Jersey (upto 1,100 MW) and New York (up to 800 MW), bringing to seven the total number ofstates to which offshore wind power will soon be providing electricity.This 1.6 GW is just the tip of the iceberg. Many of the same states have their ownoffshore wind power commitments stretching to 2030 and beyond. In addition tothe 1.6 GW of offshore wind farms already contracted to supply power, contracts areexpected to be signed for approximately 17 GW of additional projects as a result ofstate commitments in the period 2020-2030.1 This brings the total forecasted amountof contracted offshore wind power between 2020 and 2030 to 18.6 GW.Collectively, these state commitments are equivalent to the electrical capacity of18 large nuclear power plants, an extraordinary capital expenditure (CAPEX) thatrequires many suppliers. This SIOW white paper provides the first calculation ofwhat this massive construction effort means for offshore wind energy suppliers andvendors, in data broken down year-by-year and by key wind farm component.Specifically, this white paper forecasts:1) the total quantity of components associated with the 18.6 GW of offshore windprojects expected to be contracted with suppliers from 2020 to2030; and2) the value of those supply chain contracts.To date, supply chain analyses of the future U.S. offshore wind power market havefocused on the number of jobs that will be created, based either on individual proposedwind farms, individual state offshore wind commitments and on national estimates ofresource potential. This paper instead analyzes offshore wind commitments by state inorder to forecast years when states are likely to solicit and procure offshore windpower. Second, using this power contract forecast, we analyze what it means for thesupply chain (turbines, foundations, onshore and offshore substations, cable) in termsof quantities of components and contract value, and when supply chain workpackages are likely to be forthcoming. We examine the revenue opportunity of thisnew industry for the supply chain irrespective of the locale of contract origination,acknowledging that the offshore wind supply chain has local, national andinternational participants. This new approach provides a more complete and granularview on how this industry will unfold, with detail on how much of, and when, multiplesupply chain components are expected to be contracted.We acknowledge that New York’s commitment extends beyond 2030 and many other states may continue to develop offshore wind beyond 2030.We have limited this forecast to extend only to 2030 as there are likely to be technology and policy changes that we cannot predict post 2030.1Special Initiative on Offshore Wind8
METHODSThe Special Initiative on Offshore Wind worked with The Renewables ConsultingGroup (RCG) to develop an approach for analyzing the offshore wind power marketand forecasting the required supply chain needs and supply chain participation. RCGconducted all analyses reported here. Please see the Appendix for details on theassumptions used in the modeling.RCG’s analysis addresses three research questions:1. What is the likely scenario for offshore power contracting between developersand utilities during the period 2020-2030?2. Given the forecast for power contracting, what quantities of components willbe needed, and which years, to build the wind farms now required to meetstate commitments?3. Given the forecast for power contracting and the predicted volume ofcomponents that will be needed, what is the total CAPEX — and potentialrevenue opportunity — that can be expected from these contracts?Part 1: Offshore wind power contracting forecastThe research team first compiled the data on wind power in each state, bothcontracted and in negotiation, for the state’s offshore wind commitments and onannounced power procurement timelines. For states that have made offshore windcommitments but not yet announced a procurement schedule, assumptions for powerprocurement timelines were based on their goals and past procurement schedules.The team also made assumptions about how much offshore wind could be procuredby states presently without offshore wind commitments. To do this, we took intoconsideration the states’ Renewable Portfolio Standard (RPS) targets, publicannouncements from their political leaders, their offshore wind-related investments,and any legislation governing renewable energy policy.An overview of assumptions for each state is listed in Table 6 in the Appendix.Special Initiative on Offshore Wind9
The following definitions apply to the forecasted categories.Contracted: A power contract and/or OREC has been agreed to between theoffshore wind developer and the relevant state department and/or utility.In negotiation: The final terms of a power contract and/or OREC are still to beagreed by the offshore wind developer and relevant state department and/or utility.Bids under evaluation: The relevant state department and/or utility is in theprocess of evaluating bids from competing developers to supply electricity fromeligible offshore wind projects.Solicitations required by state policy : The relevant state department and/orutility has committed to the procurement of electricity from renewable energysources, and/or offshore wind specifically, but the bidding window for eligibleprojects has yet to open.Expected future state policy requirements: The relevant state departmentand/or utility has not yet committed to the procurement of electricity from energysources, and/or offshore wind specifically, but procurement is expected to beannounced as part of future state legislation at some point during the forecastperiod.Special Initiative on Offshore Wind10
To forecast years in which procurements could take place in each state, we used thefollowing information and assumptions. See Table 6 in the appendix for details.Rhode Island is currently reviewing bids for an "all renewables” RFP.2 Weassumed that Rhode Island will procure 400 MW in 2020 via this RFP processand/or through an additional all-renewables RFP. The forecast also includesan additional 200 MW that Rhode Island is likely to procure in 2025 to meetstate renewable energy targets.Connecticut has procured relatively small projects in the past (100-200 MW)so the forecast assumes that biannual procurements of 300 or 400 MW wouldbe needed to meet the 2,000 MW commitment included in pending statelegislation.3Massachusetts plans to open an 800 MW offshore wind procurement in June2019 or earlier.4 We have assumed that if the state's legislated study on thecost of offshore wind favorably reflects the appropriate cost benefit of offshorewind, they will schedule two additional 800 MW rounds for 2022 and 2024.In New York, under current conditions, it takes approximately one year toapprove an order from the state’s Public Service Commission before runninga procurement process. Based on this, we have assumed that a procurementprocess could take place every other year in New York. Taking into accountthis assumption, our forecast indicates that New York will procureapproximately 7,730 MW by 2030. We are assuming that New York willprocure the remaining projects between 2030-2035 to meet its 9,000 MWcommitment; however, procurements past 2030 are beyond the scope of thisstudy.The forecast for New Jersey procurements is taken from the New Jersey Boardof Public Utilities announced schedule.5The Maryland forecast assumes the state will pass the Clean Energy Billdescribed above raising the offshore wind targets to 1,200 MW; it furtherassumes that this procurement will be obtained, in the late 2020s, fromexisting and underutilized lease sites near the Maryland 98204 O8%20REPORT%2002082019%20FNL%20V2.pdf23Special Initiative on Offshore Wind11
The assumptions above are reflected in the forecasts in Table 1, which arecategorized in decreasing levels of certainty, the least certain being the quantitiesrequired in the future by state policy, which is subject to ever-changing politicalconditions.Table 1: Offshore Wind Power Contracts Forecast by Category(2016-2030)300MW – CT368 MW – MDContracted800 MW – MA130 MW – NY12 MW – VAIn negotiationBids under evaluation400 MW – RI1,100 MW – NJ800 MW – NY800 MW – MASolicitations required by state policy2,400 MW – NJ6,800MW – NY*1,700 MW – CTExpected future state policyrequirements832 MW – MD1,600 MW – MA600 MW – RITotal18,642 MW** This is an approximate figure for 2030, based on the knowledge that New Yorkhas a target of 9,000 MW by 2035.Special Initiative on Offshore Wind12
Part 2: Supply chain contracting forecast — quantitiesThe procurement schedule derived in Part 1 was used to estimate the quantities ofcomponents that each power contract will represent. A project-specific model wasbuilt based on site characteristics for those projects deemed likely to be selected aspart of the various procurement rounds. As a general rule, a project/lease arealocated within the procuring state was selected before additional projects fromnearby states were considered.All areas that have been leased or are currently in the BOEM leasing process wereincluded in the analysis and BOEM’s leasing timeline was considered when makingassumptions. For example, the proposed New York Bight areas were only consideredto be eligible for bidding in procurements during or after 2022.In the project-specific models, procurement volumes attributed to each lease area arelower or equal to the lease area’s technical capacity. Table 2 illustrates thecomponents and units considered.Table 2: Components Considered in the AnalysisComponents consideredOnshore substationsUnitNumberUpland CableKilometersExport CableKilometersArray CableKilometersOffshore SubstationNumberWind turbine generators (WTG)NumberFoundationsNumberData from RCG’s Global Renewable Infrastructure Projects database (GRIP) wasused to calculate the average time delay, or gap, between the power contract beingsigned, and the signing of supply chain contracts for the components listed in Table2 above.The gap used in this analysis is 1.7 years, based on data illustrated in Figure 1.(That number is rounded up to two years throughout the remainder of this report).The gap is due to the additional time required for developers to secure all permits,obtain final construction approval, reach financial close and negotiate finalcontract terms with suppliers.Special Initiative on Offshore Wind13
Figure 1: Time Delay (Gap) Between Power Contract Signing andSupply Chain Contract SigningUSA*BelgiumUnited KingdomAverageGermanyThe NetherlandsDenmark0.00.51.0Years1.52.02.5*While there is an the absence of relevant data points from commercial scale offshore windprojects in the U.S., supply chain contracts are presenting being negotiated for the 1.6 GW ofprojects that are currently contracted. This chart represents the average number of yearsbetween power contract signing and the date of publication; i.e., the average ongoing gap.Source: GRIP database, accessible at: https://grip.thinkrcg.comThere is an absence of data points from the offshore wind industry in the U.S.Therefore, we reviewed where the ‘contracted’ projects are in their respectivepermitting lifecycles, in order to arrive at a final gap of two years for this study. Theconsequence of this is that all results presented in Part 2 and Part 3 are shifted backtwo years from the procurement years presented in Part 1 (i.e., a 300 MWprocurement in 2019 will result in contracts being signed in 2021). It should be notedthat this is a high-level assumption and that actual contracting schedules for eachproject will vary and be determined by, but not limited to, the maturity of the projectat the time of power contract award, the contract strategy of the owner, theavailability of the onshore grid connection point, and the terms of the negotiatedPower Purchase Agreement (PPA).The forecast is also based on turbine-size assumptions. Wind-turbine size impactsthe number of turbines, foundations and array cable length required to install a givenproject capacity (in MW). In order to take into account future technological advances inturbine design, different rated capacities for the turbines were assumed for powerprocured in different years, from 8.5 MW today to 15 MW in 2029-2030. These arepresented in the Appendix, alongside assumptions around maximum substationcapacity and the length of cable routes.Special Initiative on Offshore Wind14
Part 3: Supply chain contracting forecast — CAPEXThis study estimates the capital expenditure (CAPEX) that each power contractrepresents was estimated using a different method than was used for estimatingthe quantities. To estimate CAPEX, a flat rate of 4 million/MW was assumed forU.S. projects.This number was derived by RCG’s experts based on modeling of existing projectsusing RCG’s proprietary Levelized Cost of Energy (LCOE) model. It should be notedthat this 4 million/MW value is an installed cost, inclusive of all vessel costs.The 4 million/MW rate was then applied to the procurement schedule shown inTable 3 below to calculate the annual CAPEX. As with the quantities, a two-yeargap from power procurement date was applied to reflect the time requiredbetween power procurement and component contract signing.A typical percentage breakdown of offshore wind CAPEX by component (Figure 2)was applied to the annual CAPEX obtained in the previous step to derive the totaldollar value of each component contract. The breakdown in Figure 2 was derivedusing RCG’s U.S.-specific LCOE model, benchmarked against some sample U.S.offshore wind power projects to come up with a “typical” breakdown of CAPEXcosts. This LCOE model is fed by publicly available data .The component breakdown was then checked against the quantities predicted inPart 2, to ensure a “bottom up” reconciliation of the CAPEX figures presented. Noaccount is made of the growing proportion of components expected to bemanufactured in the U.S. between now and 2030, as this is outside the scope of thestudy.Special Initiative on Offshore Wind15
Figure 2:CAPEX Contracts as a Percentage of Total CAPEX Costs8%3% 1%7%8%6%43%24%Onshore substation EPCIOffshore substation EPCIArray cable EPCIWTG EPCIOnshore export cable EPCIOffshore export cable EPCIFoundation EPCIOther (insurance, marine support, PM)Final CAPEX numbers for each of the components were checked against recent marketdata for accuracy.Costs per MW were used as a common metric for comparison. Detailed assumptionsused in deriving CAPEX estimates are presented in the Appendix.Special Initiative on Offshore Wind16
FINDINGSPart 1: Offshore wind power contracting forecastAt the time of this paper’s release, 1,610 MW of offshore wind farms were undercontract in Connecticut, Maryland, Massachusetts, New York and Virginia. Ørsted(Ørsted U.S. Offshore Wind) is in negotiations with the National Grid in RhodeIsland for a 400 MW project. New Jersey closed a solicitation for 1,100 MW at theend of 2018 and New York closed a solicitation for 800 MW in February 2019. Intotal, there is currently 3,910 MW of offshore wind contracted, in negotiation andunder evaluation.The analysis of additional procurements required by state policy and futureexpected procurements results in a forecast of 18,642 MW of offshore windprocured by 2030. 6 Table 3 details our state-by-state, year-by-year forecast foroffshore wind power contracting.Table 3:Offshore Wind Power Contracts (in MW) Forecast by 001,5002,0009321,2008001,2004001,20018,642States to date have been ambitious with their targets and are expected to procure additional volume post 2030. Due to the uncertainty offuture commitments and of other routes to market, this analysis is limited to 2030.6Special Initiative on Offshore Wind17
Figure 3 illustrates the cumulative predicted growth in offshore wind powerprocurements. As it indicates, we forecast that offshore wind power contracts inConnecticut, Massachusetts, New Jersey, New York and Rhode Island will be signedduring 2020-2022, representing an additional 5,500 MW of capacity.In the years 2022-2025, we expect to see 6,432 MW contracted, with largeprocurements happening especially in New York and New Jersey, which both havelarge offshore wind commitments to meet.Increases in offshore wind procurement from the years 2025-2030 will result fromNew York, Maryland and Connecticut continuing to meet their current targets foroffshore wind power as well as RPS or other renewables mandates.Figure 3:Offshore Wind Power Contracts Forecast 2018 – 2030*20,000Procurement Volume 0262027202820292030VA* Virginia, although included in this figure, does not show due to the small sizeof the contract (12 MW) compared with the overall scale of procurements.Special Initiative on Offshore Wind18
Part 2: Supply chain contracting forecast — quantitiesTable 4 shows the total quantity of components expected to be contracted by 2030,for each key component, to meet the procurement volumes expected in the variousstates.Although total procured volume by 2030 reaches 18,630 MW, only powerprocured up to 2028 will result in contracts by 2030 due to the nearly two-yeargap between power procurement and contract signing explained in the Methodssection above. Thus, only the quantities of components associated with the 17,042MW of power procured from 2018 through 2028 are presented in this section.Contract signing for these components will start in 2020 and end in 2030.Table 4:Estimated Quantities of Components Required by 20307Onshore substationsUpland Cable (km)Export Cable (km)Array Cable (km)Offshore Substations (count)WTGs (count)Foundations (WTG and 4,535461,7131,7599Due to uncertainty in the timing of the procurement and build out across both project and state targets, the component quantity numberspresented here are subject to a reasonable level of uncertainty, but a full sensitivity analysis is beyond the scope of this assessment.8 Ranges are provided for cable lengths given the uncertainty around site characteristics (depth, landfall
2) the value of those supply chain contracts. To date, supply chain analyses of the future U.S. offshore wind power market have focused on the number of jobs that will be created, based either on individual proposed wind farms, individual state offshore wind commitments and on national estimates of resource potential.