Transcription
waterArticleSupporting Restoration Decisions through Integration ofTree-Ring and Modeling Data: Reconstructing Flow andSalinity in the San Francisco Estuary over the Past MillenniumPaul H. Hutton 1 , David M. Meko 2 and Sujoy B. Roy 1, *12* Citation: Hutton, P.H.; Meko, D.M.;Roy, S.B. Supporting RestorationDecisions through Integration ofTree-Ring and Modeling Data:Reconstructing Flow and Salinity inthe San Francisco Estuary over thePast Millennium. Water 2021, 13, 2139.https://doi.org/10.3390/w13152139Academic Editor: Nigel W.T. QuinnReceived: 2 June 2021Accepted: 27 July 2021Published: 3 August 2021Publisher’s Note: MDPI stays neutralTetra Tech, Lafayette, CA 94549, USA; paul.hutton@tetratech.comLaboratory of Tree-Ring Research, University of Arizona, Tucson, AZ 85721, USA; dmeko@arizona.eduCorrespondence: sujoy.roy@tetratech.comAbstract: This work presents updated reconstructions of watershed runoff to San Francisco Estuaryfrom tree-ring data to AD 903, coupled with models relating runoff to freshwater flow to the estuaryand salinity intrusion. We characterize pre-development freshwater flow and salinity conditionsin the estuary over the past millennium and compare this characterization with contemporaryconditions to better understand the magnitude and seasonality of changes over this time. This workshows that the instrumented flow record spans the range of runoff patterns over the past millennium(averaged over 5, 10, 20 and 100 years), and thus serves as a reasonable basis for planning-levelevaluations of historical hydrologic conditions in the estuary. Over annual timescales we show that,although median freshwater flow to the estuary has not changed significantly, it has been morevariable over the past century compared to pre-development flow conditions. We further show thatthe contemporary period is generally associated with greater spring salinity intrusion and lessersummer–fall salinity intrusion relative to the pre-development period. Thus, salinity intrusion insummer and fall months was a common occurrence under pre-development conditions and has beenmoderated in the contemporary period due to the operations of upstream reservoirs, which weredesigned to hold winter and spring runoff for release in summer and fall. This work also confirms adramatic decadal-scale hydrologic shift in the watershed from very wet to very dry conditions duringthe late 19th and early 20th centuries; while not unprecedented, these shifts have been seen only a fewtimes in the past millennium. This shift resulted in an increase in salinity intrusion in the first threedecades of the 20th century, as documented through early records. Population growth and extensivewatershed modification during this period exacerbated this underlying hydrologic shift. Puttingthis shift in the context of other anthropogenic drivers is important in understanding the historicalresponse of the estuary and in setting salinity targets for estuarine restoration. By characterizingthe long-term behavior of San Francisco Estuary, this work supports decision-making in the State ofCalifornia related to flow and salinity management for restoration of the estuarine ecosystem.Keywords: tree-ring; flow reconstruction; pre-development; estuarine salinity; salinity intrusionwith regard to jurisdictional claims inpublished maps and institutional affiliations.Copyright: 2021 by the authors.Licensee MDPI, Basel, Switzerland.This article is an open access articledistributed under the terms andconditions of the Creative CommonsAttribution (CC BY) license (https://creativecommons.org/licenses/by/4.0/).1. IntroductionPopulated estuarine regions worldwide have been subject to a variety of stressors, including the introduction of invasive species, loss of tidal habitat, anthropogenic alterationsto the natural hydrologic cycle (including freshwater diversions), impacts to sedimenttransport resulting from upstream watershed land use modifications, and other waterquality impairments [1]. These stressors can adversely affect the estuarine habitat forresident and anadromous aquatic species. Today, there is growing interest in many partsof the world to restore estuaries to more pre-development or natural conditions [2–5].Although restoration planning must account for multiple interacting stressors, for estuariessubjected to significant hydrologic alterations, restoration of a more natural hydrology andsalinity regime is key. To support such restoration planning, pre-development referenceWater 2021, 13, 2139. com/journal/water
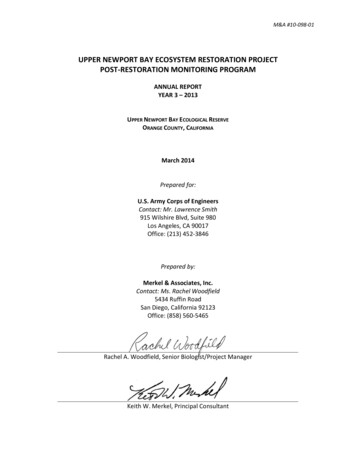
Water 2021, 13, 21392 of 33conditions may need to be defined, although no formal methodology is proposed in currentU.S. regulations. Directly observed data representing reference conditions in a developedestuary are difficult to obtain, especially when the development has occurred over centuries.However, some pre-development characteristics can be inferred from proxy data, notablyestimates of precipitation in the estuary watershed through tree-ring measurements oflong-lived tree species.This work seeks to support restoration planning in the San Francisco Estuary, thelargest estuary on the Pacific coasts of North and South America, by characterizing theregion’s pre-development hydrologic and salinity conditions over the past millennium. Theestuarine region includes a series of interconnected embayments, rivers, sloughs, marshesas well as the delta formed by the Sacramento and San Joaquin Rivers (hereafter referredto as the “Delta”), which together drain a watershed of 75,000 square miles, more than40% of the area bounded by the state of California [6,7]. Following European settlement ofCalifornia in the mid-18th century and the subsequent Gold Rush (circa 1850), the estuaryand its watershed have been subject to extensive changes, including land-use conversionto agriculture and urbanization, construction of water storage and diversion facilities onmajor rivers, channelization and modification of riparian and tidal habitats, and out-ofbasin exports of water [7–9]. The estuary is currently the focus of much scientific attentionbecause of its importance to aquatic ecosystems and because large parts of the state’s urbanand agricultural economies are dependent on water supplies from the Delta [7,10,11].Freshwater flow to the estuary (termed “Delta outflow”) has been identified as a vitalplanning component for regional sustainability. Delta outflow and salinity have been managed for several decades through the regulation of upstream reservoirs and out-of-basinexports. Maximum salinity levels are prescribed at various locations in the Delta; thebroader salinity regime is regulated as the position of the 2 parts per thousand bottomisohaline from Golden Gate (measured in km), commonly referred to as X2 [12–14]; seeFigure 1 for isohaline positions). Despite ongoing regulatory efforts, the abundance ofmany Delta fish species continues to decline from the first formally recorded levels in the1960s [7,15–17]. In response to these declines, additional freshwater flow and salinity regulations are being considered for future implementation [18]. An improved understandingof the estuary’s hydrology and salinity characteristics prior to development, and differencesfrom contemporary conditions, will support decisions related to its future management.The broader region delimited by the San Francisco Estuary and its upstream CentralValley watershed benefits from the availability of extensive data to reconstruct past flowand salinity conditions. These data include flow and salinity measurements, over a centuryor more, that represent the intensification of development in the region (e.g., [14]). Thesedata also include tree-ring measurements to characterize watershed precipitation overthe past two millennia (e.g., [19–21]). The specific research objectives of this work are torefine and update tree-ring-based reconstructions of Central Valley runoff over the pastmillennium and reconstruct Delta outflow and salinity over similar millennial timeframesusing our runoff estimates within a modeling framework informed by previously published work. This integrated evaluation provides a time-resolved characterization of theestuary’s flow–salinity behavior that allows comparison between pre-development andcontemporary conditions.This work builds on previous research that either (i) relies on a contemporary hydrologic sequence to estimate outflow and salinity changes using different modeled representations of the region’s level of development [22] or (ii) relies on contemporary salinitydata to estimate salinity changes using a tree-ring based hydrologic sequence [23]. Byusing a tree-ring based hydrologic sequence in conjunction with a modeling approach thatestimates pre-development estuarine flow and salinity responses, this work attempts torepresent the actual range of flow and salinity conditions over long time horizons and isexpected to better support regulatory decision making by providing a baseline to informfuture flow regulations and restoration actions in the estuary. Furthermore, this work places
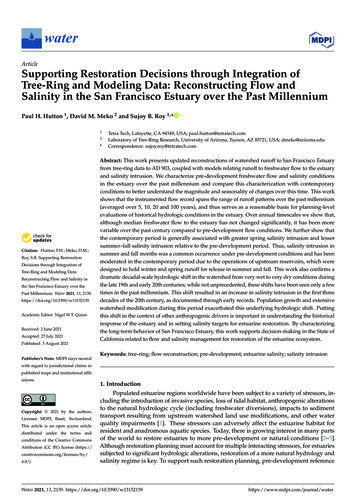
Water 2021, 13, 2139estimates pre-development estuarine flow and salinity responses, this work attempts torepresent the actual range of flow and salinity conditions over long time horizons and isexpected to better support regulatory decision making by providing a baseline to inform3 of 33future flow regulations and restoration actions in the estuary. Furthermore, this workplaces the wet and dry flow patterns recorded in the estuary over the past 150 years in thecontext of flow variations estimated over the past millennium from the tree-ring proxythe wet and dry flow patterns recorded in the estuary over the past 150 years in the contextrecord.of flow variations estimated over the past millennium from the tree-ring proxy record.Figure 1.thethelocationsof treering ringsites sitesused usedin theinanalysis.CirclesCirclesFigure1. StudyStudy locationlocationmapmapshowingshowinglocationsof treethe analysis.mark sitessites contributingcontributing tomarkto thethe shortshort (60(60 tructions.reconstructions.CirclesCirclessizedsized l to percentage of variance explained in regression models for single site reconstructions(SSRs). SitesSites ethoseas wellwith arkedgreen;assiteswellmarkedsites ites(gray)werescreenedoutandnotusedinlaterin laterred contribute to the short reconstructions. Nine sites (gray) were screened out and not usedreconstructionsteps.reconstruction steps.2. BackgroundTo provide background for this work, we present a brief overview of the studyregion’s geographic setting followed by a review of the region’s hydrologic and salinityconditions over the past millennia. This review differentiates between three periods: a “pre-
Water 2021, 13, 21394 of 33development” period, a “contemporary” period, and an “early development” period thatbridges the pre-development and contemporary periods. We define the terminus of thepre-development period as water year (WY) 1850, which roughly aligns with the CaliforniaGold Rush and follows previous work [24–26] California water years run from 1 Octoberthrough 30 September. Furthermore, we define the start of the contemporary period asWY 1912, a date that aligns with availability of Delta outflow estimates [27] but pre-datesthe availability of systematic estuarine salinity measurements by about a decade [14]. Bydefault, the intervening early development period spans six decades between WYs 1851and 1911.2.1. Geographic SettingThe geographic focus of this paper is the upper portion of the San Francisco Estuary,including Suisun Bay, the Delta, and the Central Valley watershed upstream of the estuary(Figure 1). The Delta is the entry point of over 90% of the freshwater flow to the estuary [28] and drains the Sierra Nevada mountain range and Central Valley—a watershed ofapproximately 75,000 square miles. The configuration of the estuary formed approximately5000 years ago when sea level rise stabilized [29]. Sea level rise maintained an average rateof 1.0–1.3 mm/yr [30] through the late Holocene until the late 19th century when it shiftedto an average rate of 2 mm/yr [31].2.2. Pre-Development ConditionsPrior to development of the Central Valley and the San Francisco Estuary, the Sacramento, San Joaquin, and other rivers that drain the region had insufficient capacity to carrypeak wet season flows generated by precipitation and snowmelt runoff. Rivers overflowedtheir natural levees in most years and discharged into adjacent low-lying basins, thusattenuating runoff to the Delta. As these flood flows receded, the low-lying basins wouldpartially drain back to the rivers through smaller channels and sloughs; however, thebasins typically remained inundated through late summer [32,33] Seasonal overtopping ofthe pre-development levees supported inland marshes [24,34–36], while riparian forestsexisted on natural riverbanks [37] and grasslands interwoven with vernal pools and valleyoaks extended from the floodplains to the tree-covered foothills [38–40]. Water use bynatural vegetation [41], in combination with the annual cycle of flooding, reduced theamount of precipitation and snowmelt runoff that reached the Delta. As natural leveeswere raised and wetlands and riparian forests were drained and cleared, water use byagriculture replaced water use by native vegetation in the Central Valley and the Delta.Fox et al. [24] estimated that annual water use from the natural landscape was similar tothat of the highly altered contemporary landscape, such that freshwater flow reaching theestuary (i.e., Delta outflow) was minimally changed. In contrast to the Central Valley andDelta, land use changes in the surrounding foothill and mountain watersheds have beenrelatively minor [24]. The remainder of this section reviews previous efforts to characterizepre-development conditions using tree-ring data and flow–salinity modeling approaches.2.2.1. Estimates of Pre-Development Central Valley Runoff from Tree-Ring DataAnnually resolved variations in hydroclimate before the start of instrumented weatherrecords can be inferred from tree-ring records. For some tree species and climate regimes,tree growth is limited by drought stress, such that tree-ring chronologies, or standardizedindices of ring width closely track the occurrence of wet and dry years [42–44]. A droughtatlas from 835 tree-ring chronologies in North America, which covers two millennia,underscores the shortcomings of a relatively short instrumented record for characterizingextremes of hydroclimate [45]. An expanded network of 1285 chronologies identifiesunmatched severe, widespread, persistent Southwest droughts in the medieval period [46],and independent tree-ring evidence from exposed stumps in lakes and rivers suggests thattwo such droughts in the Sierra Nevada may have lasted more than two centuries [47].Paleo-simulations of Mono Lake from tree-ring data independently corroborate the timing
Water 2021, 13, 21395 of 33and magnitude of Stine’s drought-induced low stands and suggest centennial-averageprecipitation and river runoff in the central Sierra Nevada as low as 75% of the 20th centuryvalues during the medieval period [48].Most relevant to our characterization of pre-development San Francisco Estuaryhydrology are quantitative tree-ring reconstructions of annual discharge or runoff forthe Sacramento and San Joaquin Rivers. Streamflow reconstructions from tree-rings aregenerally done by linear regression, in which a time series of unimpaired runoff is calibrated with time series from a network of indices of annual tree-ring width. Regression approaches, which can vary greatly from one study to another, are reviewed elsewhere [49,50]. Reconstructions for many basins in the western United States are available athttps://www.treeflow.info/ (accessed on 9 July 2021). The first such reconstruction, whichestimated flow in the Sacramento River at Bend Bridge (see Figure 1), utilized a network of17 tree-ring chronologies that dated back to 1560. This reconstruction indicated that thewettest (1854–1916) and driest (1917–1950) periods overlapped with the historical periodfor which gaged flows are available in Earle [51].The accuracy of Sacramento River runoff reconstructions over the past 500 years wasimproved by a network of blue oak (Quercus douglasii) chronologies whose collection beganin the mid-1990s [52]. These blue oak chronologies, along with new collections of westernJuniper (Juniperus occidentalis), were utilized with other tree-ring chronologies to reconstructSacramento River runoff back to 869; this work showed that the instrumented flow recordwas deficient in representing long duration (e.g., decadal and longer) droughts and wetperiods [53]. A more recent effort reconstructed annual runoff for the Sacramento andSan Joaquin Rivers and their major tributaries for the interval 900–2012 [20]. In contrastto Earle [51], these reconstructions indicated that, while the instrumented record doesnot reflect the extreme single-year Central Valley droughts, it does include multi-yeardroughts of similar magnitude to the most extreme droughts of the long-term record. Thereconstructions further indicated exceptionally long multi-decadal swings between wetand dry conditions in the medieval period. More recent work applying the SacramentoRiver reconstruction [20] underscores the spatial extent of medieval drought: multi-basincoverage of hydrologic drought during the 1100s in the Sierra Nevada as well as theColorado Rockies [54].2.2.2. Estimates of Pre-Development San Francisco Estuary Salinity from Tree-Ring DataAs discussed above, tree-ring data have been widely used to extend the instrumentedtime series of river flow and runoff. Tree-ring data have also been used to extend timeseries of measured salinity in the estuary, recognizing cause–effect relationships betweenprecipitation, runoff, river flows and estuarine salinity.Extending an earlier reconstruction [52], Stahle [55] used three blue oak tree-ringchronologies to reconstruct salinity in San Francisco Bay over the 673-year period from1333 to 2005. The reconstruction was calibrated with near surface salinity (January throughJuly averages) at a stationary location measured near Golden Gate at Fort Point over theperiod WYs 1922–1952. Based on their salinity reconstruction, the authors concludedthat the droughts of 1977 and 1986–1991 were among the most severe in the 673-yearrecord. They observed that their reconstruction systematically underestimated the salinityduring most of the verification period WYs 1952–2005, citing anthropogenic changes toDelta outflow through increased water use in the watershed and Delta diversions. Foxet al. [56], in a study of San Francisco Estuary salinity trends, provided an alternativeexplanation for the fixed location salinity behavior examined by Stahle [52]. Noting thatsalinity at locations near the ocean are subject to additional drivers besides Delta outflow,Fox et al. [56] concluded that trends at Fort Point (referring to the location as “Presidio”)since 1946 were primarily affected by trends in coastal conditions rather than trends inDelta outflow.Stahle et al. [23] also applied Blue oak tree-ring chronologies to directly reconstruct thelongitudinal position of the X2 isohaline in San Francisco for the 625-year period from 1379
Water 2021, 13, 21396 of 33to 2003. The reconstruction was calibrated with spring X2 data (February through Juneaverages) that were estimated from instrumented salinity gages over the period 1956–2003.Reporting correlations between reconstructed X2 position, sea surface temperature andatmospheric circulation regimes over the north Pacific, they concluded that X2 minimatended to occur during very strong El Niño events but X2 maxima did not appear to occurduring La Niña events. This salinity reconstruction does not represent pre-development X2conditions; rather, it represents how X2 may have fluctuated under the climatic variabilityof the past six centuries given a behavior similar to the contemporary estuary.2.2.3. Models of Pre-Development Central Valley Hydrology and Delta HydrodynamicsPre-development Central Valley hydrology and Delta outflow were characterizedby the California Department of Water Resources (CDWR) [25] utilizing two models tosimulate watershed hydrology. They used the Soil Water Assessment Tool (SWAT) [57] tomodel precipitation–runoff characteristics of the upper elevation Central Valley watershedsand the (California) Central Valley Simulation Model, or C2VSim [58], an integratedhydrologic model, to simulate groundwater and surface water hydrology on the predevelopment Central Valley floor. Land use was based on prior characterizations of naturalvegetation [24,59]. Potential evapotranspiration from natural vegetation was estimatedusing reference evapotranspiration from Orang et al. [60] and vegetation coefficients fromHowes et al. [41]. CDWR [25] estimated a long-term annual average pre-development Deltaoutflow of 23.9 billion cubic meters (BCM) assuming a repeat of a 93-year contemporaryclimate sequence spanning WYs 1922–2014. Gross et al. [22] utilized these modeled valuesto compare inter- and intra-annual variability of pre-development and contemporaryDelta outflow.Pre-development salinity conditions in the San Francisco Estuary were investigatedand compared to contemporary salinity conditions by Andrews et al. [26] using a threedimensional hydrodynamic model [61]. Their pre-development model was based ona planform developed by [62] and bathymetry from multiple sources. Their simulationused observed inflow data from February 2006 to October 2008 to represent wet, dry, andcritically dry water years. Andrews et al. [26] found the dramatic changes in estuary planform and bathymetry, as well as differences in mean sea level between the pre-developmentand contemporary conditions, to have limited influence on saltwater intrusion. The predevelopment estuary was found to have less saltwater intrusion for the same Delta outflowand a faster response of saltwater intrusion to changes in Delta outflow. Due to the changesin seasonal distribution of Delta outflow, saltwater intrusion was found to be less variablefor their contemporary scenario than their pre-development scenario. Changes to theseasonal timing of freshwater flows was reported to have a larger influence on saltwaterintrusion than the changes in estuarine planform and bathymetry. Gross et al. [22] utilized this work to compare inter- and intra-annual variability of pre-development andcontemporary salinity intrusion in the Delta.The aforementioned model studies of pre-development conditions used an analysismethod termed the “level-of-development” approach [63]. In this approach, landscape,channel geometry, and anthropogenic flow modification through reservoirs or withdrawalsare fixed to represent a specific era or scenario (e.g., pre-development conditions, contemporary conditions, planned future conditions) and hydrology is typically represented bya sequence of historically observed precipitation or runoff. Thus, these model studies seekto describe how a pre-development or modern landscape and estuary would respond givencontemporary instrumentally derived climatic inputs.As described later in this paper, our work adopts some level-of-development assumptions to characterize pre-development Central Valley hydrology and Delta hydrodynamics.For example, we assume a stationary pre-development landscape consistent with Foxet al. [24] and CDWR [25] and a stationary pre-development outflow–salinity relationship consistent with Andrews et al. [26]. However, our work deviates from a typicallevel-of-development analysis in one crucial aspect—the driving hydrology is not simply
Water 2021, 13, 21397 of 33represented by repeating the sequence of observed runoff over the instrumented period.Rather, it reflects the estimated runoff over a millennial time scale obtained from thetree-ring proxy record from the watershed.2.3. Early Development ConditionsThe pre-development landscape has been radically modified over two centuries,starting in the mid-18th century when Spanish settlers arrived, bringing livestock andrange management. The discovery of gold along the American River in 1848 spurredagricultural and urban development in the Central Valley. That same year, the federalgovernment transferred ownership of “swamp and overflowed lands” to California on thecondition that they be drained and reclaimed. These permanent wetlands were largelyconverted to agriculture by 1930.Regular flooding on major rivers led to the formation of levees and reclamationdistricts by 1860. Starting in the 1870s, studies were conducted to determine how to reduceflooding and supply irrigation water. The Office of the State Engineer was establishedin 1878 to further these plans, and in 1880 the legislature approved the Drainage Act,proposing valley-wide flood control. These studies culminated in the Central Valley ProjectAct in 1933. Water resources were further reconfigured in response to voter approval ofthe Burns-Porter Act in 1960, financing the State Water Project [64]. Ultimately, the CentralValley was re-plumbed to move water throughout the state in a complex man-made watersystem with some 1300 miles of aqueduct and 1350 surface reservoirs with 40 millionacre-feet (32.4 BCM) of storage [64].Although this period of early development between WYs 1851 and 1911 is poorlyunderstood hydrologically, limited availability of instrumented data facilitated previouswork. Arguably the most significant data set compiled during the latter part of this periodwas published by the California Department of Public Works [65], the predecessor toCDWR. This document, commonly referred to as Bulletin 5, reports a long-term record ofstream flows to the Central Valley beginning in WY 1872.Moftakhari et al. [66] reconstructed a Delta outflow time series spanning the earlydevelopment period (beginning in 1858) through correlation with tide gauge data measured at San Francisco. Moftakhari et al. [67] reconstructed a Delta outflow time seriesbeginning in WY 1850 through correlation with Sacramento River stage data measuredat Sacramento. River stage data were unavailable over WYs 1863–1881; thus, the authorsaugmented the reconstructed outflow time series using the work of Moftakhari et al. [66].MacVean et al. [68] explored the hydrology of the early development period following1850 by synthesizing reconstructed time series of precipitation, basin inflows, land use,and levee construction in a semi-distributed hydrologic model. They concluded that, inspite of significant anthropogenic modifications to the region’s hydrology, by the 1920sDelta outflow remained similar to pre-development conditions, due in part to flow augmentation provided by flood control infrastructure and enhanced channel conveyance.MacVean et al. [68] concluded that levee construction, rather than land use change, had thegreatest impact on Delta hydrology during this early development period.2.4. Contemporary ConditionsExtensive salinity intrusion in the Delta in the early 20th century, caused by a combination of hydrologic variation and upstream land use and hydrologic change, motivateda series of Delta field investigations that led to a better understanding of the relationshipbetween sources of water flows and salinity patterns in the Delta [65]. These findingssupported the development of reservoirs in the upstream watershed to store winter andspring flows and supply irrigation water needs in the summer months. Among the various reservoirs built in the Central Valley, the federal government completed constructionof the 4.5 million acre-feet (5.6 BCM) Lake Shasta in 1944 as part of the Central ValleyProject (CVP) and the state government completed construction of the 3.5 million acre-feet(4.3 BCM) Lake Oroville in 1968 as part of the State Water Project (SWP) (see Figure 1). Over
Water 2021, 13, 21398 of 33a period of roughly three decades, a complex network of reservoirs, aqueducts, pumpsand gates was constructed to facilitate transport of water to other parts of the state foragricultural and municipal use.Today, regulatory activity related to the management of estuarine flow and salinity isled by the California State Water Resources Control Board (CSWRCB), an agency concernedwith both the water quality and water rights adjudication in California. In August 1978,the CSWRCB adopted its Delta Plan and Decision 1485 which set objectives for Deltaoutflow [69]. CSWRCB updated its Delta Plan in 1995 and adopted Decision 1641 in2000 [70], which is still in force. The position of the X2 isohaline is a particular focusof salinity regulation in the estuary, and target ranges are defined by season and wateryear type. The position of the X2 isohaline is managed through control of out-of-basinexports from the Delta and reservoir outflows from major CVP and SWP reservoirs inthe watershed.Based on continued risk to certain endangered aquatic species, additional restrictionswere imposed on the system through biological opinions rendered by the U.S. Fish andWildlife Service in 2008 [71] and the National Marine Fisheries Service [72] under theU.S. Endangered Species Act. Both biological opinions were recently updated [73,74].Additional flow regulations are being considered as part of the CSWRCB’s Delta Planperiodic review [18,75].A variety of models have been developed to interpret flow and salinity intrusionin the contemporary Delta; these models are used for research, regulator
data to estimate salinity changes using a tree-ring based hydrologic sequence [23]. By using a tree-ring based hydrologic sequence in conjunction with a modeling approach that estimates pre-development estuarine flow and salinity responses, this work attempts to represent the actual range of flow and salinity conditions over long time .