Transcription
M&A #10‐098‐01UPPER NEWPORT BAY ECOSYSTEM RESTORATION PROJECTPOST‐RESTORATION MONITORING PROGRAMANNUAL REPORTYEAR 3 – 2013UPPER NEWPORT BAY ECOLOGICAL RESERVEORANGE COUNTY, CALIFORNIAMarch 2014Prepared for:U.S. Army Corps of EngineersContact: Mr. Lawrence Smith915 Wilshire Blvd, Suite 980Los Angeles, CA 90017Office: (213) 452‐3846Prepared by:Merkel & Associates, Inc.Contact: Ms. Rachel Woodfield5434 Ruffin RoadSan Diego, California 92123Office: (858) 560‐5465Rachel A. Woodfield, Senior Biologist/Project ManagerKeith W. Merkel, Principal Consultant
UNB Post‐restoration Monitoring Program –Year 3 ReportMarch 2014TABLE OF CONTENTS1.0INTRODUCTION . 11.1.1.2.1.3.1.4.2.0RESTORATION NEED AND DESIGN . 1UNB ECOSYSTEM RESTORATION PROJECT IMPLEMENTATION . 3POST‐RESTORATION MONITORING . 3HORIZONTAL AND VERTICAL REFERENCE DATA. 5PHYSICAL MONITORING . 72.1.2.2.3.0BATHYMETRIC MONITORING. 7LEAST TERN ISLAND ELEVATIONS . 15BIOLOGICAL MONITORING . 173.1.VEGETATION MONITORING. 174.0RECOMMENDATIONS . 265.0SUMMARY . 266.0REFERENCES . 27LIST OF TABLESTable 1. Post‐restoration monitoring program schedule – final version. . 4Table 2. Elevation (feet MLLW, 83‐01 epoch) of three control points at New Least Tern Island. . 15Table 3. Area of habitats within the UNB study area (March 2013). . 19Table 4. Comparison of key habitats (ha.) within the UNB study area during Years 1, 2, and 3. . 23LIST OF FIGURESFigure 1.Figure 2.Figure 3.Figure 4.Figure 5.Figure 6.Figure 7.Project Vicinity Map . 22011, 2012, and 2013 UNB Bathymetry . 82011 and 2012 Bathymetry and Change Analysis . 9Pre‐restoration (2006) and Post‐restoration (2011) Bathymetry . 10Change Analysis Between September 2010 Post‐dredge Survey and January 2011 Survey . 14Upper Newport Bay Habitat Map (March 2013). . 20Comparison of Habitat Distributions Between Years 1 (2011), 2 (2012), and 3 (2013). . 25LIST OF APPENDICESAppendix A. Upper Newport Bay Ecosystem Restoration Project Features and SummaryAppendix B. Bathymetric Plots Enlarged from Figure 2Merkel & Associates, Inc. #10‐098‐01i
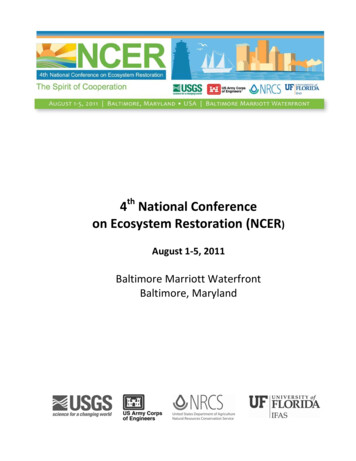
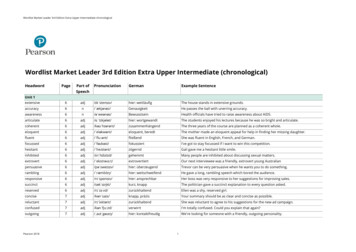
UNB Post‐restoration Monitoring Program –Year 3 ReportMarch 2014UPPER NEWPORT BAY ECOSYSTEM RESTORATION PROJECTPOST‐RESTORATION MONITORING PROGRAMANNUAL REPORTYEAR 3 – 2013Merkel and Associates, Inc.March 20141.0 INTRODUCTIONNewport Bay is located on the southern California coast, approximately 40 miles south of LosAngeles (Figure 1). From the harbor entrance at the rocky headland at Corona del Mar, NewportBay extends about 3.5 miles north northeastward. Newport Bay is a combination of two distinctunits, termed "Lower Bay" and "Upper Newport Bay” (UNB), divided by the narrows at Pacific CoastHighway (PCH) Bridge (Figure 1). The 752‐acre Lower Bay, where the majority of commerce andrecreational boating exists, is heavily developed (predominantly as residential properties) and is adeep basin coastal lagoon. The 1,000‐acre UNB is a drowned river valley, geologically much olderthan the Lower Bay, and is largely undeveloped. This portion of the bay is more formally consideredto be an estuary. Much of UNB is included in the Upper Newport Bay Ecological Reserve, managedby the California Department of Fish and Wildlife (CDFW) (formerly the California Department ofFish and Game).Upper Newport Bay is one of the largest coastal wetlands remaining in southern California. Naturalhabitats within UNB include open marine waters, intertidal mudflats, cordgrass‐dominated low saltmarsh, pickleweed‐dominated mid salt marsh, high salt marsh, salt panne, riparian, freshwatermarsh, and upland. Because of its diversity of habitats and its location on the Pacific Flyway, UNBsupports an impressive number and diversity of birds, particularly during fall and winter whenshorebirds and waterfowl arrive from their northern breeding grounds. Upper Newport Bay alsosupports several endangered bird species and an endangered plant. The subtidal and intertidalwaters of UNB provide important habitat for marine and estuarine fishes.1.1.Restoration Need and DesignBy the end of the 20th century, the ecological diversity and functionality of UNB was increasinglythreatened by sedimentation from the surrounding urbanized watershed. The primary source offreshwater and sediment loads to UNB is San Diego Creek, which drains approximately 85 percentof the 98,500‐acre San Diego Creek watershed. Sediment from the San Diego Creek watershed hadincreasingly filled open water areas within UNB. This sedimentation decreased the extent of tidalinundation, diminished water quality, degraded habitat for endangered species, migratory waterbirds, and marine and estuarine fishes. It also resulted in navigation problems in UNB marinas andnavigation channels. If sediment deposition within UNB had been allowed to continue, theremaining open water areas would have eventually evolved into mudflats, and later, marsh orupland habitat, resulting in a loss of ecological diversity.Merkel & Associates, Inc. #10‐098‐011
10-098-01aerial photo source: ACOE October 26, 2010Santa BarbaraLos AngelesNewport BeachEANNewNew LeastLeastTernTern IslandIslandMAP AREAUnitUnit I/IIII/IIIBasinBasinSan DiegoUnitUnit eachUpperUpperIslandIslande RoadOCoreIFI makerIslandIslandLaunchLaunch RampRampPPaacciific 4008001,200MetersSite Locator and Vicinity MapUpper Newport Bay Ecosystem Restoration ProjectPost-restoration Monitoring ProgramFigure 1Merkel & Associates, Inc.
UNB Post‐restoration Monitoring Program –Year 3 ReportMarch 2014It became clear that a program was needed to develop a long‐term management plan to controlsediment deposition in UNB and to preserve the health of its habitats. Through a partnershipamong the U.S. Army Corps of Engineers (ACOE), the County of Orange, CDFW, and the CaliforniaCoastal Conservancy, the UNB Ecosystem Restoration Project was developed.The restoration project was designed to allow for the effective management of sedimentsdeposited into the bay, reduce the frequency of maintenance dredging, improve or restoreestuarine habitats, sustain a mix of open water, mudflat, and marsh habitat, increase tidalcirculation for water quality, reduce predator access to sensitive habitats, improve public use andrecreational access, and improve educational opportunities. Sediment will continue to bedeposited into UNB to varying degrees depending on what control measures are implemented inthe watershed. Therefore, one of the most important components of the project was to develop aplan to control sediments by designing two in‐bay basins into which the bulk of the sediment wouldbe captured and from which effective maintenance dredging removals could be undertaken.1.2.UNB Ecosystem Restoration Project ImplementationAfter an extensive process of planning and environmental review, the restoration project wasinitiated in 2006. The first phase was conducted from April 2006 to July 2009. The second phasewas conducted from November 2009 to October 2010. The total cost of restoration wasapproximately 37.4 million. Key project features included expansion and deepening of twosediment control basins (Basin I/III and Basin II), deepening of channels around five restorationislands, creation of three large mudflats, relocation of a least tern nesting island, installation ofmaintenance access at the two nesting islands, and installation of interpretive signs and buoys.Approximately 2.35 million cubic yards of sediment was dredged as part of the project. A detailedproject summary and map labeled with key restoration features is provided in Appendix A.1.3.Post‐restoration MonitoringIn order to detect and document the long‐term development processes following the restoration,the ACOE prepared the Post‐restoration Monitoring Program for the Upper Newport Bay EcosystemRestoration Project (ACOE 2010). The program outlines ten years of biological and physicalmonitoring, as detailed in the following sections. The schedule for the various monitoring events isprovided in Table 1. The table has been adjusted slightly from prior versions to reflect the actualmonths the monitoring was conducted in during the first three years of monitoring.The ACOE has contracted with Merkel & Associates, Inc. (M&A) to implement portions of the firstthree years of the Post‐Restoration Monitoring Program, after which time the ACOE commitment topost‐restoration reporting will be completed and the County of Orange and CDFW will share theresponsibility for the monitoring and reporting in Years 4 through 10 (note that Year 4 has nomonitoring requirements).Merkel & Associates, Inc. #10‐098‐013
UNB Post‐restoration Monitoring Program –Year 3 ReportMarch 2014Table 1. Post‐restoration monitoring program schedule – final version.Post-Restoration Annual CycleTASKPhysical Monitoring ProgramBiological Monitoring ProgramGeneral Avian SurveysSpecies of Special ConcernFisheriesEpibenthicBenthic InfaunaVegetationAerial Photogrammetry and GeoreferencingVegetation Mapping and GroundtruthingVeg TransectsCordgrass MonitoringCRAM SurveyData Management and AnalysisQuality Assurance ProgramReporting ProgramQuarterly Summary ReportsAnnual ReportsData CollectionFRESTORATION CONSTRUCTION COMPLETED OCTOBER 2010Bathymetric MappingTidal MonitoringWater QualityLeast Tern Island ElevationsJMAMJJASPost-Restoration ProgramONDYear 12011Year 22012Year ar 52015Year 82018XXXXXXYear XXXXXXXXXXXXXXXXXXXXProject Milestone / Report DeliverableMerkel & Associates, Inc. #10‐098‐014
UNB Post‐restoration Monitoring Program –Year 3 ReportMarch 2014The goals and questions to be assessed by the program, as excerpted from the Monitoring Programdocument, include:1. Are the sediment basins performing according to the design goals?a. Do the basins have enough capacity such that maintenance dredging will not berequired for 20 years (given the rate of sediment accumulation within the basins)?b. Are the basins trapping the majority of the sediment that enters the upper bay, andthus minimizing sediment accumulation in the tidal channels and the lower portionsof the bay?2. Has the restoration project reduced turbidity in the bay (by trapping incoming sedimentdeep in the basins)?3. Are the deepened basins receiving adequate dissolved oxygen? There are concerns aboutincreased density stratification and reduced oxygen supply to the deepest layers.4. Has the project resulted in increased eelgrass survival in the upper bay?5. Has the project resulted in increased (water) volume within the bay such that the waterresidence time in the bay is significantly increased [sic]?6. Has the project resulted in improved diversity and abundance of benthic infauna andepifauna?7. Has the project resulted in a significant increase in the number of targeted birds using UNB?Targeted species include listed species.8. Has the project led to significant increases in fisheries habitat? Tracking habitat utilizationand relative abundance across multiple species [sic].9. Has the project resulted in the gain or loss of any habitat type greater then 10%?The restoration project was completed in October 2010. The first monitoring year extended fromJanuary to December 2011, the second year from January to December 2012, and the third yearfrom January to December 2013. This document serves as the third annual report, coveringmonitoring performed in 2013.1.4.Horizontal and Vertical Reference DataMeasurement units of numerical data from the monitoring program are presented as acombination of metric and English Standard System units in this report. Typically, collectedscientific data would be reported using metric units such as hectares and meters. However, UNBhas a long regulatory, engineering, and biological monitoring history that has made use of a blendof metric and English units. As a result, presentation of data has sought to continue using the unitsof measure that are most applicable to the various monitoring elements. Additionally, for someparameters such as tidal elevation and habitat area measurements, metric unit presentations areMerkel & Associates, Inc. #10‐098‐015
UNB Post‐restoration Monitoring Program –Year 3 ReportMarch 2014less familiar to most readers than English units. Therefore, where an area measurement has beenmade through GIS‐based mapping efforts, the results are presented in hectares, with conversions toacres provided due to the greater ease with which many readers can envision areas in this unit ofmeasurement. Tidal data are presented in feet, rather than meters, due to the greater familiarity ofmost readers with tidal ranges in feet and the historic usage of English units for this element of theproject. Additionally, discussion of sediment accumulation and dredging volumes will be in cubicyards due to the prevalence of this unit in the commercial dredging field. All other data, primarilybiological measurements taken in the field, are reported in metric units.The vertical datum used throughout this document is Mean Lower Low Water (83‐01 epoch).Horizontally geo‐referenced data are on the California State Plane Zone 6, North American Datumof 1983 (NAD 83).Merkel & Associates, Inc. #10‐098‐016
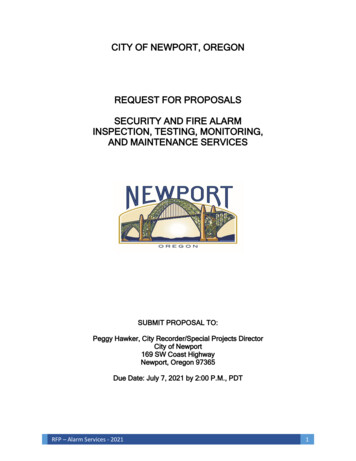
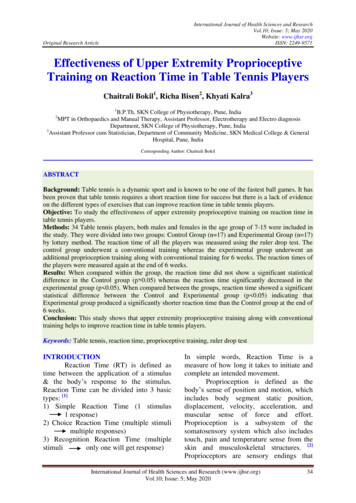
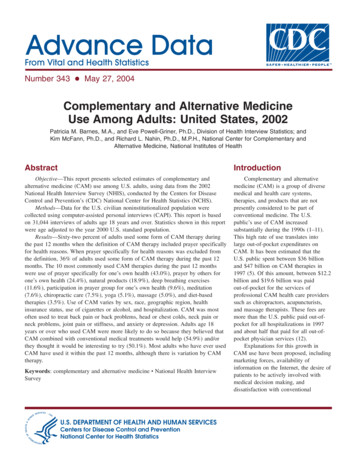
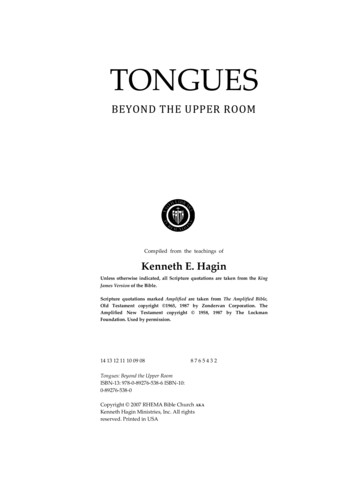
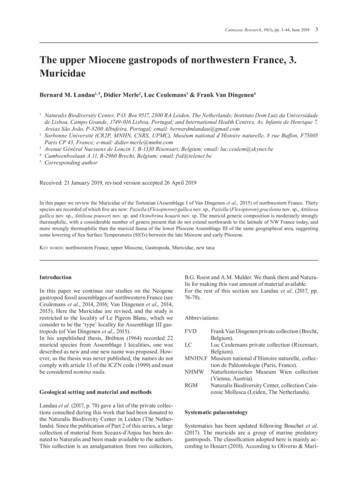
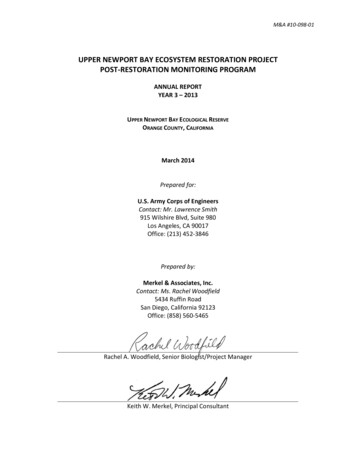
UNB Post‐restoration Monitoring Program –Year 3 ReportMarch 20142.0 PHYSICAL MONITORINGDuring the third year post‐restoration, physical monitoring was limited to collection of bathymetricdata and checking the elevation of the new least tern island (Table 1).2.1.Bathymetric MonitoringMethodsThe ACOE completed the annual bathymetric surveys of the restoration project area and providedthe collected data to M&A for analysis. ACOE Los Angeles District survey personnel collectedbathymetric data in 2013 between February 26 and 28, 2013. The information collected was amerged dataset from single beam and multi‐beam sonar on a 3‐foot grid. The vertical datum wasfeet MLLW and the horizontal datum was State Plane, Zone 6, NAD 83, feet. This dataset served asthe Year 3 (2013) post‐restoration bathymetric condition.The bathymetric data were provided to M&A as point data. The point data were imported into theGIS software ESRI ArcView and converted to a grid with no subsequent interpolation. The Year 3data are presented in Figure 2 alongside the Year 1 and Year 2 data also collected by ACOE andprovided to M&A as point data.The ESRI extension 3D Analyst was used to perform a neat line loss/gain volume analysis betweenthe grids to calculate the total volume change. Subtractions between the grids were performed andthe resulting grids prepared to illustrate areas of accretion and erosion between years. Thesecomparison plots are presented in Figure 3 and show comparisons between Years 1 and 2, Years 2and 3, and Years 1 and 3. Regions within the study area that were not captured by bothbathymetric surveys have been left blank and excluded from calculations of change.Areas of positive change (accretion) were plotted in shades of red and areas of negative change(erosion) were plotted in shades of blue. To be clear, the “accretion” and “erosion” terminologyused is for convenience and does not necessarily reflect particular processes involved in apparentgains and losses of sediment volume. One very important factor in evaluating these differencespertains to sediment density. Because the bathymetric analyses are restricted to comparisons ofacoustically detected sediment surfaces, no information is available to distinguish between bulkedor consolidated sediments.Larger, higher resolution versions of each of the three images in Figure 2 are provided in Appendix Bto allow the reader more detailed examination. M&A has not been tasked with evaluating thequality of the data or adjusting the data to remove survey related noise. There appear to be somelinear artifacts in the survey records (visible in Appendix B) that are related to the survey boattracks rather than true bathymetric features, though the effects of these artifacts on the overallchange analysis are believed to be minor.The ACOE also provided M&A point data from a bathymetric survey performed in 2006 prior to theinitiation of dredging for the restoration project, which began that year. This survey is presented inFigure 4 next to the first complete post‐restoration bathymetric survey performed by ACOE inMerkel & Associates, Inc. #10‐098‐017
10-098-01Jan/Feb/Mar 2011Jan 2012Feb 2013Feet (MLLW)-1.9 - 0.0-3.9 - -2.0-5.9 - -4.0-7.9 - -6.0-9.9 - -8.0-11.9 - -10.0-13.9 - -12.0-15.9 - -14.0-17.9 - -16.0-19.9 - -18.0-21.9 - -20.0-22.2 - -22.0Aerial photo source: Skyview Aerial Photo, Inc. 20132011, 2012, and 2013 BathymetryUpper Newport Bay Ecosystem Restoration ProjectPost-restoration Monitoring Program - Year 3Figure 2Merkel & Associates, Inc.
10-098-01Change from 2011 to 2012Change from 2012 to 2013Change from 2011 to 2013Difference (ft) -1.0-1.0 - -0.5EROSION-0.5 - -0.1-0.1 - 0.1 NO CHANGE0.1 - 0.50.5 - 1.0ACCRETION 1.0Aerial photo source: Skyview Aerial Photo, Inc. 20132011, 2012, and 2013 Bathymetry Change AnalysisUpper Newport Bay Ecosystem Restoration ProjectPost-restoration Monitoring Program - Year 3Figure 3Merkel & Associates, Inc.
10-098-012006 Pre-restoration2011 Year 1 Post-restorationFeet (MLLW)-1.9 - 0.0-3.9 - -2.0-5.9 - -4.0-7.9 - -6.0-9.9 - -8.0-11.9 - -10.0-13.9 - -12.0-15.9 - -14.0-17.9 - -16.0-19.9 - -18.0-21.9 - -20.0-22.2 - -22.0Bathymetry Source: ACOEAerial photo source: Image Trader 2005Aerial photo source: Skyview Aerial Photo, Inc. 2013Pre-restoration (2006) and Post-restoration (2011) BathymetryUpper Newport Bay Ecosystem Restoration ProjectPost-restoration Monitoring Program - Year 3Figure 4Merkel & Associates, Inc.
UNB Post‐restoration Monitoring Program –Year 3 ReportMarch 2014January, February, and March 2011, roughly four months after completion of dredging inSeptember 2010 (referred to above as the Year 1 2011
Coastal Conservancy, the UNB Ecosystem Restoration Project was developed. The restoration project was designed to allow for the effective management of sediments deposited into the bay, reduce