Transcription
Bob Brooks Auction0805404Source Water Assessment ReportA State Assessment of Your Drinking Water Source’sVulnerabilityAs a requirement of the 1996 Amendments to the Federal Safe DrinkingWater Act, New Jersey Department of Environmental Protection (DEP)performed a source water assessment of each source of public drinkingwater and determined each source’s susceptibility to contamination.Susceptibility is a measure of the potential exposure of a drinking water source to contamination; actual(if any) contamination is not measured.DEP, in conjunction with the United States Geological Survey (USGS), performed the following steps todetermine the drinking water source’s susceptibility. Identifying the area (known as the source water assessment area) that supplies water to your publicdrinking water system; Inventorying any significant potential sources of contamination in the area; and Analyzing how susceptible the drinking water source is to the potential sources of contamination.DEP evaluated the susceptibility of all public water system sources to eight categories of contaminants. Pathogens: Disease-causing organisms such as bacteria and viruses. Common sources are animal and humanfecal wastes.Nutrients: Compounds, minerals and elements that aid growth, that are both naturally occurring and manmade. Examples include nitrogen and phosphorus.Volatile Organic Compounds: Man-made chemicals used as solvents, degreasers, and gasoline components.Examples include benzene, methyl tertiary butyl ether (MTBE), and vinyl chloride.Pesticides: Man-made chemicals used to control pests, weeds and fungus. Common sources include landapplication and manufacturing centers of pesticides. Examples include herbicides such as atrazine, andinsecticides such as chlordane.Inorganics: Mineral-based compounds that are both naturally occurring and man-made. Examples includearsenic, asbestos, copper, lead, and nitrate.Radionuclides: Radioactive substances that are both naturally occurring and man-made. Examples includeradium and uranium.Radon: Colorless, odorless, cancer-causing gas that occurs naturally in the environment. For more informationgo to http://www.nj.gov/dep/rpp/radon/index.htm or call (800) 648-0394.Disinfection Byproduct Precursors: A common source is naturally occurring organic matter in surface water.Disinfection byproducts are formed when the disinfectants (usually chlorine) used to kill pathogens react withdissolved organic material (for example leaves) present in surface water.To determine a source’s susceptibility to these contaminants, the USGS, with DEP assistance, developedstatistical models based on extensive analysis of existing well sample data and surface water intake data.The statistical models determined the relationship between environmental factors and the probability forcontamination to occur. These models identified factors, such as land use or geology, found to besignificantly “linked” to a public water system source’s potential to become contaminated by one or morecategories of contaminants. DEP and USGS looked at factors that might affect the quality of drinkingwater sources and separated them into two categories.1
How “sensitive” the water supply is to contamination. For example, a shallow well or surface watersource, like a reservoir, would be more exposed to contamination from the surface or above groundthan a confined well.How frequently a contaminant is used or exists near the source. This is known as “intensity of use.”For example, the number and/or types of activities (such as industry or agriculture) surrounding thesource.The specific sensitivity and intensity of use factors and their values within each source water assessmentarea for your source(s) are provided on page 7 of this report.Using the susceptibility factors, the statistical models provided a numerical score for each source ofdrinking water for each contaminant category. These were then converted into high (H), medium (M), orlow (L) susceptibility ratings.The Safe Drinking Water Standards or Maximum Contaminant Levels (MCLs) were used to define thethree susceptibility ratings (H, M, and L). These standards are developed based health effects, analyticaland treatment factors on either acute or long-term impacts related to drinking water exposure. A lowsusceptibility rating means a potential contaminant level was predicted to be less than 10 percent of theMCL for that contaminant category. A medium rating means the potential contaminant level waspredicted to be equal to or greater than 10 percent and less than 50 percent of the MCL. A high ratingwas assigned to those sources that were predicted to have potential contaminant levels equal to or greaterthan 50 percent of the MCL. Sources with high susceptibility ratings are still likely to have contaminantconcentrations below the MCL.The susceptibility ratings of your sources to each of the contaminant categories are provided on page 6 ofthis report.Source Water Assessment Program GoalsThe information obtained from the source water assessments may be used to achieve the following goals:1. Protect sources of drinking water.Source water protection focuses on preserving and protecting the public drinking water source. Thesource water assessment results may be used by DEP, purveyors, and local planning officials to lay thegroundwork for advancing drinking water protection efforts. State and local agencies, as well as theregulated community, have made significant strides to protect the quality of our water resources. Majorwater quality improvements have been made as a result of water quality and drinking water standards andprograms (both regulatory and nonregulatory) designed to ensure standards are met. Waste managementand clean up programs have had success in controlling releases and ensuring actions are taken to achievestandards if releases occur. Recent measures to control non-point sources have expanded the DEP’s waterquality protection programs by recognizing the link between land use change and water resource impacts.The Safe Drinking Water Program is designed to ensure that water delivered for human consumptionmeets drinking water standards. In addition to these programs, major initiatives such as the HighlandsWater Protection and Planning Act, Surface Water Quality Standards and Category One Designation, andStormwater Management Rules have recently been accomplished. Despite this success, the DEPrecognizes the ongoing importance of using new information such as that from the source waterassessments to evaluate the need for additional protection measures of drinking water sources. The DEP iscurrently reviewing the source water assessments to identify any necessary additional source waterprotection measures.2
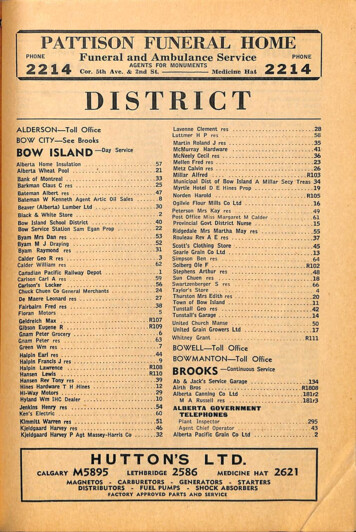
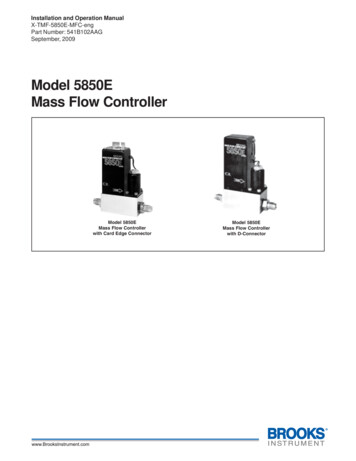
2. Public education of SWAP information.DEP incorporated public education throughout the development and implementation of the Source WaterAssessment Program. During the source water assessment process, DEP met with interested parties,beginning with the development of the SWAP Plan, published articles, wrote two newsletters, anddeveloped a SWAP web site. The SWAP web site contains information on the program, technicalresources, frequently asked questions, source water assessment results, and links to additional sites ofinterest. Upon completion of the source water assessments, DEP generated a source water assessmentreport for each public water system to report the susceptibility ratings of public drinking water sources topotential contamination.The goal of the public education efforts is to raise public awareness of the source of their drinking waterand the potential contaminants that could impair the water's quality. To continue fulfilling the educationgoal, DEP will conduct training sessions following the release of the Source Water Assessment Reports.3. Establish a customized monitoring schedule for each public water system.The source water assessments will assist DEP in improving current monitoring requirements forindividual public water systems. Currently, the Environmental Protection Agency (EPA) and the DEPhave mandatory monitoring schedules that depend on a variety of factors that can include the source ofthe water (ground water or surface water) and the surrounding land use. These schedules may becustomized based on the susceptibility of the sources of drinking water.Where does drinking water come from?There are two basic sources of drinking water: ground water and surface water.Ground water is water found beneath the Earth’s surface. Ground water comes from rain and snowseeping into rock and soil. Ground water is stored in underground areas called aquifers. Aquifers supplywells and springs. Wells in New Jersey range from about 15 feet to 2,000 feet deep.Surface water is the water naturally open to the atmosphere, such as rivers, lakes, streams and reservoirs.Precipitation that does not infiltrate the ground or evaporate into the sky runs off into surface waterbodies.Ground water can seep into a stream, river or other surface water body, recharging surface water bodies.Likewise, under some circumstances, surface water can seep into an adjacent aquifer.A water system obtains its water from 1) wells drilled into the ground that pump out ground water; 2)devices called surface water intakes placed on a river, stream, or reservoir; or 3) both.What factors may affect the quality of your drinking water source?A variety of conditions and activities may affect the quality of drinking water source. These includegeology (rock and soil types); depth of a well or location of a surface water intake; how the landsurrounding the source is used (for industry, agriculture or development); the use of pesticides andfertilizers; and the presence of contaminated sites, leaking underground storage tanks, and landfills.Please refer to pages 6 and 7 of this report for specific potential contaminant source information.3
Illustration courtesy of USGSWhat steps are being taken now to ensure my drinking water quality?The DEP has numerous programs in place to maintain and protect the quality of our State's waterresources. For example, the Safe Drinking Water Program is designed to ensure that water delivered forhuman consumption meets DEP's stringent health-based drinking water standards. Additionally, DEP haspermitting, waste management, and clean up programs in place to avoid and control potentialcontamination. Key DEP drinking water protection initiatives will be phased-in over time in source waterassessment areas to advance existing program protections.What can you and others do to help?While government at the state and local levels can do their part, there are actions you and your neighborscan take now to help protect our precious and shared natural resource.Here’s just a few ways you and others can help ensure clean and plentiful water for New Jersey – now andin the future. Join us today for a clean water future. Dispose of waste properly. Some materials such as motor oil, paint, flea collars, and householdcleaners have the potential to contaminate source water. Contact your local Department of PublicWorks for proper household hazardous waste disposal. Limit your use of fertilizer, pesticides, and herbicides.Here are some actions that municipal and county officials/local and county planners can take and you canhelp encourage and support. Manage and work with owners of existing potential contaminant sources to minimize potentialcontamination. Establish regulations prohibiting or restricting certain activities or land uses within the source waterassessment area. Take appropriate enforcement action when necessary. Update municipal master plans to ensure greater protection. Purchase lands or create conservation easements within the source water assessment area.4
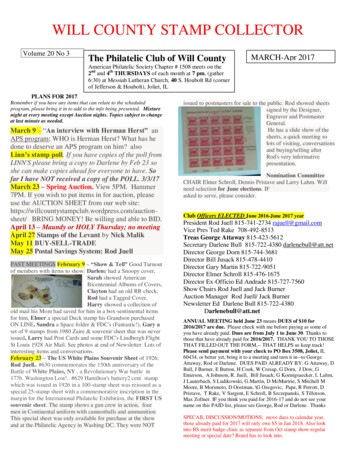
Specific Source Water Assessment Information for Bob Brooks AuctionBob Brooks Auction (PWID 0805404) at 1085 Delsea Drive, Malaga, NJ, is a public noncommunitywater system that serves approximately 100 people (in 2003). Bob Brooks Auction consists of 1 activewell(s) and 0 surface water intake(s).Susceptibility RatingsTable 1 below illustrates the percentage of noncommunity water system sources in New Jersey that ratedhigh, medium, and low for each of the eight contaminant categories. This table is separated by sourcetype: ground water and surface water. Table 2 illustrates the susceptibility ratings for each source inyour system to each of the contaminant categories.For the purpose of the Source Water Assessment Program, radionuclides were considered more of aground water concern than a surface water issue. As a result, surface water intakes’ susceptibility toradionuclides was not determined and they all received a low rating. DEP considered all surface waterhighly susceptible to pathogens; therefore all intakes received a high rating for the pathogen lidesRadonDisinfectionByproductPrecursorsGround Water3480 Total WellsHighMediumLowSurface Water3 Total IntakesHighMediumLowPathogensTable 1: Summary of Statewide Susceptibility Ratings for Noncommunity WaterSystem Sources 1000033670067330336710000001000010010000Statewide, 85 percent of the noncommunity water system sources (ground water and surface water) ratedhigh for at least one of the contaminant categories.For surface water, the three contaminant categories in which all of the noncommunity water systemsurface water intakes (three total) received a high susceptibility rating were inorganics, disinfectionbyproduct precursors, and pathogens (all assumed to be highly susceptible to pathogens).For ground water, the three contaminant categories in which the highest percentage of sources received ahigh susceptibility rating are radionuclides (69%), volatile organic compounds (32%), and inorganics(19%).5
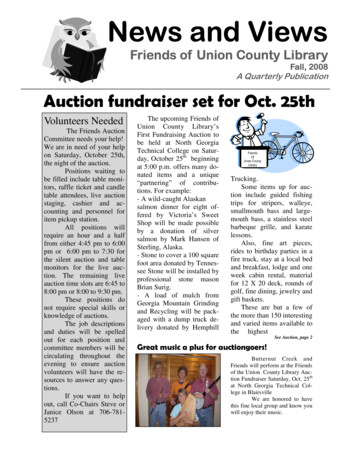
rsWellPathogensSourcesTable 2: Susceptibility Ratings for Bob Brooks Auction’s atingLMMLLHMMIf a system is rated highly susceptible for a contaminant category, it does not mean a customer is orwill be consuming contaminated drinking water. The rating reflects the potential for contamination ofsource water, not the existence of contamination. Public water systems are required to monitor forregulated contaminants and to install treatment if any contaminants are detected at frequencies andconcentrations above allowable levels.Which Sensitivity and Intensity Factors Determine a Source’s Susceptibility?The susceptibility models determined source water susceptibility is based on the well or intake’s locationand sensitivity and intensity factors (also known as explanatory variables). An explanatory variable canbe used to predict the presence of or the potential presence of a contaminant in ground water or surfacewater.Some explanatory variables are considered conceptual. A conceptual variable is one that has been shownin a previous scientific investigation to be related to, or is expected to have an effect on, theconcentrations of a constituent. Conceptual variables that did not produce significant univariate statisticalrelations may however, produce a significant relation when used with other variables in multivariatestatistical tests.The following page contains an Individual Explanatory Variable Inventory, which provides the values ofeach explanatory variable within your source water assessment area. This is not the entire potentialcontaminant source inventory for this system’s source(s).If the variable value is shown as zero, then attributes or land activities are not present in the source waterassessment area. If a value is not shown, this represents either unavailable data, or in the case of “Distanceto” variables land activities of that type are not present in the source water assessment area.This information, used in conjunction with USGS’s susceptibility rating scheme, calculates thesusceptibility rating for each source to each contaminant category. If you are interested in USGS’s ratingschemes please refer to the “Contaminant Category Scoring System for Noncommunity Water SystemsAppendix A – Attachment 2” available in the Noncommunity Source Water Assessment Report forFranklin Twp, Gloucester County or on the Source Water Assessment Program website athttp://www.state.nj.us/dep/swap/.Following the Individual Explanatory Variable Inventory for your system is a source water assessmentmap illustrating the source water assessment areas for systems with in Franklin Twp.For more information please refer to the Noncommunity Source Water Assessment Report for FranklinTwp, Gloucester County, available on the Source Water Assessment Program website. You may alsocontact the Bureau of Safe Drinking Water at 609-292-5550.6
Individual Explanatory Variable Groundwater Susceptibility ModelsSource: Well Status: P Source Type: GSensitivity Variable InventoryIntensity Variable InventoryPathogens Explanatory Variables - Source Rating LConceptual-Soil Available Water Capacity0.11Distance to Agricultural Land Use, 1995Depth to Top of Open IntervalConceptual Septic Tank DensityConceptual - GWUDIConceptual – Presence of Streams, Tier 1148.480Nutrients Explanatory Variables – Source Rating MConceptual – Depth to Top of Open IntervalConceptual – Length of Open Interval% Urban Land Use, 1995% Agricultural Land Use, 198656.390Pesticides Explanatory Variables – Source Rating MConceptual – Depth to Top of Open IntervalConceptual – Length of Open Interval% Urban Land Use, 1995% Agricultural Land Use, 1986Distance to Agricultural Land Use, 1995Conceptual – Distance to golf course56.390VOCs Explanatory Variables – Source Rating L% Soil Organic Matter0.65% Impervious Surface, 1995% Commercial/Industrial Land Use, 1995Sq. Mi. of Urban Land Use, 1995Density of SWL, USTs, and KCSL13.527.150.010Inorganics Explanatory Variables – Source Rating LDissolved Oxygen of water-quality samplepH of water-quality sampleDepth to Top of Open Interval% Soil ClaySoil Hydraulic ConductivityConceptual % Soil Organic Matter11018.9142.450.65COASTALPLAINPhysiographic ProvinceDensity of KCSL, SWL, NJPDESGW/SW/Storm, Compost Facilities,SWRRF, SWTF200011, Class BRecycling, DPCC, USTDistance to Agricultural Land Use, 1995Population Density, Tier 1% Barren Land Use, 1995% Urban Land Use, 1970Distance to STPSTP DensityDistance to DOT roadsLength of railroadsPopulation s Explanatory Variables – Source Rating HpH of water-quality samplePhysiographic ProvinceConceptual Depth of WellConceptual Soil Hydraulic ConductivityCOASTALPLAIN11042.45% Urban Land Use, Tier 1, 1995Conceptual Distance to Agricultural LandUse, 1995% Developed Land, Tier 1, 1995% Agricultural Land Use, 197090.490.444.7Radon Explanatory Variables – Source Rating MConceptual % Soil Clay18.91COASTALPLAIN110Physiographic ProvinceDepth to Top of Open Interval% Agricultural Land Use, 1995Conceptual Distance to Wetlands LandUse, 19950429.93DBPs Explanatory Variables – Source Rating MConceptual – % Soil Organic MatterConceptual NJGS Hydrologic Unit (aquifer)pH of water-quality sample0.65Conceptual – Sq. Mi. of Wetlands LandUse, 1995Number of NJPDES SW/GW/Storm,Compost, SWWRF, SWTF200011, ClassB Recycling, and DPCC00
Specific Source Water Assessment Information for Bob Brooks Auction Bob Brooks Auction (PWID 0805404) at 1085 Delsea Drive, Malaga, NJ, is a public noncommunity water system that serves approximately 100 people (in 2003). Bob Brooks Auction consists of 1 active well(s) and 0 surface water intake(s). Susceptibility Ratings