Transcription
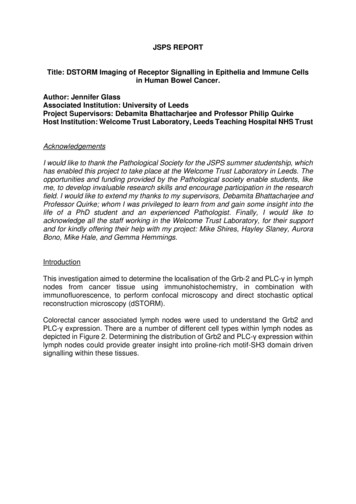
JSPS REPORTTitle: DSTORM Imaging of Receptor Signalling in Epithelia and Immune Cellsin Human Bowel Cancer.Author: Jennifer GlassAssociated Institution: University of LeedsProject Supervisors: Debamita Bhattacharjee and Professor Philip QuirkeHost Institution: Welcome Trust Laboratory, Leeds Teaching Hospital NHS TrustAcknowledgementsI would like to thank the Pathological Society for the JSPS summer studentship, whichhas enabled this project to take place at the Welcome Trust Laboratory in Leeds. Theopportunities and funding provided by the Pathological society enable students, likeme, to develop invaluable research skills and encourage participation in the researchfield. I would like to extend my thanks to my supervisors, Debamita Bhattacharjee andProfessor Quirke; whom I was privileged to learn from and gain some insight into thelife of a PhD student and an experienced Pathologist. Finally, I would like toacknowledge all the staff working in the Welcome Trust Laboratory, for their supportand for kindly offering their help with my project: Mike Shires, Hayley Slaney, AuroraBono, Mike Hale, and Gemma Hemmings.IntroductionThis investigation aimed to determine the localisation of the Grb-2 and PLC-γ in lymphnodes from cancer tissue using immunohistochemistry, in combination withimmunofluorescence, to perform confocal microscopy and direct stochastic opticalreconstruction microscopy (dSTORM).Colorectal cancer associated lymph nodes were used to understand the Grb2 andPLC-γ expression. There are a number of different cell types within lymph nodes asdepicted in Figure 2. Determining the distribution of Grb2 and PLC-γ expression withinlymph nodes could provide greater insight into proline-rich motif-SH3 domain drivensignalling within these tissues.
Figure 2. Taken from Young, 2006. The anatomy of a lymph node stained with H & E. Key: C – capsule;Cx – cortex; F – follicle (with germinal centre); H – hilum; M – medulla; MC – medullary cords; P –paracortex; S – subscapular sinus; T – trabecula. The cortex of the lymph node contains the B cellfollicles, while T cells are found within the paracortex (Colbeck, Ager, Gallimore and Jones, 2017).MethodsThe tissue used in this experiment was colorectal, containing colorectal cancerassociated lymph nodes, and was obtained from the Leeds Teaching Hospital NHSTrust. The expression of Grb-2 and PLC-γ was determined by immunoperoxidasestaining and immunofluorescence. Table 1 details the antibodies used in eachprocedure and the respective microscopes used to analyse the samples.Staining ry Antibodies(dilution) Immunofluorescence Immunofluorescence Rabbit Anti-Grb2(1:100µl)Rabbit Anti-PLC-y(1:25µl)Rabbit Anti-Grb2(1:100µl)Rabbit Anti-PLC-y(1:50µl)Rabbit Anti-Grb2(1:100µl)Rabbit ution)Standard microscopeHorse Anti- Standard microscopeRabbit IgGPolymerreagentGoat AntiConfocal �l)Table 1. Details of the procedures used during the investigation.Oni microscope
ResultsThe results from the immunohistochemistry and immunoperoxidase staining arepresented in Figures 3-5. The immunoperoxidase staining conveys a differentiallocalisation of Grb-2 and PLC-γ the lymph nodes cells.Figure 3. Immunohistochemistry staining was used initially to select the lymph node sections, and alsodemonstrates the appearance of the lymph node cells in the absence of Grb2 and PLC-y expressionas the haematoxylin stains the nuclei of the cells purple and the eosin stains the cytoplasm of the cellspink. Fig. 3.A – shows the entire lymph node at 500 µm. Fig. 3.B – focuses on a follicle within the lymphnode, at a higher magnification of 50 µm.Figure 4. Immunoperoxidase staining of Grb2. Fig. 4.A – shows the entire lymph node at 500 µm. Fig.4.B – focuses on a follicle at a higher magnification of 50 µm. The staining pattern of Grb2, conveysexpression of this protein in the follicle germinal centre, as well as surrounding the follicle and in thecells out with the follicle.
Figure 5. Immunoperoxidase staining of PLC-γ. Fig. 5.A – shows the entire lymph node at 500 µm. Fig.5.B – focuses on a follicle at a higher magnification of 50 µm. The PLC-γ protein is shown to beexpressed in cells outside the follicle and in the germinal centre, however there is markedly limitedexpression within the outer layer of the follicle and outer cortex of the lymph node.The immunofluorescent staining was analysed using the confocal microscope and thefollowing images obtained are presented in Figures 6 and 7.Figure 6. Confocal microscopy of Grb2. Fig. 6.A – provides larger context at 100µm, from which twoareas were focused on at a magnification of 20µm in Fig.6.B and Fig. 6.C. These highlight expressionof Grb2 in the T cells of the lymph node.
Figure 7. Confocal microscopy of PLC-γ. Fig. 7.A – magnification of 100µm. Fig. 7.B – presents thefollicle area of the lymph node at a magnification of 20µm, where there is limited expression of PLC-γ.Fig. 7.C – at a magnification of 20µm, this demonstrates PLC-γ localisation within the T cells.The dSTORM images present a more detailed analysis of the Grb2 and PLC-γexpression using the Oni microscope, presented in Figures 8 and 9.Figure 8. DSTORM imaging GrB2. Fig. 8.A – Multiple images of the lymph tissue complied to form alarger image providing context for are of the lymph node expressing the two SH3 domain proteins. Fig.
8.B – at a magnification of 10µm, this image consists of the underlying dSTORM image with an overlayof a transparent image of the cell structures, showing the expression of Grb2 within the cells. Fig. 8.C– presents the dSTORM image at a magnification of 10µm, with Grb2 expression distributed in clumpsamongst the cells.Figure 9. DSTORM imaging of PLC-γ. Fig. 9.A – shows a number of smaller images stitched togetherin order to orientate figures 9.B and 9.C. Fig. 9.B – shows the dSTORM expression, at a magnificationof 10µm, with a transparent overlay of the cell outlines. Fig. 9.C – presents the dSTORM image of thePLC-γ expression of clump-like-structures distributed throughout the cells, at a magnification of 10µm.DiscussionThe two SH3 domain-containing proteins were found to be expressed within theimmune cells of human lymph node tissue; therefore, suggesting that there may beproline-rich motif-SH3 domain driven signalling. The differential immunoperoxidasestaining pattern of the conveyed that Grb2 was localised in the follicle and surroundingcells, while the PLC-γ was expressed in the germinal centre of the follicle andsurrounding cells but not in the outer layer of the follicle. The confocal imagesdemonstrate that there is in Grb2 and PLC-γ expression within the T cells and thefollicle centre cells; however, with limited expression in the cells at the edge of thefollicle. The dSTORM results demonstrated a linear expression of Grb2 and PLC-γ inclump-like formations, with greater expression of PLC-γ compared with Grb2.In conclusion, this investigation acknowledged what has been found within theliterature, that Grb2 and PLC-γ are expressed in cancer associated lymph nodes(Timsah, et al., 2014 and Timsah, et al., 2015). Furthermore, this study provided anovel insight to Grb2 and PLC-γ localisation using dSTORM.
ReflectionThis project enabled me to assist with the entire tissue preparation procedures fromtissue fixation to immunohistochemical and immunofluorescence staining with labtechnician Mike Shires. In addition, I had the opportunity to observe confocal and Onimicroscopy with lab technicians Haley Slaney and Aurora Bono. Participating in thisproject at Leeds, had the added benefit of providing me with an insight into one of thefirst digital pathology platforms, and I was shown the digitalisation process by MikeHale. I thoroughly enjoyed working with the team at the Welcome Trust Lab and theexperience has provoked a desire to participate in future research.Figure 10. – Hayley Slaney working at the Oni microscope (left) and myself learning how to use theOni microscope (right).ReferencesColbeck, E., Ager, A., Gallimore, A. and Jones, G., 2017. Tertiary LymphoidStructures in Cancer: Drivers of Antitumor Immunity, Immunosuppression, orBystander Sentinels in Disease? Frontiers in Immunology, 8.Timsah, Z., Ahmed, Z., Lin, C., Melo, F., Stagg, L., Leonard, P., Jeyabal, P., Berrout,J., O'Neil, R., Bogdanov, M. and Ladbury, J., 2014. Competition between Grb2 andPlcγ1 for FGFR2 regulates basal phospholipase activity and invasion. NatureStructural & Molecular Biology, 21(2), pp.180-188.Timsah Z, Berrout J, Suraokar M, Behrens C, Song J, Lee JJ, Ivan C, Gagea M,Shires M, Hu X, Vallien C, Kingsley CV, Wistuba I, Ladbury JE., 2015. Expressionpattern of FGFR2, Grb2 and Plcγ1 acts as a novel prognostic marker of recurrencerecurrence-free survival in lung adenocarcinoma. Am J Cancer Res. 15;5(10):313548.Young, B., 2006. Wheater's functional histology. 5th ed. Edinburgh: ChurchillLivingstone/Elsevier, pp.218-219.
associated lymph nodes, and was obtained from the Leeds Teaching Hospital NHS Trust. The expression of Grb-2 and PLC-γ was determined by immunoperoxidase staining and immunofluorescence. Table 1 details the antibodies used in each procedure and the respective microscopes used to analyse the samples. Staining Technique Primary Antibodies (dilution)