Transcription
1User Manual 2020ContentsTheory: Economic Age-Life Depreciation and Marginal Cost . 2Navigation: How to get from one calculator to the next and view Survey results . 4Solomon Adjustment: Calculate depreciated cost adjustments from your estimate of Remaining Economic Life . 5Solomon Cost: Calculate depreciation in the Cost Approach and develop depreciated cost adjustments . 7Solomon Cost New: Develop replacement cost adjustments when there is no physical depreciation . 14Solomon Site: Extract site value from a sale with similar site characteristics . 16Solomon Manufactured: Develop adjustments from your estimate of Remaining Economic Life . 18Solomon Market Time: Develop and document time adjustments. 20Reporting: Describe the way you developed adjustments with the depreciated cost and survey methods . 23Appendix A Glossary. 25Appendix B Single Family Quality Ratings . 26Appendix CManufactured Housing Quality Ratings . 28
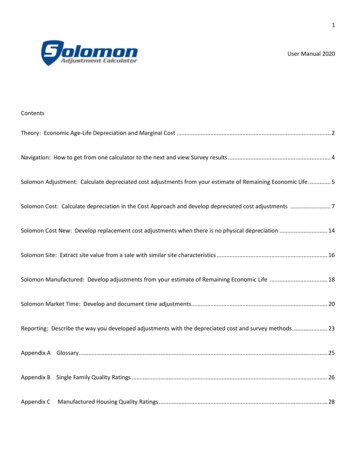
2TheorySolomon is a suite of calculators designed to simplify depreciated cost analysis of single family houses.Cost data is included in your subscription. Cost data is licensed from Craftsman Book Company “National Building Cost2020”.Depreciated cost analysis is compliant because USPAP requires appraisers to use recognized methods and depreciatedcost is a recognized method.1The underlying concept is that real estate appraisers are engaged to develop an opinion of value that includes the site,“as-is” value of site improvements and the contributory value of the house. A key part of the analysis is the salescomparison grid, in which the appraiser applies adjustments to comparable sales. These adjustments reflect thecontributory value that the market places on features of the house.Here is an example:When a buyer and seller agree on a price of 225,000, an appraiser who knows land values may think of this as thebuyer paying 50,000 for the site and 175,000 for the building. (Assume 50,000 includes “As-is value of SiteImprovements. The 175,000 amount is called the Contributory Value of the Improvements. An appraiser who goes thenext step and applies unbiased 3rd party cost data to the building characteristics may find that the current replacementcost of the building is 250,000.This means that depreciation is 75,000. MarketReaction is 70% of replacement cost. ( 175,000 / 250,000).The assumptions of Economic Age-Life Depreciation(assumed in the 1004) are:1. Effective Age / Economic Life is the percentage ofdepreciation.2. Economic Life – Effective Age is RemainingEconomic Life.3. Remaining Economic Life / Economic Life is the percentage of current replacement cost paid by the market.Solomon will help you support assignment results like effective age and remaining economic life. Beyond that, Solomonwill simplify your analysis of these assignment results and their relationship to sales grid adjustments.Economic Age-Life Depreciation is the first of two key concepts you need to understand to properly apply depreciatedcost analysis.When remaining economic life is extracted from the market, we have a basis for developing market based adjustments ifwe handle published cost data correctly.GLA cost data is published as average cost. We need to compare total cost of GLA, just like we compare sale prices oftwo comps we are using for a paired sale adjustment.1The Appraisal of Real Estate 14th Edition p398
3In this example, assume we need to support a GLA adjustment for a 1400sf house. We have located two sales in MLSthat are identical except for GLA. Comp 1 has 1500sf and Comp 2 has 1300sf.Comp 1Comp 2Market Value 231,000 218,400 12,600GLA15001300200Adjustment 63The adjustment is developed by dividing the change in market value by the change in GLA.If you are not able to find a current pair in MLS, there is another source of data that will provide the answer. This sourceis your cost manual.If the average cost of 1500sf of GLA is 120/sf, andthe average cost of 1300sf of GLA is 124.60/sf, weknow that a change in GLA of 200sf results in achange in cost of 18,000.Comp 1Comp 2GLA Size Avg Cost1500 120.001300 124.60200Total Cost 180,000 161,980 18,020Marginal Cost 90.10The adjustment is developed by dividing the change in total cost by the change in GLA.Marginal cost is the second of two key concepts you need to understand to properly apply depreciated cost analysis.Marginal cost is the cost of one more square foot. GLA grid adjustments are market value of one more square foot.The first key concept is Economic Age-Life Depreciation. When we combine the concept of Marginal Cost with theconcept of Economic Age-Life Depreciation, we have a sound basis for sales grid adjustments.In our example, if depreciation is 30%, and the market is paying 70% of cost, a market based adjustment is 63.Marginal Cost of 90.10 x 70% market reaction 63Solomon automates the process for you.Solomon Adjustment uses the appraiser’s estimate of remaining economic life to calculate depreciated costadjustments for GLA and nine other cost categories.Solomon Cost extracts depreciation from the appraiser’s estimate of market value and building characteristics tocalculate depreciated cost adjustments for GLA and eleven other cost categories.Solomon Cost New is designed for new construction when there is no depreciation. Replacement cost is calculated forGLA and eleven other cost categories.Solomon Site extracts site value from a comp sale price, building characteristics and the appraiser’s estimate of effectiveage.Solomon Manufactured calculates GLA and six other cost categories for manufactured housing.Solomon Market Time is designed to calculate time adjustments from the appraiser’s known rate of appreciation.Survey Results can be used as a basis for adjustments that do not have a cost component such as bedroom count andadverse location.
4NavigationSolomon includes six separateapplications. One is a market timecalculator that does not involve costdata. The other five fully exploit thepossibilities of depreciated cost logic.You will be able to develop andsupport adjustments for hybridassignments when the scope of workinfers remaining economic life.You will be able to support effectiveage, remaining economic life andmarket-based adjustments for the1004 sales grid.You will be able to developadjustments for new constructionwhere there is no depreciation.You will be able to extract site valuefrom a sold comparable with sitecharacteristics that are similar to thesubject property.You will be able to support marketbased adjustments for manufactured housing.Click the ‘hamburger’ to open or close the menu selections.Click 'Survey Results' to view adjustments developed from peer consensus surveys. Surveys are a form of secondarydata."A third form of data analysis, secondary data analysis, is used to support adjustments derived by other methods. Thistechnique makes use of data that does not directly pertain to the subject or comparable properties. This secondary datadescribes the general real estate market and is usually collected by a data vendor research firm or government agency.Secondary data may need verification." -The Appraisal of Real Estate – 14th p400
5Solomon AdjustmentSolomon Adjustment calculatesdepreciated cost adjustments fromthe appraiser’s estimate ofremaining economic life.1. Enter ‘base’ if you do not wantto use the published zip codemultiplier. Otherwise, entersubject zip code.2. Select subject quality rating.Q1 is highest and Q6 is lowest as inthe UAD system. See Appendix formore on quality ratingassumptions.3. Click the box for a quality ratingbetween two ratings. If you select2 and check the box, the calculatoruses cost between Q3 and Q4.4. Enter remaining economic lifeestimate. If you are doing adesktop on a 20 year old Q4 that israted average by the inspector, aremaining economic life of 40 isinferred by the scope of work andcost data. The cost data is built onthe assumption of 60 yeareconomic life for a Q4.5. Enter a factor if you want to fine tune cost per guidance from the cost data publisher. In the example, 4 is usedbecause the subject is a Q4 with masonry construction, built outside a metropolitan area.“Note: Tract work and highly repetitive jobs may reduce the cost 8 to 12%. Add 4% to the square foot cost of floorsabove the second floor level. Work outside metropolitan areas may cost 2 to 6% less. When the exterior walls aremasonry, add 9 to 10% for class 2 and 1 structures and 5 to 8% for class 3, 4, 5 and 6 structures.”In the example, masonry construction increases cost 5% to 8% and outside metro reduces cost 2 to 6%. A Q4 should be 7% for masonry and -3% (judgement call) outside metro. Net result is 4%.6. Click calculate and values are shown at right.7. Click Print Report to generate a dated report than can be printed or saved as a pdf.
6
7Solomon Cost1. Enter an estimate ofmarket value. Thisnumber can be changelater in the process.Think of it as ahypothesis to be testedin the sales grid. If youare better able toestimate effective age,use SolomonAdjustment.2. Enter site value.3. Enter “As-is” value ofsite improvements.4. Enter zip code. Thecost data publisher listslocal cost multipliers formost zip codes. Themultiplier includes locallabor, material andclimate conditions thatimpact cost. The zipcode multiplier can bebypassed by enteringbase for base cost.6. Enter GLA square feet.6. Select quality rating. The licensed data includes 11 ratings which we include as 1, 1.5, 2, 2.5, 3 etc. One is highestand 6 is lowest.7. Select Yes or No for central air. If No is selected, complete the two fields below to indicate the square footage ofheated space and cooled space.8. Enter basement square feet.9. Enter basement finish square feet. In this example, there are 100 square feet in the basement, with 600 square feetof finished space.10. Enter basement bath count. GLA cost data includes bathrooms. Basement finish does not, so it is added separately.11. Same as above.12. Enter fireplace count including all fireplaces, above and below grade.13. Enter total square footage of all decks. Decks have a post foundation.
814. Enter total square footage of all covered porches. Covered porches have roof systems similar to the house.15. Enter total square footage of all screen porches. Screen porches have roof systems equal to the house and areenclosed with screen.16. Enter total square footage of all enclosed porches. Enclosed porches have roof systems equal to the house and areenclosed with windows.17. Enter total square footage of garage, regardless of how many garage doors. Do not include accessory buildings suchas a pole barn. A garage is oriented toward residential car storage. A pole barn with garage doors is an accessorybuilding and classified as a site improvement.18. Enter total square footage of all carports.19. The Factor field is used to account for cost difference beyond the zip code multiplier. In this example, a Factor ofminus 10 is used to account for the savings of multiple builds in a subdivision.“Note: Tract work and highly repetitive jobs may reduce the cost 8 to 12%. Add 4% to the square foot cost of floorsabove the second floor level. Work outside metropolitan areas may cost 2 to 6% less. When the exterior walls aremasonry, add 9 to 10% for class 2 and 1 structures and 5 to 8% for class 3, 4, 5 and 6 structures.”
920. This is a new feature suggested by a Solomon user who needs to include the cost additional features. Indoor pools,indoor sport courts, wet bars, even local environmental impact studies could be entered in this section. The exampleshows the words Wet Bar entered by the appraiser together with the local cost. The cost is added top right withoutbeing impacted by the Factor field value or the Zip Code multiplier. The depreciated cost of the additional feature alsoappears at the bottom the Default Adjustment column.21. Click Calculate and the Cost Approach appears top right.22. The square foot values are meant to be entered into the 1004 Cost Approach section.23. Depreciation is calculated by subtracting Depreciated Cost (24) from Total Estimate of Cost New.24. Depreciated Cost of Improvements is calculated by subtracting Site and “As-is” Value of Site Improvements from theMarket Value Estimate.25. Economic Life is assumed from licensed cost data. Q1-Q3 70 years. Q4-Q5 60 years. Q6 55 years.
1026. Effective Age is calculated by applying the ratio of (Depreciation / Total Estimate of Cost New) to Economic Life.(87,169 / 278,169) x 60 19 years27. Remaining Economic Life is calculated by applying the ratio of (Depreciated Cost / Total Estimate of Cost New) toEconomic Life.(191,000 / 278,169) x 60 41 years.28. Depreciation Percentage is calculated by dividing Effective Age by Economic Life.19 x 60 32%
1129. Default Adjustments are calculated by applying the ratio of (Remaining Economic Life / Economic Life) to marginalcost extracted from licensed cost data.41 / 60 68%68% of 94 marginal cost of GLA 64.Marginal cost of GLA and other cost categories are derived within the calculator by dividing change in cost by change inquantity as shown on page 3.
1229. The Default Adjustment column shows the effect of equal depreciation throughout the building. In this example ofa Q4 quality rating, the building as a whole is assumed to have an economic life of 60 years. The economic life of 60years is assumed by the cost engineers who compile the cost data that is licensed for use in the calculators.30. The % of Econ Life column is used to account for some cost categories depreciating faster than others. If you enter33 in the Deck category, you are saying the deck has 33% of 60 year lifespan. 33% of 60 is 20 years. 20 years is theestimate published in a study sponsored by National Association of Home Builders and Bank of America Home Equity.You can download this study by clicking “Lifespan of Components” at www.solomonappraissal.com/greatlinksThe economic life of a deck is low because it is exposed to the elements. A covered porch has less exposure than a deck.A screen porch has less exposure than a covered porch. An enclosed porch has less exposure than a screen porch. I use33%, 50%, 67% and 75% respectively.In my market, a second fireplace has less value than a first fireplace. In this example, 2200 is inferred for the firstfireplace and 1100 for additional fireplaces.I use 50 for the bath categories to get adjustments for basement baths. In my market, basement baths have roughly50% of the GLA baths due to the functional issue of being below grade. In this example, I have an adjustment for anabove grade bath at 7000 and a below grade bath adjustment of 3500.The GLA category is the most complex. The lifespan study cited above states that several subcategories of GLA haveshort lifespans.DishwashersKitchen CabinetsCountertopsDecksExterior DoorsFinish Lighting9 years50 years20 yr to Life20 years20 – 40 yrs10 yearsFinish PlumbingCarpetLinoleumVinyl FloorsHVACFurnaces15-50 years8-10 years25 yearsUp to 50 years15-25 years15-20 yearsHeat PumpsAir Conditioning UnitsAsphalt RoofingAluminum GuttersAluminum WindowsWooden Windows16 years10-15 years20 years20 years15-20 years30 years
13I use a calibration percentage of 62. This is based on a survey of Solomon users who observed that the default GLAadjustment was too high. Rather than try to combine all of the short lifespan subcategories into an overall percentage, Iuse those survey results to provide a range. In this example, the range is 39 to 64. If 64 provides a tighter range ofadjusted sold values, the grid is inferring that 64 is the better choice by sensitivity analysis.31. After completing the % of Econ Life columns, click Calibrate Adjustments.32. The calculator multiplies the Default Adjustment values by the % of Econ Life percentage to result in adjustmentsthat are shaped by the appraiser’s observations and judgments of how depreciation is impacting a particular set ofsubject and comps.33. Click Print Report for a hard copy or pdf of the calculator results.Guidance for 1004 reporting in Summary of Sales Comparison Approach.“Adjustments for building characteristics are developed with the depreciated cost method. See page three AdjustmentCalculations and the Depreciated Cost Adjustments summary attached.”Page 3 Additional Comments.Adjustment Calculations: Adjustments for building cost categories such as GLA, bath count, basement size, basementfinish sf, garage count and fireplace count are based on the amount they contribute to value. By definition, depreciatedreplacement cost is the amount that the building contributes to site value. Depreciation is x%, so the market is payingy% of replacement cost for the buildings. See Depreciation Calculation attached which includes the y% factor applied torelevant cost categories.I include a screenshot of Solomon Cost calculations by inserting a page titled “Depreciated Replacement CostAdjustment Calculations”.
14Solomon Cost NewSolomon Cost New is designed for newconstruction assignments where there is nodepreciation.1. Enter site value, site improvements andbuilding characteristics.2. Enter Builder Sale Price.3. Click Calculate to get results.4. In this case, the Builder Sale Price is 92%of published cost data.We license cost data from National BuildingCost 2020. Following are their commentsabout the accuracy and intended use of thedata:“Costs in the tables include all constructioncosts: labor, material, equipment, plans,building permit, supervision, overhead andprofit.”“This manual will be a useful reference foranyone who has to develop budget estimatesor replacement costs for buildings. Anyonefamiliar with construction estimatingunderstands that even very competentestimators with complete working drawings,full specifications and precise labor andmaterial costs can disagree on the cost of abuilding. Frequently exhaustive estimates foreven relatively simple structures can vary10% or more. The range of competitive bidson some building projects is as much as 20%.Estimating costs is not an exact science andthere’s room for legitimate disagreement onwhat the “right” cost is. This manual can nothelp you do in a few minutes what skilledestimators may not be able to do in manyhours. This manual will help you determine areasonable replacement or construction costfor most buildings. It is not intended as a substitute for judgment or as a replacement for sound professional practice,but should prove a valuable aid to developing an informed opinion of value.”Builders do not use cost data to establish selling prices. The market sets the selling price.
15Neither the Builder or the market use published cost data. Actually it is the other way around. Cost data is compiledfrom survey data of builders, permit data of completed projects and other sources.The calculator will show 1004 Cost Approach data two ways. Top center you will see cost approach data straight fromthe National Building Cost Manual. On the right, you will see the National Building Cost Manual Data reconciled to thelocal builder cost.The Local Builder Cost data is used to calculate replacement cost adjustments bottom center.1. In this example, the builder completed the project at 92% of the amount estimated by the National Building CostManual. Builders do not use cost manuals to price their houses. Cost services use builder prices to compile costmanuals. An individual project will never match a published source.2. These are the numbers I report in the 1004 Cost section.3. These numbers show the effect of reconciling National Building Cost numbers with actual project cost. This isaccomplished by changing the Dwelling category to result in zero depreciation. Dwelling is used because it is the largestcategory and best place to reflect factors such as site difficulty and other factors that impact cost and market conditions.4. Replacement Cost Adjustments are calculated from the actual project cost (3) in order to reflect the market, not thepublished cost data.
16Solomon SiteSolomon Site is a market extraction tool. The idea is to choose a comparable sale with similar site characteristics andsubtract the depreciated cost of the improvements. You will be left with the total of Site Value and “As-is” Value of SiteImprovements. Subtract site improvements and you have site value.Depreciated cost of the improvements is replacement cost after depreciation has been deducted. Depreciation iscalculated from the appraiser’s estimate of effective age.1. Enter the property characteristics of the comparable sale on the left.2. Enter you estimate of effective age.3. Enter your estimate of the “As-is” Value of Site Improvements.4. Click Calculate5. The assumption will resolve to the site value.6. Click Print Report for a hard copy or pdf.
17See the following example of the very sensitive trade-off between depreciation (effective age) and site value.The only change from the prior example is using 20 years effective age in the place of 15 years.A change from 15 to 20 (1) results in a change in site value from 50,000 to 72,000.Why? In this case, depreciation of 25% (15/60) is 22,000 lower than depreciation of 33% (20/60).
18Solomon ManufacturedSolomon Manufactured uses the appraiser’s estimate of remaining economic life to calculate seven adjustments.1. Enter subject zip code.2. Select Quality rating. See Appendix C for illustrations of five quality categories.3. Enter remaining economic life. Note that economic life values are lower than traditional construction.4. Enter deck size.5. Enter Porch size.6. Enter Carport size.7. Enter garage size in square feet, not the number of car stalls.
198. Click calculate.9. The GLA adjustment is a square foot adjustment. In this case, marginal cost of GLA is 68 and the zip code multiplieris 12%.Marginal Cost x (Remaining Economic life/Economic Life) x 1.1268 x (20/40) x 1.12 3810. All other adjustments are unit adjustments. A 160sf deck is 2000. A 240sf garage is 7200 etc.
20Solomon Market TimeSolomon Market Time quickly applies an annual rate of change to the interval in days between the contract date of thecomparable and the effective date of the report. Up to four comparables can be calculated on the same page.1. Enter the street address of the comparable properties for which you will calculate a market time adjustment. This isan optional field to enhance your reporting.2. Enter the sale price of the comparable properties for which you need a market time adjustment.3. Enter the amount of seller concessions if the concessions result in a sale price that is higher than market value.
214. Click on the calendar icon and select the date that thecomparable property came under contract.5. Click on the calendar icon and select the effective dateof the report.
226. Enter the annual percentage of change in the market. Ifthe market has declined, use a negative number. If themarket is down 5%, enter -5. If the market is up 2.3%, enter2.3. A sample size of at least 30 sales is required forstatistical significance and credibility of the market timeadjustment.7. Click calculate. Three calculations aremade that result in a credible market timeadjustment.8. Concessions are subtracted from SalePrice to show Comparable Market Value9. Comparable Contract date is subtractedfrom Appraisal Effective Date to show theInterval in Days between the two dates.10. Market Time Adjustment is calculatedby applying the annual rate of change tothe interval in days. If the annual rate is2.3%, and the interval is 199 days, theresult is 2758 for a market value of 220,000.
23ReportingI report the findings of the calculators on three pages of a 1004 report.1. I insert a page in the report titled Depreciated Cost Adjustment Calculations with a screen capture of Solomon Cost.2. I add commentary at the bottom of page 3 of the 1004 with this statement:Adjustment Calculations: Adjustments for building cost categories such as GLA, bath count, basement size, basementfinish sf, garage count and fireplace count are based on the amount they contribute to value. By definition, depreciatedreplacement cost is the amount that the building contributes to site value. Depreciation is x%, so the market is payingy% of replacement cost for the buildings. See Depreciated Cost Adjustments summary attached which includes the y%factor applied to relevant cost categories.3. On page 3 in the Summary of Sales Comparison Approach, I use comments like these:“The Date of Sale / Time adjustments are developed by applying the x.x% appreciation rate to the interval betweencomp contract date and report effective date. Adjustments for building characteristics are developed with thedepreciated cost method. See page three Adjustment Calculations and the Depreciated Cost Adjustments summaryattached.”4. In the Support for the opinion of site value section I begin with this and edit as necessary. If there are comparable sitesales, I summarize those and add attachments as necessary.“There are no recent lot sales in this fully developed neighborhood. The allocation method applied at the 2019 assessorLTV ratio of xx% to the median price of xxx,000 infers xx. Assessor estimate is xx. The extraction method applied toComp x indicates xx. Most weight is given the extraction method because it begins with a similar lot with similarimprovements.5. Comments on Cost Approach shouldinclude National Building Cost Manual 2020 asthe source of cost data. Don't report SolomonCost as your source of cost data. SolomonCost is a calculator that uses data fromNational Building Cost Manual 2020.6. Enter the Quality rating from cost service. Ifthe subject is Q3.5, report Q3 or Q4. Q3.5 is ahigh Q4 or a low Q3.
247. Enter the Effective Date of the cost data.8. In Comments on Cost Approach, I use this:Quality Class 4 Good Standard is used (p 7,12, 27 - 30). "As-is" value of SiteImprovements includes depreciation tothose features. The Age-Life method ofdepreciation assumed in this report includesall elements of depreciation to theImprovements in one calculation shown inthe Physical category. Economic Life Effective Age Remaining Economic Life.The page numbers 7, 12, 27-30 apply to all quality ratings.
25Appendix AGlossaryAge-Life Method: a method of estimating depreciation in which the ratio between the effective age of a building and itstotal economic life is applied to the current cost of the improvements to obtain a lump sum deduction; also known atthe economic age-life method – The Dictionary of Real Estate Appraisal 4th Ed p 8Depreciation: a loss in property value from any cause; the difference between the cost of an improvement on theeffective date of the appraisal and the market value of an improvement on the same date – The Dictionary of Real EstateAppraisal 4th Ed p 79-80Economic Age-Life Method: see Age-Life Method – The Dictionary of Real Estate Appraisal 4th Ed p 91. Economic Life:the period over which improvements to real property contribute to property value. – The Dictionary of Real EstateAppraisal – 4th Ed p 92Effective Age: The age of a property that is based on the amount of observed deterioration and obsolescence it hassustained, which may be different from chronological age. - The Dictionary of Real Estate Appraisal 4th Ed p 93Iteration: a problem-solving or computational method in which a succession of approximations, each building on theone preceding, is used to achieve a desired degree of accuracy – Dictionary.comRemaining Economic Life: the estimated period over which existing improvements are expected to continue tocontribute economically to property value – The Appraisal of Real Estate 13th Ed p 415Marginal Cost: the cost of one additional unit of any item produced or bought in quantity - "marginal cost".Dictionary.com Unabridged. Random House, Inc. 17 Apr 2017.
26Appendix BSingle Family Quality ClassificationAssumptions
27
28Appendix CManufactured Housing Quality ClassificationsSee next page for descriptions.
29
Solomon Site extracts site value from a comp sale price, building characteristics and the appraisers estimate of effective age. Solomon Manufactured calculates GLA and six other cost categories for manufactured housing. Solomon Market Time is designed to calculate time adjustments from the appraisers known rate of appreciation.