Transcription
C O M P R E H E N S I V EH O U S I N GM A R K E TA N A L Y S I SMidland-Odessa, TexasU.S. Department of Housing and Urban DevelopmentOffice of Policy Development and ResearchAs of April 1, 2018SummaryHousing Market torMidlandGlasscockWardCraneUptonReaganThe Midland-Odessa Housing MarketArea (HMA), which encompassesboth the Midland, TX and Odessa, TXMetropolitan Statistical Areas (MSAs),consists of Ector, Martin, and MidlandCounties. The HMA is approximately50 miles from the southeastern cornerof New Mexico and serves as a hubfor the extraction of oil and naturalgas in the Permian Basin, which is thesecond largest oil field in the world andaccounts for more than 20 percent ofthe crude oil production in the nation.Market DetailsEconomic Conditions. 2Population and Households. 5Housing Market Trends. 7Data Profile. 11EconomyNonfarm payrolls in the MidlandOdessa HMA increased at a rapidrate during the past 12 months afterdeclines in 2015 and 2016, whichresulted from sharply declining oilprices. During the 12 months endingMarch 2018, nonfarm payrolls totaled170,000 jobs, an increase of 12,700jobs, or 8.1 percent, from the previous12 months. The mining, logging, andconstruction sector led job growth,increasing by 7,700 jobs, or 19.9 percent,when the West Texas Intermediate(WTI) crude oil price rose from about 50 to 62 a barrel. During the 3-yearforecast period, nonfarm payrolls areexpected to increase an average of 4.0percent annually. Table DP-1 at the endof this report provides employmentdata for the HMA.Sales MarketThe sales housing market in the HMAis slightly tight, with an estimated1.1-percent vacancy rate, down from1.5 percent in April 2010. During the12 months ending February 2018,new and existing home sales increased18 percent to 7,325 homes sold(Core Logic, Inc., with adjustments bythe analyst). Demand is expected for4,575 new homes during the forecastperiod (Table 1). The 600 homescurrently under construction willsatisfy some of the forecast demand.Rental MarketThe rental housing market is slightlytight in the HMA. The overall rentalvacancy rate is currently estimated at4.7 percent, down from 9.3 percent inApril 2010. The apartment market isalso slightly tight, with a vacancy rateof 4.1 percent during March 2018,down from 8.6 percent a year earlier(ALN Systems, Inc.). During theforecast period, demand is expectedfor 2,850 new market-rate rental units.The 380 units currently under construction will satisfy a portion of thedemand (Table 1).Table 1. Housing Demand in theMidland-Odessa HMADuring the Forecast PeriodMidland-OdessaHMATotal demandUnder otes: Total demand represents estimatedproduction necessary to achieve a balancedmarket at the end of the forecast period.Units under construction as of April 1, 2018.Sales demand includes an estimated demandfor 200 mobile homes. The forecast periodis April 1, 2018, to April 1, 2021.Source: Estimates by analyst
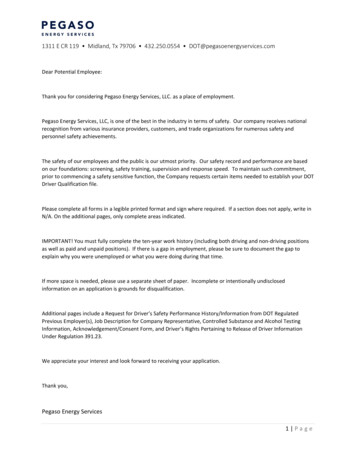
Economic Conditions2he number of jobs in the Midland-Odessa HMAincreased during the past 12 months,following 2 years of nonfarm payrolldeclines in 2015 and 2016. Duringthe 12 months ending March 2018,nonfarm payrolls averaged 170,000jobs, an increase of 12,700 jobs, or8.1 percent, from a year ago. Theincrease follows an average 6.0135,000018.0155,00000175,000Unemployment rateFigure 1. T rends in Labor Force, Resident Employment, and Unemployment Rate in the Midland-Odessa HMA, 2000 Through 2017Labor force andresident employmentM i d l a n d - O d e s s a , T X C O M P R E H E N S I V E H O U S I N G M A R K E T A N A LY S I STLabor forceResident employmentUnemployment rateSource: U.S. Bureau of Labor StatisticsFigure 2. Current Nonfarm Payroll Jobs in the Midland-Odessa HMA,by SectorGovernment 12.0%Other services 4.2%Mining, logging, & construction 27.2%Leisure & hospitality 10.6%Manufacturing 4.4%Education & health services 7.8%Professional & business services 7.9%Financial activities 4.2%Information 0.9%Wholesale & retail trade 16.7%Transportation & utilities 4.1%Note: Based on 12-month averages through March 2018.Source: U.S. Bureau of Labor StatisticsTable 2. Major Employers in the Midland-Odessa HMAName of EmployerPioneer Natural Resources CompanySaulsbury IndustriesMedical Center Health SystemKeane Group, Inc.Midland Memorial HospitalHalliburton Energy Services, Inc.Endeavor Energy Resources, LPDawson Geophysical, Inc.Concho Resources Inc.Odessa Regional Medical CenterNonfarm Payroll SectorNumber ofEmployeesMining, logging, & constructionMining, logging, & constructionEducation & health servicesMining, logging, & constructionEducation & health servicesMining, logging, & constructionMining, logging, & constructionProfessional & business servicesMining, logging, & constructionEducation & health 072953Note: Excludes local school districts.Sources: Midland Economic Development; Odessa Economic Developmentdecline of 8,200 jobs, or 4.8 percent,during 2015 and 2016. During the12 months ending March 2018,the unemployment rate averaged3.1 percent, down from 5.2 percentduring the previous 12 months. Bycomparison, from 2011 through 2015,the unemployment rate averaged 4.1percent (Figure 1).The economy of the HMA has beenclosely linked to the oil and gas indus try since the discovery of oil in thePermian Basin during the 1920s. Thewidespread adoption of hydraulicfracturing drilling technology (fracking) in the 2000s reestablished thePermian Basin as one of the world’sleading oil and gas production areas.The mining, logging, and constructionsector is the largest sector in the HMA,and the Midland, TX and Odessa, TXMSAs have the two highest concentrations of nonfarm payrolls in the mining, logging, and construction sectorof all MSAs in the United States, 29.7and 23.4 percent, respectively (Bureauof Labor Statistics). During the 12months ending March 2018, the sector accounted for 46,300 jobs, or 27.2percent, of all nonfarm payrolls in theMidland-Odessa HMA (Figure 2). Bycomparison, the mining, logging, andconstruction sector accounted for only5.2 percent of nonfarm payrolls in thenation during the period. The sectorincludes six of the nine largest employers in the HMA, such as PioneerNatural Resources Company, Saulsbury Industries, Keane Group, Inc.,and Halliburton Energy Services,Inc. (Table 2). From 2000 throughthe current date, the mining, logging,and construction sector has expandedat the fastest rate of any sector in theHMA, recording a cumulative gainof 170 percent (Figure 3). Varying oilprices caused several booms and busts
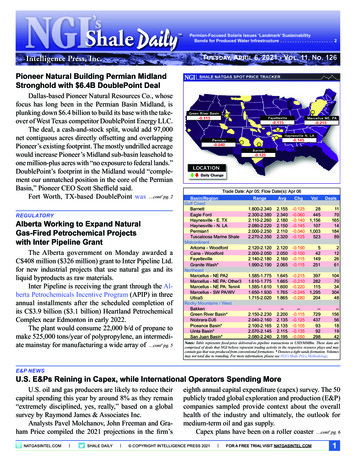
3Economic Conditions ContinuedFigure 3. Sector Growth in the Midland-Odessa HMA, Percentage Change, 2000 to CurrentTotal nonfarm payroll jobsGoods-producing sectorsMining, logging, & constructionManufacturingService-providing sectorsM i d l a n d - O d e s s a , T X C O M P R E H E N S I V E H O U S I N G M A R K E T A N A LY S I SWholesale & retail tradeTransportation & utilitiesInformationFinancial activitiesProfessional & business servicesEducation & health servicesLeisure & hospitalityOther servicesGovernment– 40– 20020406080100120140160180Note: Current is based on 12-month averages through March 2018.Source: U.S. Bureau of Labor Statisticsin both the sector and the overalleconomy of the HMA during theperiod, however.Economic conditions in the HMAare highly associated with the tradingprice of WTI crude oil being aboveor below, respectively, the averagecost of oil extraction in the Permian Basin. As the WTI crude oil pricemoves higher, it induces oil and gasTable 3. 12-Month Average Nonfarm Payroll Jobs in the MidlandOdessa HMA, by Sector12 Months EndingTotal nonfarm payroll jobsGoods-producing sectorsMining, logging, & constructionManufacturingService-providing sectorsWholesale & retail tradeTransportation & utilitiesInformationFinancial activitiesProfessional & business servicesEducation & health servicesLeisure & hospitalityOther ,0005001004001,1003001,200400– 2008.118.019.98.64.03.67.76.75.98.92.37.16.0– 1.0Notes: Numbers may not add to totals because of rounding. Based on 12-monthaverages through March 2017 and March 2018.Source: U.S. Bureau of Labor Statisticscompanies to increasingly engage inthe highly labor-intensive activities ofnew well development and capacityexpansion of existing wells as theyseek to sell more oil at the higherprices. When WTI prices fall enough,these capacity expansion activities areabruptly halted. WTI oil price swingsthus cause rapid employment fluctua tions in the HMA. As of April 1,2018, the price for WTI crude oil was 62.01 per barrel, up from the priceof 50.35 per barrel in April 2017 and 26.21 per barrel in February 2016(Federal Reserve Bank of St. Louis).The increase in price contributed tojob growth in the HMA during thecur rent 12-month period. During the12 months ending March 2018, themining, logging, and construction sector added 7,700 jobs, or 19.9 percent(Table 3), and accounted for 61 percentof net nonfarm payroll growth in theHMA, which followed a decline of2,600 jobs, or 6.3 percent during the12 months ending March 2017. Bycomparison, in 2014, the WTI crudeoil price declined 45 percent to 52.72
M i d l a n d - O d e s s a , T X C O M P R E H E N S I V E H O U S I N G M A R K E T A N A LY S I S4Economic Conditions Continuedper barrel and remained at or belowthe average cost of extraction in thePermian Basin through 2016, and themining, logging, and constructionsector lost an average of 4,700 jobs,or 10.4 percent, annually during 2015and 2016. Job losses in the sector accounted for 57 percent of the averagedecline of 8,200 jobs, or 4.8 percentof total nonfarm payrolls during theperiod. After falling below 34 a barrelin 2008, the price of WTI crude oilconsistently traded above 100 a barrelfrom 2011 through 2014, reaching apeak of 107 per barrel in June 2014.From 2010 through 2014, the mining,logging, and construction sector addedan average of 4,400 jobs, or 13.0percent, annually, which accountedfor 49 percent of the average of 8,900jobs added in the HMA each year.During the 2000s, nonfarm payrollsin the HMA peaked at an averageof 136,500 jobs in 2008. Oil and gasdrilling rig counts nearly doubledfrom 2004 through 2008 in responseto rising crude oil prices, which peakedin July 2008 at 145 a barrel. Duringthe same period, nonfarm payrollsincreased by an average 5,600 jobs,or 4.7 percent, annually, led by gainsof 2,600 jobs, or 11.6 percent, in themining, logging, and constructionsector. By comparison, from 2001through 2003, nonfarm payrollsin creased by 1,000 jobs, or 0.9 percentannually, a period of limited oil andgas activity. The rapid decline in WTIoil prices during 2008, from 145 abarrel in July 2008 to below 34 abarrel in December 2008, resulted ina decline of 7,500 jobs, or 5.5 percent,in 2009. The mining, logging, andconstruction sector, which lost 4,300jobs, or 14.2 percent, led declines.Several factors influence the WTIcrude oil price, including worldwidedemand, peculiarities of particular oilor gas fields, geographical location,and the efficiency of the company’stechnology. Oil production in thePermian Basin has generally becomemore profitable as advances inextrac tion techniques and existinginfrastructure have lowered the costof extraction, however. Currently,the average breakeven price for WTIin the HMA is down to 46 a barrel,with some companies reportingbreakeven at new wells near 20a barrel (Federal Reserve Bank ofDallas). Coupled with the absenceof the crude oil export ban, whichthe Energy Policy and ConservationAct of 1975 created in response to oilshortages in the 1970s and lifted in2015, the Permian Basin is likely tomaintain or increase production levelsduring the 3-year forecast period.The leisure and hospitality, the pro fessional and business services, andthe wholesale and retail trade sectorsalso benefit significantly from theoil and gas industry. The sectorsexpanded by 1,200, 1,100, and 1,000jobs, or 7.1, 8.9, and 3.6 percentrespectively during the 12 monthsending March 2018. Job growth in theleisure and hospitality sector resultedfrom increased temporary workers inthe HMA and visitor spending, particularly associated with increased oiland gas extraction activity. The city ofMidland hotel and motel tax receiptsfor the first quarter of 2018 were up74 percent from the same quarter during 2017. The sector has recorded jobgains every year since 2010, with theexception of 2016, when the sectordeclined by 200 jobs, or 1.2 percent.From 2009 through 2015, the sectoradded an average of 600 jobs, or 3.9percent, annually. The large numberof corporate headquarters in the
5Economic Conditions ContinuedM i d l a n d - O d e s s a , T X C O M P R E H E N S I V E H O U S I N G M A R K E T A N A LY S I SHMA impacts the professional andbusiness services sector. More than 30companies, primarily in the oil andgas industry, maintain a corporateheadquarters in the HMA, includingDawson Geophysical, Inc., the eighthlargest employer in the HMA.During the forecast period, nonfarmpayrolls are expected to increase byan average of 6,800 jobs, or 4.0 percent, annually. Oil prices are expectedto increase during the period, with theexpected price for WTI crude oil inApril 2019 and April 2020 c urrentlyestimated to be 64 and 66 per barrel,respectively (Federal Reserve Bank ofKansas City). Transportation costs areexpected to increase as pipeline capacity is exceeded and more expensivealternative methods are required todeliver oil and natural gas, however.As a result, the rate of nonfarmpayroll growth is expected to sloweach year during the forecast period.Job growth during the next year willinclude gains associated with severaloil- and gas-related developments thatare currently under way. The WeirGroup began construction in November2017 on a new 30 million facility toprovide oil and natural gas services tothe energy-producing industry that isexpected to create 100 new jobs whencomplete in 2019 and contribute tofurther cost reductions associated withoil extraction. Westridge Commons,a 38-acre walkable master-plannedcommunity, will include more than1 million square feet of combined office, retail, and residential spacewhen complete. The first phase isexpected to be complete in mid-2019and will include the 300,000-squarefoot regional office for AnadarkoPetroleum Corporation and its 300employees and 100,000 square feet ofretail and restaurant space.Population and HouseholdsThe current population of theMidland-Odessa HMA isestimated to be 329,600, an averageincrease of 6,350, or 2.1 percent,annually since 2010. Despite improving economic conditions, populationgrowth has been much slower since2015, however. Oil field workers wholost jobs during 2015 and 2016 havebeen slow to return, and existingresidents and temporary workers havefulfilled much of the recent jobgrowth. Since 2015, populationgrowth has averaged only 760 people,or 0.2 percent, annually, with netout-migration averaging 2,800 peopleannually. By comparison, from 2010to 2015, when high crude oil pricesresulted in increased oil and gasextraction activity, an average netin-migration of 6,475 people annuallycontributed to average populationgrowth of 9,725, or 3.3 percent,annually. Although the HMA hasexperienced net out-migration since2015, economic and housing indicators reflect strong in-migration duringthe past 6 months.During the 2000s, population growthwas greatest in the HMA from 2005to 2009, when oil prices increased andjob growth was strong. During theperiod, the population of the HMAincreased by an average of 6,375, or2.4 percent, annually (U.S. Census
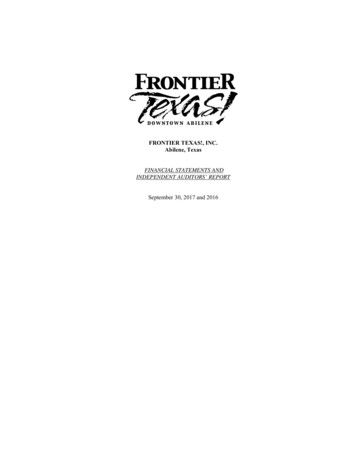
6Population and Households ContinuedFigure 4. Components of Population Change in the MidlandOdessa HMA, 2000 to Forecast4,000Average annual change3,0002,5002,0001,5001,00050002000 to 20102010 to currentNet natural changeCurrent to forecastNet migrationNotes: The current date is April 1, 2018. The forecast date is April 1, 2021.Sources: 2000 and 2010—2000 Census and 2010 Census; current and forecast—estimates by analystFigure 5. Number of Households by Tenure in the MidlandOdessa HMA, 2000 to 0,00002000Current2010RenterOwnerNote: The current date is April 1, 2018.Sources: 2000 and 2010—2000 Census and 2010 Census; current—estimates byanalystFigure 6. Population and Household Growth in the MidlandOdessa HMA, 2000 to Forecast8,0007,000Average annual changeM i d l a n d - O d e s s a , T X C O M P R E H E N S I V E H O U S I N G M A R K E T A N A LY S I S3,5006,0005,0004,0003,0002,0001,00002000 to 20102010 to currentPopulationCurrent to forecastHouseholdsNote: The current date is April 1, 2018.Sources: 2000 and 2010—2000 Census and 2010 Census; current and forecast—estimates by analystBureau population estimates as ofJuly 1). Net in-migration of 3,575people annually accounted for 56percent of the population increaseduring the period. Weakened economicconditions in the HMA resulted in anaverage population increase of only990, or 0.4 percent, annually from2009 to 2010. During this period, netout-migration of 1,975 peopleannually diminished total populationgrowth. Figure 4 shows the components of population change in theHMA from 2000 to the forecast date.The number of households in theHMA is currently estimated at 117,350,representing an average increase of2,025 households, or 1.9 percent,annually since 2010. During the2000s, when population growth wasslower, the number of householdsincreased at a rate of 1.4 percent, or1,300 households, annually. Currently,owner households comprise 64.8per cent of households compared with68.3 percent in April 2010. Tightermortgage lending standards and anincreased propensity to rent contributed to the decreased portion of ownerhouseholds since 2010. Figure 5 showsthe number of households in theHMA by tenure since 2000.During the 3-year forecast period, thepopulation of the HMA is expectedto increase by an average of 7,025, or2.1 percent, annually (Figure 6). Jobgrowth is expected to attract people tothe HMA, resulting in net in-migrationestimated at an average of 3,025people annually, or about 43 percentof expected population growth. Thenumber of households in the HMA isexpected to increase by an average of2,275 households, or 1.9 percent,annually during the next 3 years.
7Housing Market TrendsM i d l a n d - O d e s s a , T X C O M P R E H E N S I V E H O U S I N G M A R K E T A N A LY S I SSales MarketSales housing market conditions in theMidland-Odessa HMA are slightlytight, with an estimated vacancy rateof 1.1 percent, down from 1.5 percentin April 2010. Recent improvement inthe sales housing market is primarilydue to net in-migration during the past6 months and oil and gas industrycompanies buying and leasing single- family homes to be used as provisionaldormitories in anticipation of increasedhousing needs for temporary employees.During the 12 months ending March2018, new and existing home salesin the HMA (including single-familyhomes, townhomes, and condomin iums) increased 11 percent to 7,125compared with the previous 12 months(CoreLogic, Inc., with adjustments bythe analyst). The average sales priceincreased nearly 6 percent to 247,900during the same period. New homesales totaled 1,125 during the 12months ending March 2018, up by 60homes, or 6 percent, from the previous 12 months, while the number ofexisting home sales increased by 630,or 12 percent, to 6,000 homes sold.The average new home sales pricew
and the Midland, TX and Odessa, TX MSAs have the two highest concentra-tions of nonfarm payrolls in the min-ing, logging, and construction sector of all MSAs in the United States, 29.7 and 23.4 percent, respectively (Bureau of Labor Statistics). During the 12 months ending M