Transcription
IJCSNS International Journal of Computer Science and Network Security, VOL.7 No.9, September 2007103Rummage Web Server Tuning Evaluation through Benchmark(Case study: CLICK, and TIME Parameter)Hiyam S. EnsourDr. Ahmad KayedThe Arab Academy for Banking andFinancial Sciences. Amman, Jordan. 2007.The Applied Sciences University.Amman, Jordan. 2007.Abstract- This study examines a web server performancetuning by using special main parameters in benchmark,using real data and real applications in more than 13different cases. Two adaptive parameters (CLCIK andTIME) are used as measurements for tuning. A web serverstress tools 7 benchmark (WSST) is used as a recognizedapplication. Some procedures are projected to comparethe final results, the first process is based on finding themain factor of the parameters affecting on tuning. Second,a variety of the values of the benchmark parameters arediscussed to have better results of the web serverperformance by finding the core relationship among mainparameters in WSST. The parameters criteria show theeffect on web server behavior under certain conditions andenvironments. We monitor it at different times and works.Contributing discuses some results such as, bottleneck,traffic, and response time which related with criteria's andmeasurements.Keywords: Performance, Web server, Benchmark, andTuning.OverviewThis paper presents the importance web serverperformance tuning in introduction section in first section,and why uses benchmark as main solution? Problemstatement for web server is found in section2. All test webssever stress tools benchmark (WSST) criteria, the testenvironment, and main parameters will be shown insection 3. Observations, scenarios of click and timeprocess will be discussed in section 4. Results andconclusions, along with future work. Will be addressed inthe last section.1IntroductionThe importance of performance web servers is quiteclear; therefore, the main purpose of this study is to gain abetter understanding of web server performance tuning(WSP tuning). Web servers did take the performance as anintrinsic design premise; this is acceptable at the earlyadoption phase of the Web server. Most web servers areused to serve a small given load over low-capacity links. Incontrast, nowadays, the main features of web servers areManuscript received September 5, 2007Manuscript revised September 20, 2007stabilized and commercial implementations are normal.Consequently, the importance of web server performancetuning has increased. Scalability, reliability, andcontinuality are crucial elements in studying theperformance tuning [7, 8]. Benchmarks reflect theperformance by monitoring the parameters that mightaffect the web server. This research will study a wellknown benchmark named Web Server Stress Tools 7(WSST). The factors to be used will be defined, and thentheir effect will be investigated on a web serverperformance under work load for a certain application.The benchmark will be used to evaluate the performanceof the web server depending on different parameters suchas users, delay, time, clicks, ramp, users, URL andrecursive browsing. Software, hardware and operatingsystem environments are fixed. We select only naturalfactors affecting the web server performance (WSP), whichare CLICK, TIME and how they are related to click time,click per second, and hits per second. Benchmark dependson testing a simulation procedure to represent the modelbehavior of the web server in the time domain. Thesimulator in benchmark reveals an unpredicted behavior ofthe examined WSP. This would imply flexible techniquesin benchmark for performance tuning evaluation [11, 12].Web Server Stress Tool (WSST) was developed byPaessler GmbH 1 [1]; it is a configurable client-serverbenchmark for HTTP servers that use workload parameters.It uses three tests to measure the server performance;namely, HTML, CGI, and API. By simulating the HTTPrequests generated by many users; i.e.; benchmark can testWSP under normal and excessive loads [1, 4, and 5]. Theweb server (WS) behavior can improve by tuning severalparameters. Discovering the direct relations among suchparameters is essential to determine the best possible webserver behavior and, consequently, achieve a highquantitative performance for each parameter in the WS.1http://paessler.net
1042IJCSNS International Journal of Computer Science and Network Security, VOL.7 No.9, September 2007Problem Statement for WebServer TuningThere are many ways to tune a web server'sperformance. These include modeling, analytical system,mathematical simulation, and benchmark. Benchmark isused in this study for a number of reasons. Benchmarkgives us a reliable, repeatable and t(measurements) of complete hardware/software webserver under (close to) realistic workloads [13]. It has aresponsibility for tune WS to best serve static web pagesor dynamically compiled application pages. Each webserver demands a different hardware, application, andIIS performance for the tuning options. Anotherconsideration is the amount of traffic that we realisticallyexpect our WS to handle, particularly during the peakload periods. Load and time will affect the WSperformance and the varying business choices. Oneshould be well acquainted with what these loads will beand simulate them on our servers before putting themon-line to know how the web server will perform itsfunction. These are some reasons why it is important torecommend how to tune the web server throughbenchmark2 [15].2.1Web Server TuningOne of the difficulties in tuning the web server knowswhat to tune exactly? For this reason, it is vital tomonitor the web servers' behavior under certain criteriaafter adjusting the settings of the hardware, software,and web applications. Tuning the WS will require us tocarefully monitor how changes to it will affect theperformance of the web server. First, we should knowhow the server is functioning, and then we can makechanges to improve performance. Changes should bemade once at a time and under a number of clicks, userswith a rollback tests. Otherwise, it will be difficult toassess the impact of individual changes. To improve theweb server performance tuning, we will examine everypart of the WSP parameters of benchmark. This, forexample, includes the click time, time for the first byte,time to connect, time for DNS, and time for the localsocket as main factors through the tuning process.2http://microsoft.com2.2Proposal SolutionFeeding information about web server has beenused extensively to solve many kinds of WSP problems.One of the fundamental proprieties making these WSPuseful is benchmark for tuning. In this work, we use twodifferent types of web server benchmark parameters. Inprevious studies, we examined all factors playing the mostconspicuous effect on the behavior of the web server [15].Here, however, it is recommended to use (CLICK, TIME)as main parameters to guide us in studying the web server'sbehavior to deal with the tuning concept.2.3Web Server Stress Benchmark (WSST)Performance tests were used to examine each part ofthe web server or the web application to discover how tooptimize them for boosting the web traffic (e.g. undernumbers of clicks). WSST supports types of tests and iscapable of running several (e.g. 20-100) simultaneousrequests on one URL and record the average time toprocess those requests.2.4Why use WSST in our Experiment?Most web sites and web applications run smoothlyand appropriately as long as only one user or a few usersare visiting at the given time. What happens whenthousands of users access the website or web application atthe same time? What happens to the web server in thiscase? By using the WSST, we can simulate various loadpatterns for our web server, which will help us spotproblems in our web server set-up. With steadily risingloads (also called “ramp tests”), we can find out how muchload the server can handle before serious problems arise[1].The WSST can be used for various tests [1]:Performance Tests (PT), Load Tests (LT), Stress Tests(ST),and Ramp Tests (RT) where PT are used to test eachpart of the web server or the web application to discoverhow to best optimize them for higher web traffic. LT areperformed by testing the website using the best estimate ofthe traffic website needs to support. Consider this is a “realworld test” of the website. ST constituted simulated “bruteforce” attacks that apply excessive load to web server. RTis a set of variations of the stress tests in which the numberof users raise during the test processes from a single userto hundreds of users. Our tests need only PT, LT, and ST.
IJCSNS International Journal of Computer Science and Network Security, VOL.7 No.9, September 20073The Main Parameters of theExperimentWe have adopted many tests used in literature [1, 2, 3, 5,and 12]. They use sometimes all the parameters at thesame time without being specific and separate, weindividual the parameters in our case just to tuning ourWS. The parameters that are to be taken into considerationin WSST are: users, clicks, time, delay, ramp, URL, andrecursive browsing, this study will focus on CLICK andTIME only which helps to get a holistic view ofwebsite/webserver/applicationperformance .WhereCLICKS represent finish time when each user has initiateda given number of clicks. TIME represent the tests that runfor a specified number of minutes e.g. keep a server underfull load for 15 hours. [1, 5]3.1WSST Parameters Experimental TestThis Benchmarking tool simulates web clients,servers, and a large number of client/server to stress webserver. The configuration parameters were fixed in thetests run are [1]: Hardware configuration, load generatorsnumber and type , number of the repeating, time duration,the delay of click, run test with number of clicks per user,run test in number of minutes, and URL name.In our work we have some constants in testsexperimental as follows: the number of user are 10, weadapt 10 users as a normal case, but before we monitoringthe behaviors of WS under workload we check it under5 ,10 , and 100 users ,so the perfect example here is thetest under 10 user. 100 clicks per every user is the bestexample in our test that comes after studying the numberof click per user. We repeat the tests 13 times underdifferent numbers of clicks and times with changing theheterogeneous workload that done under 5 seconds asconstant of click delay in random click delay, we adapting20 MG for each workspace. The constant requirement inWSST experimental test configuration parameters whichhave five variables with its values and special comments inconsecutive: CLICK Runt test from 5 to 120 clicks per user,this is the amount of click from the beginning to the end ofthe WSST test. TIME Run test from 5 to 120 per minute,this is the amount of time from the beginning to the end ofthe web stress tools test. DELAY with 5 seconds, how longa test WS is to wait before starting the test. WORKSPACEwith 20 MB, The size of data's files used by a test WS,each of data has its own workspace. NUMBER OF USER:with 5, 10, 50, and 100.3.2105Test EnvironmentOur tests environment specifications are fixed eitherin software or in hardware as follows: (CPU, mainMemory, and RAM), Server Software (HTTP), ServerOperating System (windows 2000, windows XP, apachefor web server), Network Speed either in (Gig, Meg), andthe kind of workload (static, dynamic). More specifically, a64 MB of RAM in each client, a 100Base-TX networkadapter in each client, a 500 MB disk minimum in eachclient, a full-duplex, and switched network, in ServerConfiguration need CPU: 500 MHz Pentium III, RAM:256 MB, and Network: 2 x 100Base-TX. [1, 2, and 7].3.3Test WSST CriteriaAny changing in click and time parameters inWSST will by default make changing in some criteria likeprotocol time for all click times, time for first byte, time toconnect, time for DNS, and time for local. Where the clicktime represents a simulated user’s mouse click that sends arequest (one of the URLs from the URL list) to the serverand immediately requesting any necessary redirects, framesand images (if enabled). The click time is calculated as thetime between when the user clicked and when the serverdelivered the requested resources with all referenced items(images etc.). Average Click Times: show the averagevalues per URL, per user or per website, Time for DNStalked about the Time to resolve a URL's domain nameusing the client system's current DNS server, also the Timeto connect show Time to set up a connection to the server.And the last criteria represent the time between initiating arequest and receiving the first byte of data from the serverthat is a Time to first byte (TFB).3.4ObservationsThis section determines briefly the WSST testscenarios of our experimental research, which are based onobservations that are made during the testing process.3.4.1Scenarios of ResearchOur processes consist of two distinct phases;scenarios depending on the CLICK parameter, andscenarios depending on the TIME parameter.
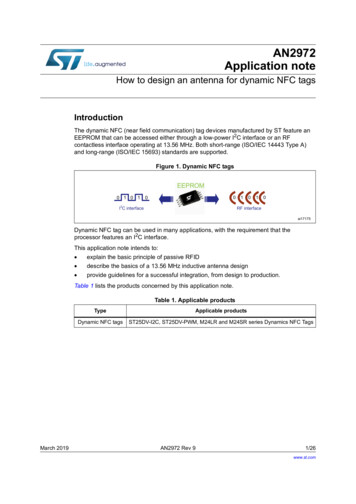
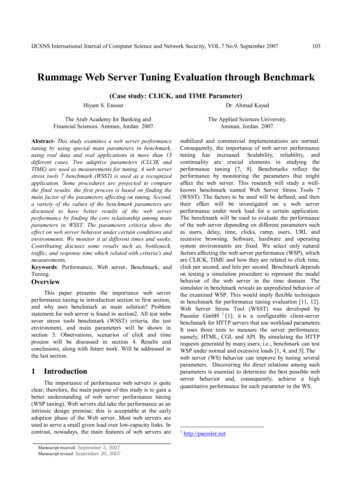
IJCSNS International Journal of Computer Science and Network Security, VOL.7 No.9, September 2007106Protocol Times for all URLsTime [ms]Time [ms]Protocol Times for all 3ð4Click Time56ð78Time to First Byte9101112Time Since Start of Test [s]ðTime to Connectð13Time for DNS1415ð1617181920Time for local socketTest Ty pe: CLICKS (run test until 10 clicks per user)User Simulation: 10 simultaneous users - 5 seconds between clicks gure 1.1 10 clicks per user in CLICK parameter0204060p Click TimeCLICK Parameter Scenario.The workload of the web server is presented in 13stages ranging from 5 to 120 clicks per second. However,here we show the results only in graphs that representcurve actions in our research. We will give a sampleexample in the case of 100 clicks per user. The details ofresults will be stated in the conclusions. It is necessary toshow graphs and final results of 10, 50, and 100 clicks tovalidate the argument.Protocol Times for all URLs130120110100100120TimeSince Start of Test [s]140160p Time for DNS180200220p Time for local socketTest Type: CLICKS(run test until 100 clicks per user)User Simulation: 10 simultaneous users - 5 seconds between clicks (Random)3.4.214080p Time to First Byte p Time to ConnectFigure 1.3 (100 clicks per user in the CLICK parameter)Figure 1: Click Parameters (Click time, time for first byte,time to connect, time for DNS, and time for local socket).3.4.3TIME Parameter ScenarioThe workload of WS is presented in 13 stages from 5,10, 20, to 120 times per second. However, the results hereare shown in graphs representing the 10, 50, and 100times per second as a sample only. The curve actionsrepresenting the results will be clear in the results andconclusion section.Time [ms]908070Protocol Times for all URLs60504035030203001001020ðClick Time30ð40Time to First Byte5060Time Since Start of Test [s]ðTime to Connectð70Time for DNS80ð90100110Time for local socketTest Ty pe: CLICKS (run test until 50 clicks per user)User Simulation: 10 simultaneous users - 5 seconds between clicks (Random)250Ti me [ms]0200150100Figure 1.2 (50 clicks per user in CLICK parameter)500050100ð150Click Timeð200250300350Time Since Start of Test [s]Time to First ByteðTime to Connectð400Time for DNS450ð500550Time for local socketTest Ty pe: TIME (run test f or 10 minutes)User Simulation: 10 simultaneous users - 5 seconds between clicks (Random)Figure 2.1 10 ms time parameterProtocolTimes for all URLs13012011010090Time [ms]Figure 1 describes the cases (10,50,100) in the clickparameter: 10 clicks: time to first byte, time to connect,time for DNS, and time for socket are rising slightlybetween 0 and 20 ms, but the click times rise sharply andthen plummet between 0 and 120 ms. 50 clicks: click timesreach the peak in 140 ms but the other criteria reach aplated behavior with time since the start of test(s) between0 and 150 s. 100 clicks: click times change gently andrelatively and the other criteria remain unchanged but over250 ms since start of the test. We have a conspicuouschange compared with the 50 clicks in the click parameter.It was noticed that the increasing number of users with thehuge volume of clicks adds to the workload of the webserver. This draws a strong correlation between the clickand its criteria, which are the click time, time to first byte,time to connect, time for DNS, and time for socket.8070605040302010002004006000 ClickTime8001,0001,2001,4001,6001,800TimeSince Start of Test [s]0 Time toFirst Byte 0 Time toConnect2,0000 Time for DNSTest Type: TIME (run test for 50 minutes)User Simulation: 10 simultaneous users - 5 seconds between clicks (Random)Figure 2.2 50 ms time parameter2,2002,4000 Time for local socket2,6002,800
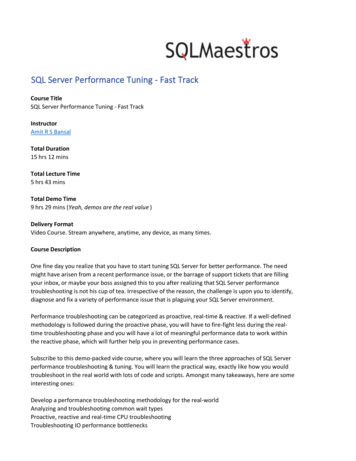
IJCSNS International Journal of Computer Science and Network Security, VOL.7 No.9, September 2007107clicks or hits in a short period of time, which causesdifficulties in WS and bad responses.Protocol Times for all URLs1009080Time [ms]70605040302010005001,000ð ClickTime1,5002,0002,5003,0003,500TimeSinceStart of Test [s]ð TimetoFirst Byte ð TimetoConnect4,000ð TimeforDNS4,5005,0005,500ð Timeforlocal socketTest Type: TIME(runtest for 100 minutes)User Simulation: 10 simultaneous users - 5 seconds between clicks (Random)Figure 2.3 100 ms time parameterFigure 2: Time parameters (Click time, time for first byte,Time to connect, time for DNS, time for local socket.)Figure 2 describes the cases of 10, 50,100 ms in thetime parameter: 10 times: Normal behaviors with criteria(time to first byte, time to connect, time for DNS, and timefor socket), except for slight changes in the click time. 50times: The click times increase sharply and relatively witha conspicuous change in the behavior of other criteria(time to first byte, time to connect, time for DNS, and timefor socket) compared with the click parameter. 100 times:in 2,500 s the click times reach the peak with 100 ms intime and a strong dramatic behavior, and with a slightsteady state and a relative change in other criteria. So, wecan do more actions by extending the time. It is quite clearthat the click times in the time parameter have a reversesrelation with the click time in the click parameter. WSSTshows that we can enhance the WS by depending on thetime parameter while raising the number of clicks. A highworkload resulting from hits and clicks will not cause anyproblem to the WS if we have enough time for doing allthat clicks and hits per second. The result per user and theresult per URL will help us to do some special calculationslike counting the number of hits on the WS, and to findthe maximum and minimum number of hits and K-bits persecond. In addition, it will be feasible to compare the finalresults per URL and per User for the CLICK and TIMEparameters, which contains some criteria such as click,time spent [ms], and average click Time [ms], with theexisting average click time in minutes and determine thenumber of users in our experimental test for all the casesparameters (click, and time). Tables 2, 3, and 3 show thisbenefit.In these two cases (Click, Time), we conclude thatthe time parameter rises dramatically in the click time,which indicates that time plays a major role in changingthe WS behaviors. It is better to increase time while wehave many clicks, decrease the load on WS just given asubmit time for every click, and stop doing a hundred ofThe first column in table 1and 2 are describesdifferent numbers of clicks. This tells us that an increasein the number of users who send a request (URL) to theweb server leads to an increase in the number of hits as acomplete HTTP request. This took place in the clickparameter in WSST, which caused click duplication inevery second and minute, which means an excessive loadon the web server leads us to have a normal response timewith zero error in HTTP request. Consuming the memory,the request of URL's with different types makes the webserver so busy.Time spent [ms] in the time parameters in our testswith multiple trials for more than 13 times in differentcases shows that the time spent increases in parallel andconcurrency grows larger in time. Depending on equation1, there are many different values between the time spentin time parameters and the time spent in click parametersin order not to waste much time, we recommend doingmany request (clicks) in a short span of time for the WSwill not need open times to answer the requests. Becausethe server loses much time and makes the user wait for along time, we reiterate our recommendation not to spendmany times without making good use. See the secondcolumn in table 3.Equation 1: The differences between Time Spent [ms] inCLICK, TIME parameters.(1)Ddiff represents the value of different factors. Themile measures the time spent second, which is one of thecriteria. While TIME and CLICK represent the main
108IJCSNS International Journal of Computer Science and Network Security, VOL.7 No.9, September 2007parameters, they are used in WSST, where the dot in theequation indicates the parameter type.Clicks increase in the click parameter in parallel withthe rising number of clicks. However, this would be amassive increase in the time parameter compared with thesame number of clicks under the click parameter. The timespent [ms] increases directly with time in the timeparameter more than it does in the click parameter. TheAvg. click time [ms] drops with time in the time parametercomparing with the click parameter. In other words, wehave the highest value in the click and time spent [ms]criteria and the lowest value in the Avg. click time [ms] intime parameter. For users, the average times in general arenormal values if the average is calculated within a longspan of time. The results, however, will not be satisfactoryif calculated fewer than hundreds of clicks. (See table 3)4Discussion and ResultsIn this work the purpose of web server evaluationsprocesses by using WSST, which is for improving theperformance and catching the moment of tuning in it.Where protocol time for all URLs in all cases (TIME,CLICK) represent an HTTP request consists of severalstages. First, the WS name has to be resolved into an IPaddress using DNS (Time for DNS), and then an IP port isopened on the server by the client to send the requestheader (Time to Connect). The server then answers therequest (Time to First Byte) and sends all data. When alldata is transferred, the request is finished (Click Time).Also in the above graphs a line is shown for the “time forlocal socket” which is the time that WSST needed toacquire an open socket from the IP stack of the machine itruns on. For example, in a usual test, this value shouldalways be in the lower millisecond area (1-30 ms). Forextreme traffic tests, this value can rise above 50-100 mswhich is a sign that the performance limits of the localmachine have been reached, that was indicated anddisplayed in our graphs.Depending on the observations above, we see thatCLICK and TIME are strongly related and have an impacton the WS tuning evaluation. Ignoring the role ofbenchmark on WS will cause poor WSP. If the number ofclicks is low as shown in our test (10, 50,100 clicks peruser), the server would be responding to requests quickly.If the number of clicks is high, responding to a requestwill be slow, because we would have dedicated too muchmemory to the caches. In this case, we suggest tuning theWSST to leave enough memory for the rest of the WS. Wealso need to increase the amount of RAM on the webserver, although lowering the cache sizes can be effective.The increase number of clicks would cause the workloadon the web server to rise dramatically. This wouldsuddenly cause a relative change to the response time,increasing the time given for actions, and allowing forfaster responses with fewer errors in the WSP. Highvolume of traffic, which depends on the number of clicksand hits, makes the memory loaded. After monitoring theweb server, we wonder if the server has enough memorysize or not. We recommend that the minimum amount ofRAM needed for the web server is 128MB, but 256 MB to1GB will be better for the WSP tuning.We know that we may have a problem when WStraffic is high but the number of requests barely budges.When that happens, it’s likely that there is a bottleneck inthe WS. Bottlenecks occur with the rise of the number ofclicks and periods of times are longer than they should be.We see that the time for the first byte, and other criteriahave nearly the same values and behaviors, except for thecriteria of the click time, which has different values andbehaviors in the click parameters (See table 1, 2). However,they also have different values and behaviors at the timeparameters. This shows that we can have a rise in the timeconnect, time for DNS, and local socket when there is achange in the time parameter, because the bottleneck ofthe WS grows smaller.5ConclusionsAll criteria for CLICK and TIME parameters aremeasured, by that, we have to decide if we reduce theserver load through increasing the time, and decrease theloads on WS (reverse relation) happens through decreasingthe numbers of clicks and hits, this makes WSP moretunable in criteria's especially on client’s latency, that leadus to reduce network bandwidth consumption easily, thenthe WSP tuning becomes more reliable by default if a userhas enough time they should not worry about how manyclicks they had and whether the WS is busy or not.Because users can do whatever they like without problemsor errors, they should just give the server the time whichweb server needs. We conclude that if users do not havetime and need to do their work very quickly; they shouldpush themselves to decrease the number of clicks that
IJCSNS International Journal of Computer Science and Network Security, VOL.7 No.9, September 2007support the focus of WSP tuning, making the web serverfaster, and more efficient.We don't need to wait until traffic is choking the WS,or forcing to implement load-balancing solutions andthrowing more servers at the problem. Distribution andobject architectures help us to implement load balancingand fault tolerance. Load-balancing products typically arenot required until a WS scales so high that the WSbecomes a bottleneck once that happens users have twochoices: load balance, or increase the bandwidth of theirconnections to the Web. Our parameters are affecteddirectly on it case, so we need to be more careful whendetermining how much number of clicks and how longtimes are available3.Sometimes a system in WS designed for a certainlevel of traffic will spiral into unacceptable response timeswhen traffic increases beyond a certain point. This isknown as a scalability issue. We need a chance toeventually encounter a bottleneck. To locate the bottleneckthat comes from raising the number of Click with specifictime, we need to use a series of performance monitors.These monitors allow users to view the server load andresponse time under a variety of real-world or testconditions.Response time represents the time (often an average)that elapses between the initial request for information andwhen that data is delivered (or not delivered, when theserver can’t provide it before the timeout limit is reached).When the WS is processing a large number of requests(under load), it may take longer time to complete than ifthe server were unloaded. For user requests, this can resultin increased response time for clients. If the server is underan excessive load, depending on WSST analysis we closetoward “self-tuning” 4 concept when use benchmark as aguide and main directed for WS.6Future workFuture work will include monitoring the mainparameters in benchmark for evaluating web server underworkload with another criteria, such as the relationbetween Click/hits/users/error/URL at the same timetuning evaluate the web server sandtech.com7109References[1] http://paessler.com[2] JohnDilley,"WebServerWorkloadCharacterization", Hewlett-Packard Laboratories.[3] J. Dilley, R. Friedrich, T. Jin, J. Rolia. MeasurementTools and Modeling Techniques for Evaluating WebServer Performance. HPL-TR-96-161, December1996. Submitted to Performance Tools ‘97.[4] Levy, R., et al. Performance Management for ClusterBased Web Services. In The 8th IFIP/IEEEInternational Symposium on Integrated NetworkManagement (IM2003). 2003. Colorado Springs,Colorado, USA.[5] Li, C., et al. Performance Guarantee for ClusterBased Internet Services. In The 23rd IEEEInternational Conference on Distributed ComputingSystems (ICDCS 2003). 2003. Providence, RhodeIsland.[6] Wolf, J. and P.S. Yu, On Balancing the Load in aClustered Web Farm. ACM Transactions on InternetTechnology, 2001. 1(2): p. 231-261.[7] Tapus, C., I.-H. Chung and J.K. Hollingsworth.Active Harmony: Towards Automated PerformanceTuning. In SC'02. 2002. Baltimore, Maryland.[8] Carlos Maltzahn, Kathy J. Richardson, and DirkGrunwald. Performance issues of enterprise level webproxies. In Proceedings of the ACM SigmetricsConference on Measurement and Modeling ofComputer Systems, Seattle, WA, June 1997. ACM.[9] Jussara M. Almeida, Virg ilio Almeida, and David J.Yates. Measuring the behavior of a World-Wide Webserver. In Seventh Conference on High PerformanceNetworking (HPN), pages 57–72, White Plains, NY,April 1997. IFIP.[10] M. Aron, D. Sanders, P. Druschel, and W.Zwaenepoel. Scalable Content-aware RequestDistribution in Cluster-based Network Servers. InProceedings of the 2000 Annual USENIX technicalConference, San Diego, CA, June 2000.[11] V. V. Panteleenko and V. W. Freeh. InstantaneousOffloading of Transient Web Server Load. InProceedings of the Sixth International Workshop onWeb Caching and Content Distribution, Boston, 2001.[12] P. Joubert, R. B. King, R. Neves, M. Russinovich, J.M. Tracey. High-Performance M
The importance of performance web servers is quite clear; therefore, the main purpose of this study is to gain a better understanding of web server performance tuning (WSP tuning). Web servers did take the performance as an intrinsic design premise; this is acceptable at the early adoption phase of the Web server. Most web servers are