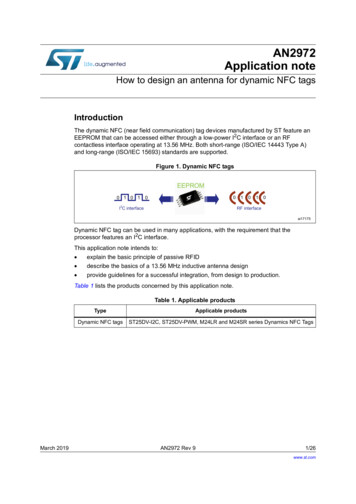
Transcription
Oracle Database2 Day Performance Tuning Guide12c Release 2 (12.2)E85587-01June 2017
Oracle Database 2 Day Performance Tuning Guide, 12c Release 2 (12.2)E85587-01Copyright 2007, 2017, Oracle and/or its affiliates. All rights reserved.Primary Authors: Rajesh Bhatiya, David McDermid, Lance Ashdown, Immanuel ChanContributors: Debaditya Chatterjee, Maria Colgan, Dinesh Das, Kakali Das, Karl Dias, Mike Feng, YongFeng, Andrew Holdsworth, Kevin Jernigan, Caroline Johnston, Aneesh Kahndelwal, Sushil Kumar, Sue K.Lee, Herve Lejeune, Ana McCollum, Colin McGregor, Mughees Minhas, Valarie Moore, Deborah Owens,Mark Ramacher, Uri Shaft, Susan Shepard, Janet Stern, Stephen Wexler, Graham Wood, Khaled Yagoub,Hailing Yu, Michael ZampiceniThis software and related documentation are provided under a license agreement containing restrictions onuse and disclosure and are protected by intellectual property laws. Except as expressly permitted in yourlicense agreement or allowed by law, you may not use, copy, reproduce, translate, broadcast, modify,license, transmit, distribute, exhibit, perform, publish, or display any part, in any form, or by any means.Reverse engineering, disassembly, or decompilation of this software, unless required by law forinteroperability, is prohibited.The information contained herein is subject to change without notice and is not warranted to be error-free. Ifyou find any errors, please report them to us in writing.If this is software or related documentation that is delivered to the U.S. Government or anyone licensing it onbehalf of the U.S. Government, then the following notice is applicable:U.S. GOVERNMENT END USERS: Oracle programs, including any operating system, integrated software,any programs installed on the hardware, and/or documentation, delivered to U.S. Government end users are"commercial computer software" pursuant to the applicable Federal Acquisition Regulation and agencyspecific supplemental regulations. As such, use, duplication, disclosure, modification, and adaptation of theprograms, including any operating system, integrated software, any programs installed on the hardware,and/or documentation, shall be subject to license terms and license restrictions applicable to the programs.No other rights are granted to the U.S. Government.This software or hardware is developed for general use in a variety of information management applications.It is not developed or intended for use in any inherently dangerous applications, including applications thatmay create a risk of personal injury. If you use this software or hardware in dangerous applications, then youshall be responsible to take all appropriate fail-safe, backup, redundancy, and other measures to ensure itssafe use. Oracle Corporation and its affiliates disclaim any liability for any damages caused by use of thissoftware or hardware in dangerous applications.Oracle and Java are registered trademarks of Oracle and/or its affiliates. Other names may be trademarks oftheir respective owners.Intel and Intel Xeon are trademarks or registered trademarks of Intel Corporation. All SPARC trademarks areused under license and are trademarks or registered trademarks of SPARC International, Inc. AMD, Opteron,the AMD logo, and the AMD Opteron logo are trademarks or registered trademarks of Advanced MicroDevices. UNIX is a registered trademark of The Open Group.This software or hardware and documentation may provide access to or information about content, products,and services from third parties. Oracle Corporation and its affiliates are not responsible for and expresslydisclaim all warranties of any kind with respect to third-party content, products, and services unless otherwiseset forth in an applicable agreement between you and Oracle. Oracle Corporation and its affiliates will not beresponsible for any loss, costs, or damages incurred due to your access to or use of third-party content,products, or services, except as set forth in an applicable agreement between you and Oracle.
ContentsPrefaceAudiencexDocumentation AccessibilityxRelated DocumentsxiConventionsxiChanges in This Release for Oracle Database 2 Day Performance Tuning GuideChanges in Oracle Database 12c Release 2 (12.2.0.1)xiiChanges in Oracle Database 12c Release 1 (12.1.0.2)xiiChanges in Oracle Database 12c Release 1 (12.1.0.1)xiiiPart I12Getting StartedIntroduction1.1About This Guide1-11.2Common Oracle DBA Tasks1-11.3Tools for Tuning the Database1-21.4Accessing the Database Home Page1-3Oracle Database Performance Method2.12.2Gathering Database Statistics Using the Automatic Workload Repository2-12.1.1Time Model Statistics2-22.1.2Wait Event Statistics2-42.1.3Session and System Statistics2-42.1.4Active Session History Statistics2-42.1.5High-Load SQL Statistics2-5Using the Oracle Performance Method2.2.1Preparing the Database for Tuning2-52-6iii
2.3Part II3Tuning the Database Proactively2-72.2.3Tuning the Database Reactively2-72.2.4Tuning SQL Statements2-8Common Performance Problems Found in Databases2-8Proactive Database TuningAutomatic Database Performance Monitoring3.13.242.2.2Overview of Automatic Database Diagnostic Monitor3-13.1.1ADDM Analysis3-23.1.2ADDM Recommendations3-23.1.3ADDM for Oracle Real Application Clusters3-3Configuring Automatic Database Diagnostic Monitor3-33.2.1Setting Initialization Parameters to Enable ADDM3-33.2.2Setting the DBIO EXPECTED Parameter3-43.2.3Managing AWR Snapshots3-53.2.3.1Creating Snapshots3-53.2.3.2Modifying Snapshot Settings3-63.3Reviewing the Automatic Database Diagnostic Monitor Analysis3-83.4Interpretation of Automatic Database Diagnostic Monitor Findings3-103.5Implementing Automatic Database Diagnostic Monitor Recommendations3-103.6Viewing Snapshot Statistics3-14Monitoring Real-Time Database Performance4.14.2Monitoring User Activity4-14.1.1Monitoring Top SQL4-44.1.2Monitoring Top Sessions4-54.1.3Monitoring Top Services4-54.1.4Monitoring Top Modules4-64.1.5Monitoring Top Actions4-74.1.6Monitoring Top Clients4-84.1.7Monitoring Top PL/SQL4-94.1.8Monitoring Top Files4-104.1.9Monitoring Top Objects4-10Monitoring Instance Activity4-114.2.1Monitoring Throughput4-114.2.2Monitoring I/O4-124.2.2.1Monitoring I/O by Function4-144.2.2.2Monitoring I/O by Type4-15iv
4.2.2.34.3584.2.3Monitoring Parallel Execution4-174.2.4Monitoring Services4-18Monitoring Host Activity4-194.3.1Monitoring CPU Utilization4-204.3.2Monitoring Memory Utilization4-234.3.3Monitoring Disk I/O Utilization4-25Determining the Cause of Spikes in Database Activity4-274.5Customizing the Database Performance page4-30Monitoring Real-Time Database OperationsAbout Monitoring Database Operations5-15.1.1Types of Database Operations5-25.1.2Purposes of Monitoring Database Operations5-25.1.3Enabling Monitoring of Database Operations5-35.1.4Attributes of Database Operations5-35.2Creating a Database Operation5-35.3Monitoring Database Operations in Cloud Control5-55.3.1Viewing SQL Execution Details for a Composite Database Operation5-55.3.2Viewing SQL Execution Details for a SQL Statement5-75.3.3Viewing SQL Execution Details for a PL/SQL Statement5-8Monitoring Performance Alerts6.1Setting Metric Thresholds for Performance Alerts6-16.2Responding to Alerts6-26.3Clearing Alerts6-3Part III74-164.45.16Monitoring I/O by Consumer GroupReactive Database TuningManual Database Performance Monitoring7.1Manually Running ADDM to Analyze Current Database Performance7-17.2Manually Running ADDM to Analyze Historical Database Performance7-37.3Accessing Previous ADDM Results7-5Resolving Transient Performance Problems8.1Overview of Active Session History8-18.2Running Active Session History Reports8-2v
8.3Active Session History Reports8.3.198-48.3.1.1Top User Events8-48.3.1.2Top Background Events8-58.3.2Load Profile8-58.3.3Top SQL8-68.3.4Top Sessions8-78.3.5Top DB Objects/Files/Latches8-88.3.5.1Top DB Objects8-88.3.5.2Top DB Files8-88.3.5.3Top Latches8-9Activity Over Time8-98.3.68.4Top Events8-4Diagnosing Serious Performance Problems in Real Time8-11Resolving Performance Degradation Over Time9.1Managing Baselines9.1.19.29.3Creating a Baseline9-19-29.1.1.1Creating a Single Baseline9-29.1.1.2Creating a Repeating Baseline9-49.1.2Deleting a Baseline9-69.1.3Computing Threshold Statistics for Baselines9-69.1.4Setting Metric Thresholds for Baselines9-79.1.4.1Setting Metric Thresholds for the Default Moving Baseline9-89.1.4.2Setting Metric Thresholds for Selected Baselines9-9Running the AWR Compare Periods Reports9-109.2.1Comparing a Baseline to Another Baseline or Pair of Snapshots9-109.2.2Comparing Current System Performance to a Baseline Period9-139.2.3Comparing Two Pairs of Snapshots9-15Using the AWR Compare Periods Reports9.3.1Summary of the AWR Compare Periods Report9-169-179.3.1.1Snapshot Sets9-179.3.1.2Host Configuration Comparison9-179.3.1.3Cache Sizes9-179.3.1.4Load Profile9-179.3.1.5Top Timed Events9-189.3.2Details of the AWR Compare Periods Report9-199.3.3Supplemental Information in the AWR Compare Periods Report9-19vi
10Using Automatic Workload Repository Warehouse for GeneratingPerformance Reports10.1Setting Up the AWR Warehouse10-210.2Working with Source Databases10-310.3Uploading Snapshots to the AWR Warehouse10-410.4Using Performance Pages with the AWR Warehouse10-410.5Monitoring and Researching Incidents and Errors10-710.6AWR Warehouse Best Practices10.6.1111210-1010.6.1.1Memory Management10-1010.6.1.2Storage Requirements10-1010.6.1.3Backup10-1110.6.1.4Redo Log Size10-1110.6.1.5Stats Collection10-1110.6.1.6The job queue processes Parameter10-1110.6.1.7Access Control10-1110.6.2Part IVDatabase Best Practices10-10Enterprise Manager Best Practices10-1110.6.2.1AWR Warehouse Credentials10-1210.6.2.2Source Database Credentials10-1210.6.2.3Staging Location on AWR Warehouse10-1210.6.2.4Network Latency10-12SQL TuningIdentifying High-Load SQL Statements11.1Identification of High-Load SQL Statements Using ADDM Findings11-111.2Identifying High-Load SQL Statements Using Top SQL11-211.2.1Viewing SQL Statements by Wait Class11-311.2.2Viewing Details of SQL Statements11-311.2.2.1Viewing SQL Statistics11-511.2.2.2Viewing Session Activity11-711.2.2.3Viewing the SQL Execution Plan11-811.2.2.4Viewing the Plan Control11-911.2.2.5Viewing the Tuning History11-10Tuning SQL Statements12.1Tuning SQL Statements Using SQL Tuning Advisor12.1.1Tuning SQL Manually Using SQL Tuning Advisor12-212-2vii
12.1.212.2Managing SQL Tuning Sets12.2.113Viewing Automatic SQL Tuning ResultsCreating a SQL Tuning Set12-512-812-912.2.1.1Creating a SQL Tuning Set: Options12-912.2.1.2Creating a SQL Tuning Set: Load Methods12-1012.2.1.3Creating a SQL Tuning Set: Filter Options12-1312.2.1.4Creating a SQL Tuning Set: Schedule12-1412.2.2Dropping a SQL Tuning Set12-1612.2.3Transporting SQL Tuning Sets12-1612.2.3.1Exporting a SQL Tuning Set12-1612.2.3.2Importing a SQL Tuning Set12-1812.3Managing SQL Profiles12-1912.4Managing SQL Plan Baselines12-2012.4.1Capturing SQL Plan Baselines Automatically12-2112.4.2Loading SQL Plan Baselines Manually12-2112.4.3Evolving SQL Plans12-23Optimizing Data Access Paths13.1Running SQL Access Advisor13-113.1.1Selecting the Initial Options13-213.1.2Selecting the Workload Source13-313.1.2.1Using SQL Statements from the Cache13-313.1.2.2Using an Existing SQL Tuning Set13-413.1.2.3Using a Hypothetical Workload13-413.1.3Applying Filter Options13-513.1.3.1Defining Filters for Resource Consumption13-613.1.3.2Defining Filters for Users13-613.1.3.3Defining Filters for Tables13-713.1.3.4Defining Filters for SQL Text13-713.1.3.5Defining Filters for Modules13-713.1.3.6Defining Filters for Actions13-813.1.4Specifying Recommendation Options13-813.1.5Specifying Task and Scheduling Options13.2Reviewing the SQL Access Advisor Recommendations13-1013-1413.2.1Reviewing the SQL Access Advisor Recommendations: Summary13-1513.2.2Reviewing the SQL Access Advisor Recommendations:Recommendations13-17Reviewing the SQL Access Advisor Recommendations: SQLStatements13-20Reviewing the SQL Access Advisor Recommendations: Details13-2113.2.313.2.4viii
13.3Implementing the SQL Access Advisor Recommendations13-22Indexix
PrefacePrefaceThis preface contains the following topics: Audience Documentation Accessibility Related Documents ConventionsAudienceThis guide is intended for Oracle database administrators (DBAs) who want to tuneand optimize the performance of Oracle Database. Before using this document, youshould be familiar with Oracle Database administration.In particular, this guide is targeted toward the following groups of users: Oracle DBAs who want to acquire database performance tuning skills DBAs who are new to Oracle DatabaseSee Also: Oracle Database Administrator's Guide for more information aboutdatabase administrationDocumentation AccessibilityFor information about Oracle's commitment to accessibility, visit the OracleAccessibility Program website at http://www.oracle.com/pls/topic/lookup?ctx acc&id docacc.Access to Oracle SupportOracle customers that have purchased support have access to electronic supportthrough My Oracle Support. For information, visit http://www.oracle.com/pls/topic/lookup?ctx acc&id info or visit http://www.oracle.com/pls/topic/lookup?ctx acc&id trsif you are hearing impaired.x
PrefaceRelated DocumentsFor more information about the topics covered in this document, see the followingdocuments: Oracle Database Administrator's Guide Oracle Database Concepts Oracle Database Performance Tuning Guide Oracle Database SQL Tuning GuideConventionsThe following conventions are used in this document:ConventionMeaningboldfaceBoldface type indicates graphical user interface elements associatedwith an action, or terms defined in text or the glossary.italicItalic type indicates book titles, emphasis, or placeholder variables forwhich you supply particular values.monospaceMonospace type indicates commands within a paragraph, URLs, codein examples, text that appears on the screen, or text that you enter.xi
Changes in This Release for Oracle Database 2 Day Performance Tuning GuideChanges in This Release for OracleDatabase 2 Day Performance TuningGuideThis preface contains: Changes in Oracle Database 12c Release 2 (12.2.0.1) Changes in Oracle Database 12c Release 1 (12.1.0.2) Changes in Oracle Database 12c Release 1 (12.1.0.1)Changes in Oracle Database 12c Release 2 (12.2.0.1)There are no changes in Oracle Database 2 Day Performance Tuning Guide forOracle Database 12c Release 2 (12.2.0.1). For the Oracle Database performancerelated features that are new in this release, see Oracle Database PerformanceTuning Guide.Changes in Oracle Database 12c Release 1 (12.1.0.2)The following are changes in Oracle Database 2 Day Performance Tuning Guide forOracle Database 12c Release 1 (12.1.0.2).New FeaturesThe following features are new in this release: Manageability support for In-Memory Column StoreThe new Oracle Database In-Memory Column Store (IM column store) featureaccelerates database performance of analytics, data warehousing, and onlinetransaction processing (OLTP) applications.SQL Monitor report, ASH report, and AWR report now show statistics for variousin-memory operations.–In-memory statistics in SQL Monitor report: Activity % in Time and WaitStatistics panel, Activity column in Plan Statistics table, and Activity tab in SQLMonitor report show CPU consumed by SQL commands while executing inmemory query operations. SQL Monitor report now supports Adaptive plans.The Execution plan shows Resolving or Resolved icon depending upon thecurrent status of that plan. The Plan Statistics tab contains a drop down list toshow current plan, final plan, and full plan. It also contains Plan Note button,which when clicked, shows the notes that are generated in the explain plan forthe SQL statement.xii
Changes in This Release for Oracle Database 2 Day Performance Tuning Guide–In-memory statistics in ASH report: ASH report header table shows the size ofin-memory pool under In Memory Area column. Top Events, Top SQL, andActivity Over Time sections show CPU consumption by various in-memoryoperations.–In-memory statistics in AWR report: AWR report contains a new section - InMemory Segments Statistics - that shows in-memory segment consumptionbased on various attributes, such as, scans, DB block changes, populate CUs,and repopulate CUs. Time Model Statistics section shows statistics related toin-memory CPU usage and Instance Activity Statistics section shows statisticsrelated to in-memory activities.Other ChangesThe following are additional changes in the release: Changes in ASH Analytics pageIn the Average Active Sessions chart on ASH analytics page, you can now click onCPU wait class to see its breakdown by CPU usage based on various in-memoryoperations as well as total CPU used for operations other than in-memoryoperations.See "Determining the Cause of Spikes in Database Activity" for more information.Changes in Oracle Database 12c Release 1 (12.1.0.1)The following are changes in Oracle Database 2 Day Performance Tuning Guide forOracle Database 12c Release 1 (12.1.0.1).New FeaturesThe following features are new in this release: Real-time database operations monitoringReal-Time database operations monitoring tracks and reports on active andrecently completed database operations. You can monitor details of the executionof a single SQL or PL/SQL statement. You can also monitor the progress of longrunning operations such as a batch job, or extract, transform, and load (ETL)processing.See "Monitoring Real-Time Database Operations " for information on this feature.Desupported FeaturesOracle Enterprise Manager Database Control is no longer supported by Oracle.Other ChangesThe following are additional changes in the release: Oracle Enterprise Manager Cloud ControlIn previous releases of Oracle Database, you used Oracle Enterprise ManagerDatabase Control (Database Control) to manage database performance tuningxiii
Changes in This Release for Oracle Database 2 Day Performance Tuning Guidefrom a graphical user interface. In this release, you can use the Oracle EnterpriseManager Cloud Control (Cloud Control) graphical user interface. Cloud Controlprovides more functionality than Database Control. The procedures in this guideuse Cloud Control.You must install Cloud Control separately from Oracle Database.See Also:Oracle Enterprise Manager Cloud Control Basic Installation Guide ASH Analytics pageCloud Control has the ASH Analytics page, which graphically displays recentActive Session History information.See "Determining the Cause of Spikes in Database Activity" for more information. Real-Time ADDMCloud Control has the Real-Time ADDM page, from which you can run automaticdatabase diagnostic monitoring in real time to diagnose problems with a slow orhung database.See "Diagnosing Serious Performance Problems in Real Time" for moreinformation.xiv
Part IGetting StartedPart I provides an introduction to this guide and explains the Oracle Databaseperformance method. This part contains the following chapters: Introduction Oracle Database Performance Method
1IntroductionAs an Oracle database administrator (DBA), you are responsible for the performanceof your Oracle database. Tuning a database to reach a desirable performance levelmay be a daunting task, especially for DBAs who are new to Oracle Database. OracleDatabase 2 Day Performance Tuning Guide is a quick start guide that describes howto perform day-to-day database performance tuning tasks using features provided byOracle Diagnostics Pack, Oracle Tuning Pack, and Oracle Enterprise Manager CloudControl (Cloud Control).This chapter contains the following sections: About This Guide Common Oracle DBA Tasks Tools for Tuning the Database Accessing the Database Home Page1.1 About This GuideBefore using this guide, you must do the following: Be familiar with Oracle Database administration. See Oracle DatabaseAdministrator's Guide for more information. Obtain the necessary products and tools described in "Tools for Tuning theDatabase".Oracle Database 2 Day Performance Tuning Guide is task-oriented. The objective isto describe why and when tuning tasks need to be performed.This guide is not an exhaustive discussion of all Oracle Database concepts. For thattype of information, see Oracle Database Concepts.This guide does not describe basic Oracle Database administrative tasks. For thattype of information, see Oracle Database Administrator's Guide.The primary interface used in this guide is the Enterprise Manager Cloud Controlconsole. This guide is not an exhaustive discussion of all Oracle Databaseperformance tuning features. It does not cover available application programminginterfaces (APIs) that provide comparable tuning options to those presented in thisguide. For this type of information, see Oracle Database Performance Tuning Guideand Oracle Database SQL Tuning Guide.1.2 Common Oracle DBA TasksAs an Oracle DBA, you can expect to be involved in the following tasks: Installing Oracle software Creating Oracle databases1-1
Chapter 1Tools for Tuning the Database Upgrading the database software to new releases Starting up and shutting down the database Managing the storage structures of the database Managing user accounts and security Managing schema objects, such as tables, indexes, and views Making database backups and performing database recovery, when necessary Monitoring proactively the condition of the database and taking preventive orcorrective actions, as required Monitoring and tuning database performanceThis guide describes how to accomplish the last two tasks in the preceding list.1.3 Tools for Tuning the DatabaseThe intent of this guide is to allow you to quickly and efficiently tune and optimize theperformance of Oracle Database.To achieve the goals of this guide, you must acquire the following products, tools,features, and utilities: Oracle Database 12c Release 2 (12.2) Enterprise EditionOracle Database offers enterprise-class performance, scalability and reliability onclustered and single-server configurations. It includes many performance featuresthat are used in this guide. Oracle Enterprise Manager Cloud ControlThe primary tool to manage the database is Enterprise Manager Cloud Control(Cloud Control), a web-based interface. After you install the Oracle software,create or upgrade a database, and configure the network, you can use CloudControl to manage the database. In addition, Cloud Control provides an interfacefor performance advisors and for database utilities, such as SQL*Loader andRecovery Manager (RMAN). Oracle Diagnostics PackOracle Diagnostics Pack offers a complete, cost-effective, and easy-to-usesolution to manage the performance of Oracle Database environments byproviding unique features, such as automatic identification of performancebottlenecks, guided problem resolution, and comprehensive system monitoring.Key features of Oracle Diagnostics Pack used in this guide include AutomaticWorkload Repository (AWR), Automatic Database Diagnostic Monitor (ADDM),and Active Session History (ASH). Oracle Tuning PackOracle Tuning Pack automates the database application tuning process, therebysignificantly lowering database management costs while enhancing performanceand reliability. Key features of Oracle Tuning Pack that are used in this guideinclude the following:–SQL Tuning AdvisorThis feature enables you to submit one or more SQL statements as input andreceive output in the form of specific advice or recommendations for how to1-2
Chapter 1Accessing the Database Home Pagetune statements, along with a rationale for each recommendation and itsexpected benefit. A recommendation relates to collection of statistics onobjects, creation of new indexes, restructuring of the SQL statements, orcreation of SQL profiles.–SQL Access AdvisorThis feature enables you to optimize data access paths of SQL queries byrecommending the proper set of materialized views and view logs, indexes,and partitions for a given SQL workload. Oracle Real Application TestingOracle Real Application Testing consists of the following key features:–Database ReplayThis feature enables you to capture the database workload on a productionsystem, and replay it on a test system with the exact same timing andconcurrency as the production system on the same or later release of OracleDatabase.–SQL Performance AnalyzerThis feature enables you to assess the effect of system changes on SQLperformance by identifying SQL statements that have regressed, improved, orremained unchanged.See Also:Oracle Database Testing Guide for information about how to use the featuresDatabase Replay and SQL Performance AnalyzerNote:Some of the products and tools in the preceding list, including OracleDiagnostics Pack and Oracle Tuning Pack, require separate licenses. Formore information, see Oracle Database Licensing Information.1.4 Accessing the Database Home PageThe Database Home page is the main database management page in OracleEnterprise Manager Cloud Control (Cloud Control). After you log in to Cloud Control,you navigate to the Database Home page for the target database you want to managein Cloud Control.To access the Database Home page in Cloud Control:1.Start Cloud Control.The URL for accessing Cloud Control has the following syntax:http://hostname.domain:portnumber/em1-3
Chapter 1Accessing the Database Home Page2.In the Welcome page, enter your Cloud Control user name and password, andthen click Login.3.From the Targets menu, select Databases.The Databases page appears.4.In the Databases page, select Search List to display a list of the available targetdatabases.5.In the Name column, select the target database that you want to observe ormodify.The home page for the target database appears. The first time that you select anoption from some of the menus, such as the Performance menu, the DatabaseLogin page appears.6.In the login page for the target database, log in as a user with the appropriateprivileges. For example, to log in as user SYS with the SYSDBA privilege: User Name: Enter SYS. Password: Enter the password for the SYS user. Connect As: From the Role list, select SYSDBA.1-4
2Oracle Database Performance MethodPerformance improvement is an iterative process. Removing the first bottleneck (apoint where resource contention is highest) may not lead to performance improvementimmediately because another bottleneck might be revealed that has an even greaterperformance impact on the system. Accurately diagnosing the performance problem isthe first step toward ensuring that your changes improve performance.Typically, performance problems result from a lack of throughput (the amount of workthat can be completed in a specified time), unacceptable user or job response time(the time to complete a specified workload), or both. The problem might be localized tospecific application modules or it might span the system.Before looking at database or operating system statistics, it is crucial to get feedbackfrom the system users and the people in charge of the application. This feedbackmakes it easier to set performance goals. Improved performance can be measured interms of business goals rather than system statistics.The Oracle performance method can be applied until performance goals are met ordeemed impractical. Because this process is iterative, some investigations may havelittle impact on system performance. It takes time and experience to accuratelypinpoint critical bottlenecks quickly. Automatic Database Diagnostic Monitor (ADDM)implements the Oracle performance method and analyzes statistics to provideautomatic diagnosis of major performance problems. Because ADDM can significantlyshorten the time required to improve the performance of a system, it is the methodused in this guide.This chapter discusses the Oracle Database performance method and contains thefollowing sections: Gathering Database Statistics Using the Automatic Workload Repository Using the Oracle Performance Method Common Performance Problems Found in Databases2.1 Gathering Database Statistics Using the AutomaticWorkload RepositoryDatabase statistics provide information about the type of load on the database and theinternal and external resources used by the database. To accurately diagnoseperformance problems with the database using ADDM, statistics must be available.A cumulative statistic is a count such as the number of block reads. OracleDatabase generates many types of cumulative statistics for the system, sessions, andindividual SQL statements. Oracle Database also tracks cumulative statistics aboutsegments and services. Automatic Workload Repository (AWR) automates databasestatistics gathering by collecting, processing, and maintaining performance statisticsfor database problem detection and self-tuning purposes.2-1
Chapter 2Gathering Database Statistics Using the Automatic Workload RepositoryBy default, the database gathers statistics every hour and creates an AWR snapshot,which is a set of data for a specific time that is used for performance comparisons. Thedelta values captured by the snapshot represent the changes for each statistic overthe time period. Statistics gathered by AWR are queried from memory. The gathereddata can be displayed in both reports and views.The following initialization parameters are relevant for AWR: STATISTICS LEVELSet this parameter to TYPICAL (default) or ALL to enable statistics gathering byAWR. Setting STATISTICS LEVEL to BASIC disables many database features,including AWR, and is not recommended. CONTROL MANAGEMENT PACK ACCESSSet to DIAGNOSTIC TUNING (default) or DIAGNOSTIC to enable automatic databasediagnostic monitoring. Setting CONTROL MANAGEMENT PACK ACCESS to NONE disablesmany database features, including ADDM, and is strongly discouraged.See Also: Oracle Database Reference for more information about theSTATISTICS LEVEL initialization parameter Oracle Database Reference for mo
2.2.2 Tuning the Database Proactively 2-7 2.2.3 Tuning the Database Reactively 2-7 2.2.4 Tuning SQL Statements 2-8 2.3 Common Performance Problems Found in Databases 2-8 Part II Proactive Database Tuning 3 Automatic Database Performance Monitoring 3.1 Overview of Automatic Database Diagnostic Monitor 3-1 3.1.1 ADDM Analysis 3-2


![Welcome [dashdiet.me]](/img/17/30-day-weight-loss-journal.jpg)
