Transcription
fac r d7:3 (I 996): 265.-273in The NetherlandsCustomer Satisfaction and Price ToleranceEUGENEW. ANDERSON(ReceivedS-10-95Key ensitivity,industrialorganizationAbstractThis study investigatesthe associationbetween customer satisfactionand willingness-to-payor price tolerance,The goal is not only to determine whether the associationbetween customer satisfactionand price tolerance ispositive or negative but also to gauge the degree of association.The Swedish CustomerSatisfactionBarometerprovides the data. The empirical analysis indicates a negative associationbetween the level of customer satisfaction provided by the firm and the degree of price tolerance exhibited by its customers. However, a positive association is found between year-to-yearchnnges in the levels of customer satisfactionand price tolerance.To what extent does improving customer satisfaction increase customer willingness-to-pay orprice tolerance and consequently, decrease price sensitivity? The goal of this study is to investigate whether the association between satisfaction and price tolerance is positive or negative,as well as to gauge the degree of association between these two important constructs. Addingto our understanding of the different ways increasing customer satisfaction can benefit thefirm is important to managers considering initiating or continuing such efforts, as well as toresearchers interested in developing theory in the area. This is particularly true in the case ofprice tolerance, as it has not received the degree of attention paid other consequences of satisfaction, such as repurchase intentions (Anderson and Fornell, 1993).1. Customer satisfaction and price toleranceCustomer satisfaction is a post hoc evaluation of consumption experience (Oliver, 1980).A customer satisfaction evaluation can be quite specific in nature-a specific subset ofexperience such as a single transaction and/or particular attribute-but may also be cumulative, based on all previous experience with a good or service (Anderson and Fornell,1993). As the purpose of this study is to investigate buyers’ price tolerance-the maximumprice increased satisfied customers are willing to pay or tolerate before switching-itseems natural to focus on cumulative customer satisfaction. Cumulative customer satisfaction, as opposed to satisfaction with a specific transaction or product attribute, shouldprovide a more accurate depiction of the net or marginal value customers attach to futureconsumption of a good or service.
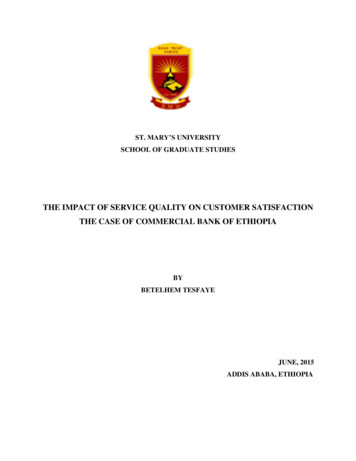
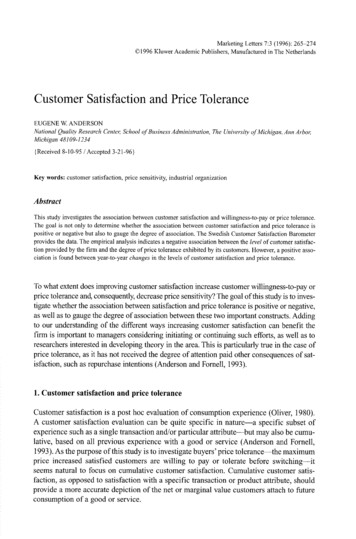
266EUGENEW. ANDERSONPrice tolerance is closely related to the concept of consumer surplus: “the excess of theprice which a man would be willing to pay rather than go without having a thing over whathe actually does pay is the economic measure of his satisfaction surplus” (Marshall, 1890).Consequently, we might expect customers to have greater price tolerance for products providing greater satisfaction. This would seem to be a fundamental tenet of rational economic behavior.To illustrate, consider the classical depiction of the relationship between price anddemand presented in Figures 1a and 1b. As the level customer satisfaction provided by thefirm increases, price tolerance should increase. As the price tolerance of each individualincreases, the demand curve depicted in Figure la should move upward and outward asshown in Figure lb.However, while the hypothesis that an increase customer satisfaction should lead to anincrease in price tolerance seems intuitive at first glance, vmsproviding higher customersati?faction will not necessarily have customers with greater price tolerance. To see this,consider that although customer satisfaction is found to be higher for firms in more competitive categories (Anderson, 1994), price tolerance may actually be lower as the qualityof the “next best” alternative is likely to be more attractive than would be the case in lesscompetitive categories.2. MethodologicalapproachTo investigate the direction and degree of association between customer satisfaction andprice tolerance, we posit the following expression for the relationship:Pq.t o! p(cS,,) qj E&(1)wherePTi, Price tolerance of firm i’s customers at time t,CS,, Customer Satisfaction for firm i’s customers at time eF@rela. Consumerlb. Consumerdemanddemandprior to an increase in customer satisfaction.followingan increase in customer satisfaction
CUSTOMERSATISFACTIONANDPRICETOLERANCE267ty constant,p slope coefficient,qi unobserved fixed factors (e.g., firm or industry characteristics),&,, @5 1 tlir autoregressive and random unobserved factors.The basic linear form of equation (1) is consistent with Bass’s (1993) recommendationof describing simply an expected pattern or relationship. However, it must also be recognized that there are a host of factors in addition to customer satisfaction that may be associated with price tolerance (e.g., firm and industry characteristics). Equation ( I) explicitly acknowledges the possible existence of these factors as unobserved fixed, autoregressive, and random effects.Failure to control for unobservable factors can lead to violations of the assumptionsof OLS when estimating specifications such as (1) using cross-sectional-tile seriesdata. In particular, measurement error and random environmental shocks may createcorrelation between the residual and the independent variables. Omitted factorscorrelated with both the dependent and independent variables may also lead to biasedestimates. Generally, the degree of bias will depend on the type of problem beingstudied. For example, even if the correlation between the residual and a regressor islarge, the resulting bias will be small if the error variance is small relative to thesystematic variance in the model (i.e., plim 8 /3 p,, (a, / a,). However, this is notthe case for many marketing phenomena.To control for potential bias due to each type of omitted effect, equation (1) must be ansformed. First, if there are unobservable firm-specific, fixed effects, /Z, first-di crencing JJ -JJ,I 1, can be employed as a means of coll rolling for such omitted variables(Maddala, 1977):PT,, - PT& , p(cs,, - cs,, 1) r,,- Ej,- ,.(2)Second, omitted factors can also give rise to serial correlation between the residuals.Factors that might give rise to serial correlation include accounting practices, l anagementskills, pioneering advantage, and luck. To control for potential bias from autoregressivefactors, equation (2) can be P-difference4 pan t , yieldingFinally, a common approach to controlling for potential sources of measurement errorand random effects (e.g., contemporaneous shocks) is the use of instrumental variables.Instrumental variables have the advantage of reducing bias, but the disadvantage ofincreasing the variance of an estimate. An ideal instrumental variable is one that isuncorrelated with the residual, yet highly correlated with the independent variable. Thecentral issue in choosing an ins nental variable is to determine where to find such avariable. A common solution to this problem is to choose past values of the independentvariables lagged at least one period beyond the error term. As instrumenting removes
268EUGENEW. ANDERSONfirnl-specific random effects but not those affecting the entire sample, we control forunobservable period-specific factors (such as economywide factors) by incIuding annual dummy variables.3. Description of the dataThe Swedish Customer Satisfaction 3arometer (SCSB) provides data on both customersatisfaction and price tolerance useful for estimating each of the preceding specifications.The SCSB provides coverage of a major portion of the Swedish economy (Fornell, 1992).’As such it includes not only packaged, nondurable goods (a relatively small portion of theeconomy) but also a wide variety of l ufac ed durable goods and retailers, as well asmany different types of services. The firms included in the database study represent majorcompetitors in a wide variety of industries: Airlines, automobiles, banking (consumer andbusiness), charter travel, clothing retail, department stores, furniture stores, gas stations,insurance (life, auto, and business), mainframe computers (business), PCs (business),newspapers, shipping (business), and supermarkets. The companies surveyed in eachindustry are the largest share firms such that cumulative share is approximately 70 percent.The data on each firm are collected via a computer-assisted telephone survey that isnational in scope. Respondents are screened on the basis of whether they are customers offirms included in the SCSB. The ensuing interview-whichincludes questions that rangefrom the antecedents of satisfaction (such as expectations, perceived quality) to the consequences of satisfaction (word-of mouth, complaining behavior)-average eight minutesin length.The survey instrument and approach have been continually tested and refined.Extensive pretesting of questions for each product category is conducted. Once collected,the data provide the basis for measuring key constructs of interest, including an index representing each firm’s level of customer satisfaction, CS, The indices are generated usinga latent variable methodology described by Fornell (1992). Each index represents aweighted average based on the weights obtained from the latent variable estimation. Asdiscussed by Fornell (1992), the observed reliability and validity of the obtained indicesis high. These satisfaction indices have proven to be well predicted by appropriateantecedents and perform favorably as predictors of presumable consequences such as loyalty and profitability (Anderson, Fornell, and Lehmann, 1994; Fornell, 1992; Johnson,Anderson, and Fornell, 1995; Johnson and Fornell, 1993).As a basis for measuring price tolerance, respondents are asked for the relative priceincrease they would be willing to tolerate before switching: “If other brands remain atraise its price before you would not choosethe same prices, how much canthe next time you buy?” Respondents provide an answer in percentanotherage terms. Providing a response in percentage-ratherthan absolute--terms helpsaddress concerns about comparing price tolerance across industries. This approach isalso consistent with Pessemier’s (I 959) suggested measure of brand loyalty as the minimum increase customers are willing to tolerate before switching. Although it has been
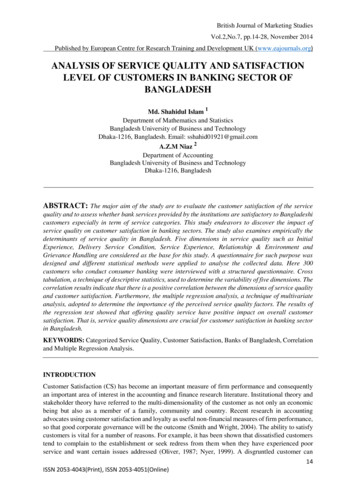
CUSTOMERSATISFACTIONANDPRICETOLERANCE269argued that identifying price tolerance for untried products may be difficult (Morrison,1979), the focus of SCSB is on customer’s perceptions of the price increase they willtolerate for ctn tl’yused products. As Olson and Jacoby (197 1) find that this measuretakes into account both attitudinal and behavioral components of brand loyalty-and hashigh reliability as a repeated measured-the construct validity of this measure should behigh.The price tolerance variable has not been extensively examined in previous studies usingSCSB data, apart from summary information on the customer satisfaction-price tolerancerelationship provided by Fornell (1992). In estimating a linear relationship between customer satisfaction and loyalty at the individual level-price tolerance is one of severalmultiple indicators of the latter construct-for each firm, Fornell (1992) reports an overall positive relationship, as might be expected. This study extends the investigation to theeffect of the overall level of customer satisfaction provided by the firm on the overall levelof price tolerance enjoyed by the firm’s customers. For the analysis, the price tolerancevariable is averaged over the respondents for each firm to obtain an average for eachfirms’ buyers, PTi,In terms of sample size, the SCSB collects approximately 200 individual-level observations per firm per year (this number can be lower for business-to-business categories).There are 62 firms from 1989, 8 1 firms from 1990, 87 firms from 1991 and 1992, 92firms from 1993, and 94 firms from 1994, for a total of 503 firm-level observations. Thetotal number of individual observations for the 503 firms in the analysis is 102,271. Thesample for the current study includes ail firms for which the SCSB collected customer satisfaction and price tolerance data for at least four consecutive years during the periodspanning the years I989 through 1994. The four-year requirement is imposed due to themethodological transformations described below. The final number of observations available for analysis is 475.4. FindingsThe empirical findings concerning the association between customer satisfaction andprice tolerance difTer depending on the degree to which the empirical analysis controls forunobservable factors. Table 1 summarizes the results of estimating the relationship asspecified by (1) equation (1)-the simple linear specification wherein no effort is made tocontrol for unobservable factors, (2) equation (2 ontrolsfor fixed unobservable factorsvia first-differencing, and (3) equation (3)-controls for fixed and autoregressive unobservable factors via first-differencing in conjunction with p-differencing. To illustrate theeffect of controlling for random unobservable factors, each equations is estimated bothwith and without the use of inst men l variables lagged one period beyond the error term(t 1 for equation (1) and t -- 2 for equations (2) and (3)).The estimation results for equation (1) do not support the intuitive hypothesis of a positive association between customer satisfaction and price tolerance. Whether or not instrumental variables are used to control for unobserved random effects, the estimated coefficient is negative and significant. While this finding is likely due to lack of control for
270TubkEUGENEI. Summaryof the empiricalWithontEq. ciationbetweenprice tolerance,Ins mental-. -“.-.----- Variables‘Eq. G9Eq. (3)0.12*-0.13--0.220.030.48’1.02*1i391.626.01 388PT, and satisfaction,WithNote: Eq. (1): PT,, LY p(CS,J vi Gil .Eq. (2): PT,, - Hit l p( Cs,, - Cs,, ,) Gil - ajt . ,Eq. (3): PTi, -. PTj, , ,Q(P1;:, , - PTj, - 2)C&f- ) Ujf- uj ,.*Indicates p 0.0 1.**Indicatesp 0.10.16.11*-0.12x0.08*394 InstrumentalEq. (2)0.410.52oso *1.79 3359.447.243*4.07302CS.Eq. (1)0.04**-4.090.090.37”1.189526.1312.88”W. ANDERSONP((CSif-VariablesEq. (3)0.06**4.49”--0.14I .07*510.6011.62”0 .-?6**1.05”162.3021.55”2170.05131CSi, - 1) -P(CSj,-junobservable effects (Hausman’s specification test to determine whether omitted variablesare a problem is significant at H 5.53*), it nevertheless serves to highlight the distinctnature of customer satisfaction and price tolerance as to two related-but clearly not identical-const cts. If the two constructs were identical or nearly so, then one would expectthe observed association between the two to be unaffected by efforts to control for omitted factors. Hence, the association between customer satisfaction and price tolerance ismore interesting than might be suspected without looking beyond the obvious or expected positive relationship between the two.When steps are taken to control for unobserved fixed and autoregressive effects, how ever, the findings do suggest support for the intuitive hypothesis. As shown in Table 1, theestimated co i ient for satisfaction is positive and si ificant for equations (2) and (3)whether or not instrumental variables are included. Using Hausman’s specification test toselect the best model reveals that equation (3) does not provide a significant improvementover equation (2) in either case, indicating that autoregressive effects should not be a concern (H 0.34 and H 1.01). The relatively small estimate for the autoregressiv parameter is also insignificant in both cases. However, Hausman’s test does favor the use ofinstrumental variables in equation (2) (N I 3.3 1**). Hence, the appropriate estimate of theassociation between satisfaction and price tolerance, based on the instrumental variableversion of Equation (2), is 0.08.Given the sample’s mean levels of customer satisfaction (65.57) and price tolerance(8.75), the estimated coefficient of 0.08 implies an elasticity of 0.60. This suggests that inincreasing customer satisfaction by 1 percent, firms increase the marginal value of theirproduct relative to alternatives by six-tenths of I percent (0.60). This association betweena change in customer satisfaction and a change in price tolerance suggests, in turn, that
CUSTOMERSATISFACTIONANDPRICETOLERANCE271increases in customer satisfaction should also be associated with reduced price elasticityof demand.Hence, once the influence of unobservables is accounted for, the expected positiveassociation between customer satisfaction and price tolerance emerges. In part, this maybe due to the differential effects that industry characteristics have on the two constructs.Regardless of the source, when steps are taken to enable the empirical analysis to focuson within firm changes in customer satisfaction and price tolerance, the intuitive resultholds.Finally, a peripheral-but potentially interesting-aspect of the empirical analysis is thepattern exhibited by the coefficients for the annual dummy variables.2 The rising levels ofthe coefficient in each subsequent year likely reflects the improving Swedish economy asit emerges from the recessionary period of the late 1980s and early 1990s. At the sametime that the economy is improving, price tolerance appears to be increasing.5. A peek at au unobservable: competitivenessIf equation (1) is biased by lack of control for unobservable fixed effects, then what factors might account for the difference in sign from the coefficients found in estimatingequations (2) and (3)‘ One possibility is that there is systematic variation in the levelsof customer satisfaction and price tolerance due to industrial organization characteristics such as competitiveness. As competition in an industry increases, firms providegreater customer satisfaction as they compete to attract and retain customers (Anderson,1994; Fornell, 1992). IIowever, increasing competition may actually lower price tolerance. Put simply, as the availability of attractive alternatives increases, the maximumprice increase buyers will tolerate before switching should fall. At the same time, lowerprice tolerance may, in turn, encourage firms to increase customer satisfaction in orderto retain their customers. Conversely, customer satisfaction may be lower when there isless competition, yet price tolerance may be high due to lack of alternatives and/orswitching costs.To further explore the possibility that competition is one of the underlying factors leading to a spurious negative association between levels of customer satisfaction and pricetolerance, it seems reasonable to include a measure of competition in equation (I).Competitiveness, as measured by degree of concentration, may affect the level of satisfaction in an industry, as well as the irnpo lce of the various antecedents. Cow eoncentration (greater competition) should be associated with greater effort to satisfy customersand hence, greater customer satisfaction. A proxy for the degree of concentration, CONC,is generated by taking the inverse of the number of competitors comprising 70 percent ofthe sales in each respective industry. Anderson (1994) employs this measure in findingthat higher concentration levels are associated with lower quality and, therefore, lower customer satisfaction.Including the concentration measure as an independent variable in equation (1 )--withinstrumental variables-yields (standard errors are given in parentheses and an asteriskindicates p-value less than 0.10):
272EUGENEIV. ANDERSONPTi, -12.71 - 0.08*CSi, 2.95”CONC-t 0.49D91 0.57D92 f 0.87*093 -t 1.89*D94(2.13)(0.03)SSE 3232.38(0.76)(0.49)(0.49)(0.49)(0.50)F;, 8.80Hence, there is a significant and positive association between the level of concentration in a category and the level of price tolerance. This implies that, in terms of competition, lower price tolerance is associated with greater competition. However, the findings do indicate the association between the level of customer satisfaction and the levelof price tolerance remains negative, indicating other factors-and possibly better measures of competitiveness-maybe needed to explain the observed association betweenthe two.5. DiscussionThis article examines the relationship between customer satisfaction and price tolerancethe maximum price increase satisfied customers are willing to pay or tolerate beforeswitching. The study finds a positive association between changes in customer satisfactionand changes in price tolerance but a negative association between the level of customersatisfaction and the level of price tolerance.From the perspective of the firm, the findings imply that increasing customer satisfaction is likely to decrease price elasticity of demand. In particular, the findings imply a 1percent increase in customer satisfaction should be associated with a 0.60 percentdecrease in price sensitivity. Firms considering whether to pursue improvements in customer satisfaction-andin an increasing number of situations whether to curtail suchefforts--------shouldconsider the financial benefits of improving satisfaction as a consequence of customers’ increased willingness to tolerate price increases. As price tolerancealso provides an important indicator of loyalty, firms interested in assessing the longterm benefits of customer satisfaction should consider using price tolerance measuresalong with more traditional measures of loyalty, such as repurchase intentions and willingness to recommend.The findings also indicate that greater competi veness in an industry is associated withlower price tolerance and therefore greater price sensitivity. At the same time, greater competitiveness is associated with higher levels of customer satisfaction. As the two constructsdiffer in how each varies with the level of competitiveness, this suggests not only that thetwo constructs are different but that the relationship between the two is not a simple, positive, and monotonic one. Rather, this finding seems quite reasonable in that it indicatesboth price and quality are of heightened importance in more competitive industries.Within a particular industry, however, one might expect price sensitivity to decrease ascustomer satisfaction increases, as suggested by the findings when steps are taken to control for unobservable differences in industry characteristics.There are several potential avenues for future research addressing issues beyond thescope of the current article. First, there is room for empirical work aimed at developing a
CUSTOMERSATISFACTIONANDPRICETOLERANCE273better understanding for how both customer satisfaction and price tolerance vary acrosscategories due to industrial organization factors such as the degree of competition. Theempirical analysis for the case in which there are no explicit controls for unobservable factors suggests not only that customer satisfaction and price tolerance are distinct constructsworthy of such studies in their own right but that there is substantial unexplained variationthat may be systematic in nature.A second important direction for future research would be to replicate the current studyboth in the field and in the laboratory. For the latter, the tools of experimental economicsprovide an opportunity to replicate the findings in a controlled setting. Concerning the former, in a few years the U.S. version of the Swedish index-currently in its second year ofdata collection-willprovide a test of whether the Swedish findings generalize. Thismight be expected to be the case, given that previous studies suggest that empirical relationships observed based on satisfaction studies of Swedish consumers replicate quite wellin the United States (Anderson, 1995; Wikstrom, 1983).AcknowledgmentsThe author gratefully acknowledges the data provided through the funding of the SwedishPost and the support of both the National Quality Research Center at the University ofMichigan Business School and the International Center for Studies of Quality andProductivity at the Stockholm School of Economics. The author would also like to thankClaes Fornell and Michael D. Johnson for their valuable comments, as well as Jaesung Chafor his work in assembling the data set.Notes1. The SCSB is an ongoing project managed by the National Quality Research Center (NQRC)at the Universityof Michigan Business School and the InternationalCenter for Studies of Quality and Productivity(ICQP) atthe StockholmSchool of Economics,Fornell (1992) describes the SCSB in detail.2. Reassuringly,too, the substantiveimplicationsof the analysis do not change if the annual dummies areexcluded.ReferencesAnderson,Eugene W. (1994). “Cross-CategoryVariation in CustomerSatisfactionand Retention.”A4arketingLetters 5(l) (January),19-30.Anderson,Eugene W. (1995). “Word-of-Mouthas a Consequenceof CustomerSatisfaction.”WorkingPaper,National Quality Research Center, MichiganBusiness School.Anderson,Eugene W., and Claes Fornell. (1993). “A Customer SatisfactionResearch Prospectus.”In Richard L.Oliver and Roland T. Rust (Eds.), Service Quality:New Directionsin Theory and Practice(pp. 239-266).NewburyPark, CA: Sage.Anderson,Eugene W., Claes Fornell, and Donald R. Lehmann. (1994). “CustomerSatisfaction,Market Share,and Profitability.”Journal ofMarketing56 (July), 53-66.
274EUGENEW. ANDERSONBass, Frank M. (1993). “The Future of Research in Marketing:MarketingScience.” Journalof MarketingResearch 30(l) (February),l-6.Fomell, Claes. (1992). “A National CustomerSatisfactionBarometer:The Swedish Experience.”JournalojMarketing(January),l-2 1.Johnson, Michael D., Eugene W. Anderson,and Claes Fomell. (1995). “Rationaland Adaptive Expectationsin aCustomer SatisfactionFramework.”Journal of Consumev Research 21 (March), 6955707.Johnson, Michael D., and Claes Fornell. (199 1). “A Frameworkfor ComparingCustomerSatisfactionAcrossIndividualsand Product Categories.”Journal ofEconomicPsychology12(2), 267-286.Maddala, George S. (1977). Economehics.New York: McGraw-Hill.Marshall, Alfred. (1980). Principlesof Economics.London: McMillan.Morrison,Donald G. (1979). “PurchaseIntentions and Purchase Behavior.”Journal of Marketing43 (Spring),65-74.Oliver, Richard L. (1980). “A Cognitive Model of the Antecedentsand Consequencesof SatisfactionDecisions.”Jownal of MarketingResearch 17 (November),46&469.Olson, Jerry C., and Jacob Jacoby. (1971). “A Construct Validity Study of Brand Loyalty.”Proceedingsof the79th AmericanPsychologicalAssociationConference(pp. 657-658).Pessemier, Edgar A. (1959). “‘A New Way to DetermineBuying Decisions.”Journal of Marketing24 (October),4146.Wikstrom,Sloveig. (1983). “AnotherLook at ConsumerDissatisfactionas a Measure of Market Performance.”Journal of Consumer Policy 6, 19-35.
F@re lb. Consumer demand following an increase in customer satisfaction . nized that there are a host of factors in addition to customer satisfaction that may be asso- . mainframe computers (business), PCs (business), newspapers, shipping (business), and supermarkets. The companies surveyed in each industry are the largest share firms such .