Transcription
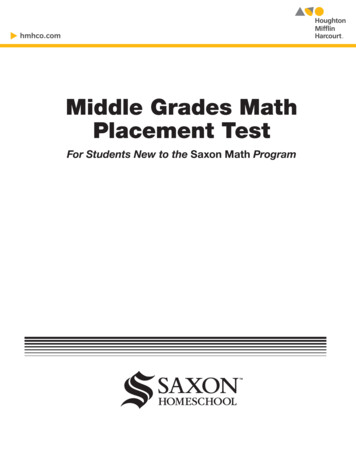
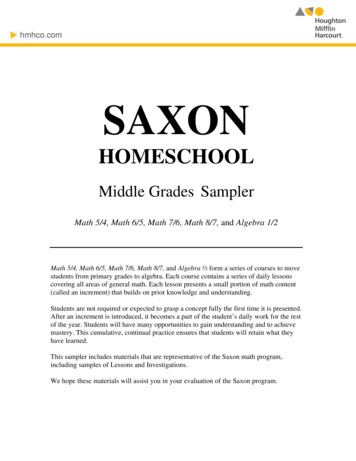
Grade 5 Math Content 1Number and Operations: Whole NumbersMultiplication and DivisionIn Grade 5, students consolidate their understanding of the computational strategies theyuse for multiplication. All students should be able to carry out strategies that involvebreaking one or both factors apart, multiplying each part of one factor by each part of theother factor, then combining the partial products. They also practice notating theirsolutions clearly. They use representations and story contexts to connect these strategies,which are based on the distributive property of multiplication, to the meaning ofmultiplication. As part of their study of multiplication, students analyze and comparemultiplication algorithms, including the U.S. algorithm for multiplication.Examples of Multiplication StrategiesBreaking numbers apart by addition148 x 42 148 x 42 40 x 100 4,000100 x 42 4,20040 x 40 1,60048 x 40 1,92040 x 8 32048 x 2 962 x 100 2004,200 1,920 96 6,2162 x 40 802 x 8 164,000 1,600 320 200 80 16 6,2161This document applies to the 2nd edition of Investigations (2008, 2012). Seehttp://investigations.terc.edu/CCSS/ for changes when implementing Investigations and theCommon Core Standards.4/5/07, v1 TERC, 20071
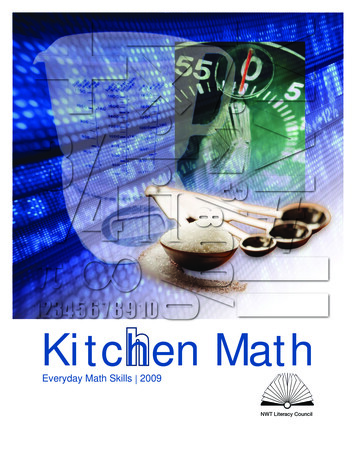
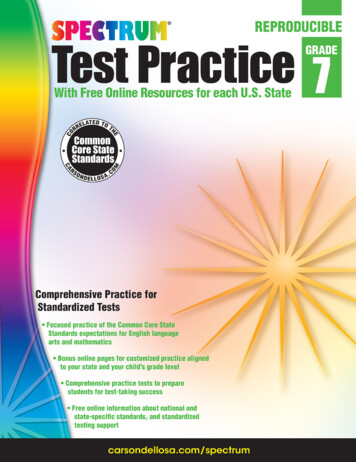
Changing one number to create an easier problem148 x 42 150 x 42 6,300 (100 x 42 1/2 of 100 x 42)2 x 42 846,300 – 84 6,216Students continue to learn ways to solve division problems fluently, focusing on therelationship between multiplication and division. They solve division problems byrelating them to missing factor problems (e.g., 462 21 and x 21 462), bybuilding up groups of the divisor, and by using multiples of 10 to solve problems moreefficiently. As students refine their computation strategies for division, they find ways touse what they already know and understand well (familiar factor pairs, multiples of 10s,relationships between numbers, etc.) to break apart the harder problems into easierproblems. They also work on notating their solutions clearly and concisely.Examples of clear and concise notationStudents also study underlying properties of numbers and operations and make andjustify general claims based on these properties. They study the relationship between anumber and its factors, which supports mental computation strategies for multiplicationand division with whole numbers. For example, students consider multiplicationexpressions related by place value (e.g., 3 x 6 18; 3 x 60 3 x 6 x 10 180), andequivalent multiplication expressions (e.g., 24 x 18 12 x 36 or 24 x 18 72 x 6). Thiswork includes finding longer and longer multiplication expressions for a number andconsidering the prime factorization of a number.10/10/12, v1 TERC, 20122
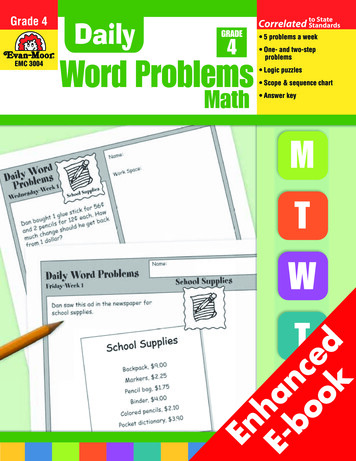
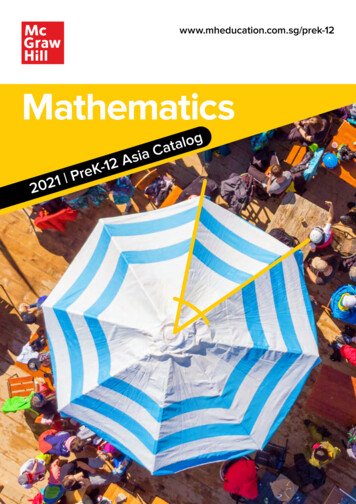
Students also investigate equivalent expressions in multiplication and division. Forexample, they investigate why doubling one factor and halving the other factor (ortripling and thirding, etc.) in a multiplication expression of the form a x b maintains thesame product. They also examine how and why the ratio between dividend and divisormust be maintained to generate equivalent division expressions. In this work, studentsdevelop mathematical arguments based on representations of the operations.Sample student workThe Algebra Connections pages in the two curriculum units that focus on multiplicationand division show how students are applying the commutative and distributive propertiesof multiplication, as well as the inverse relationship between multiplication and division,as they solve problems. These pages also highlight particular generalizations aboutmultiplication that students work on in Grade 5 as they create equivalent expressions formultiplication: If one factor in a multiplication expression is halved (or thirded) andanother factor is doubled (or tripled), what is the effect on the product?EmphasesWhole Number Operations Reasoning about numbers and their factors Understanding and using the relationship between multiplication and division tosolve division problems Representing the meaning of multiplication and division Reasoning about equivalent expressions in multiplication and division10/10/12, v1 TERC, 20123
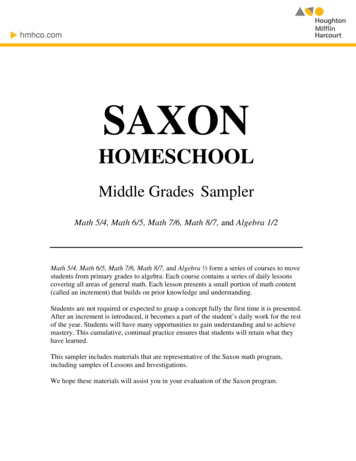
Computational Fluency Solving multiplication problems with 2-digit numbers Solving multiplication problems with 2- and 3-digit numbers Solving division problems with 2-digit divisorsBenchmarks Find the factors of a numberSolve multiplication problems efficientlySolve division problems with 1-digit and 2-digit divisorsExplain why doubling one factor in a multiplication expression (a x b) anddividing the other by 2 results in an equivalent expressionSolve division problems efficientlyAddition, Subtraction, and the Number SystemIn Grade 5, students extend their knowledge of the base ten number system, working withnumbers in the hundred thousands and beyond. In their place value work, students focuson adding and subtracting multiples of 100 and 1,000 to multi-digit numbers andexplaining the results. This work helps them develop reasonable estimates for sums anddifferences when solving problems with large numbers. Students apply theirunderstanding of addition to multi-step problems with large numbers. They developincreased fluency as they study a range of strategies and generalize the strategies theyunderstand to solve problems with very large numbers.90, 945 – 1,000 90,945 – 1,200 90,945 – 1,210 90,945 – 1,310 Students practice and refine their strategies for solving subtraction problems. They alsoclassify and analyze the logic of different strategies; they learn more about the operationof subtraction by thinking about how these strategies work. Students consider whichsubtraction problems can be solved easily by changing one of the numbers and thenadjusting the difference. As they discuss and analyze this approach, they visualizeimportant properties of subtraction. By revisiting the steps and notation of the U.S.algorithm for subtraction and comparing it to other algorithms, students think throughhow regrouping enables subtracting by place, with results that are all in positive numbers.10/10/12, v1 TERC, 20124
Examples of Subtraction StrategiesSubtracting in parts3,451 – 1,287 3,451 – 1,200 2,2512,251 – 80 2,1712,171 – 7 2,164Adding up3,451 – 1,287 1,287 13 13001,300 2,100 3,4003,400 51 3,45113 2,100 51 2,164Subtracting back3,451 – 1,287 3,451 – 51 3,4003,400 – 2,100 1,3001,300 – 13 1,28751 2,100 13 2,164Changing the numbers3,451 – 1,287 3,451 – 1,287 3,451 – 1,300 2,151(add 13 to both number to create an equivalent2,151 13 2,164problem)3,451 – 1,287 3,464 – 1300 2,164The Algebra Connections page in the curriculum unit that focuses on addition andsubtraction shows how students are applying the inverse relationship between additionand subtraction as they solve problems. It also highlights the algebraic ideas that underliethe generalizations students investigate and articulate when they create equivalentexpressions in order to solve a problem (e.g., 892 – 567 895 – 570).10/10/12, v1 TERC, 20125
EmphasesThe Base Ten Number System Extending knowledge of the base-ten number system to 100,000 and beyondComputational Fluency Adding and subtracting accurately and efficientlyWhole Number Operations Examining and using strategies for subtracting whole numbersBenchmarks Read, write, and sequence numbers to 100,000Solve subtraction problems accurately and efficiently, choosing from a variety ofstrategiesNumber and Operations:Rational NumbersThe major focus of the work on rational numbers in grade 5 is on understandingrelationships among fractions, decimals, and percents. Students make comparisons andidentify equivalent fractions, decimals, and percents, and they develop strategies foradding and subtracting fractions and decimals.In a study of fractions and percents, students work with halves, thirds, fourths, fifths,sixths, eighths, tenths, and twelfths. They develop strategies for finding percentequivalents for these fractions so that they are able to move back and forth easily betweenfractions and percents and choose what is most helpful in solving a particular problem,such as finding percentages or fractions of a group.10/10/12, v1 TERC, 20126
Students use their knowledge of fraction equivalents, fraction-percent equivalents, therelationship of fractions to landmarks such as ½, 1, and 2, and other relationships todecide which of two fractions is greater. They carry out addition and subtraction offractional amounts in ways that make sense to them by using representations such asrectangles, rotation on a clock, and the number line to visualize and reason about fractionequivalents and relationships.Students continue to develop their understanding of how decimal fractions representquantities less than 1 and extend their work with decimals to thousandths. Byrepresenting tenths, hundredths, and thousandths on rectangular grids, students learnabout the relationships among these numbers—for example, that one tenth is equivalent10/10/12, v1 TERC, 20127
to ten hundredths and one hundredth is equivalent to ten thousandths—and how thesenumbers extend the place value structure of tens that they understand from their workwith whole numbers.Students extend their knowledge of fraction-decimal equivalents by studying howfractions represent division and carrying out that division to find an equivalent decimal.They compare, order, and add decimal fractions (tenths, hundredths, and thousandths) bycarefully identifying the place value of the digits in each number and usingrepresentations to visualize the quantities represented by these numbers.10/10/12, v1 TERC, 20128
EmphasesRational Numbers Understanding the meaning of fractions and percents Comparing fractions Understanding the meaning of decimal fractions Comparing decimal fractionsComputation with Rational Numbers Adding and subtracting fractions Adding decimalsBenchmarks Use fraction-percent equivalents to solve problems about the percentage of aquantityOrder fractions with like and unlike denominatorsAdd fractions through reasoning about fraction equivalents and relationshipsRead, write, and interpret decimal fractions to thousandthsOrder decimals to the thousandthsAdd decimal fractions through reasoning about place value, equivalents, andrepresentations10/10/12, v1 TERC, 20129
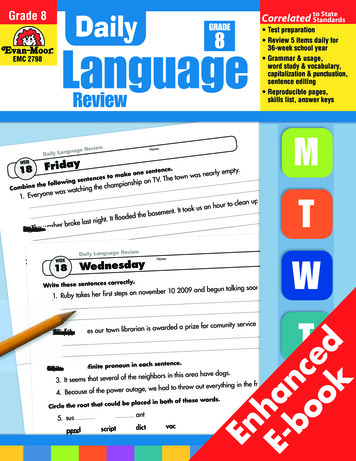
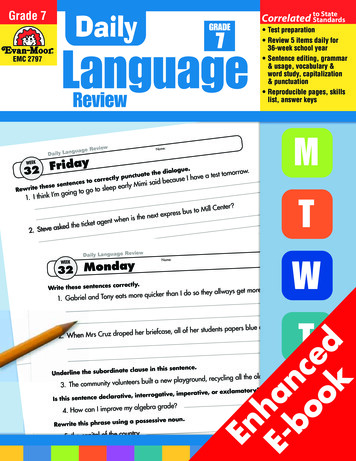
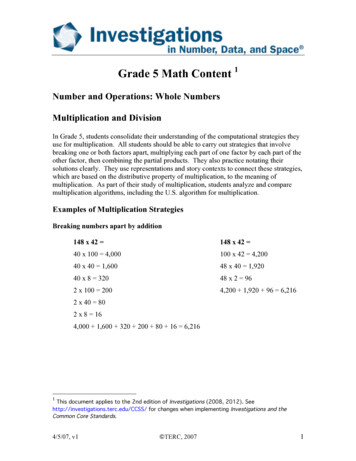
Patterns, Functions, and ChangeIn Grade 5, students continue their work from Grades 3 and 4 by examining,representing, and describing situations in which the rate of change is constant. Studentscreate tables and graphs to represent the relationship between two variables in a variety ofcontexts. They also articulate general rules for each situation. For example, consider theperimeters of the following set of rectangles made from rows of tiles with three tiles ineach row:If the value of one variable (the number of rows of three tiles) is known, thecorresponding value of the other variable (the perimeter of the rectangle) can becalculated. Students express these rules in words and then in symbolic notation. Forexample:For the first time in Grade 5, students create graphs for situations in which the rate ofchange is itself changing–for example, the change in the area of a square as a sideincreases by a constant increment–and consider why the shape of the graph is not astraight line as it is for situations with a constant rate of change.Throughout their work, students move among tables, graphs, and equations and betweenthose representations and the situation they represent. Their work with symbolic notationis closely related to the context in which they are working. By moving back and forth10/10/12, v1 TERC, 201210
between the contexts, their own ways of describing general rules in words, and symbolicnotation, students learn how this notation can carry mathematical meaning.EmphasesUsing Tables and Graphs Using graphs to represent change Using tables to represent changeLinear Change Describing and representing a constant rate of changeNonlinear Change Describing and representing situations in which the rate of change is not constantBenchmarks Connect tables and graphs to represent the relationship between two variablesUse tables and graphs to compare two situations with constant rates of changeUse symbolic notation to represent the value of one variable in terms of anothervariable in situations with constant rates of changeData Analysis and ProbabilityStudents continue to develop their understanding of data analysis in Grade 5 bycollecting, representing, describing, and interpreting numerical data. Students’ work inthis unit focuses on comparing two sets of data collected from experiments. Studentsdevelop a question to compare two groups, objects, or conditions. (Sample questions:Which toy car goes farthest after rolling down the ramp? Which paper bridge holds moreweight?). They consider how to ensure a consistent procedure for their experiment anddiscuss the importance of multiple trials. Using representations of data, including lineplots and bar graphs, students describe the shape of the data—where the data areconcentrated, how they are spread across the range. They summarize the data for eachgroup or object or condition and use these summaries, including medians, to back up theirconclusions and arguments. By carrying out a complete data investigation, fromformulating a question through drawing conclusions from their data, students gain anunderstanding of data analysis as a tool for learning about the world.10/10/12, v1 TERC, 201211
In their work with probability, students describe and predict the likelihood of events andcompare theoretical probabilities with actual outcomes of many trials. They use fractionsto express the probabilities of the possible outcomes (e.g., landing on the green part of thespinner, landing on the white part of the spinner). Then they conduct experiments to seewhat actually occurs. The experiments lead to questions about theoretical andexperimental probability, for example, if half the area of a spinner is colored green andhalf is colored white, why doesn’t the spinner land on green exactly half the time?10/10/12, v1 TERC, 201212
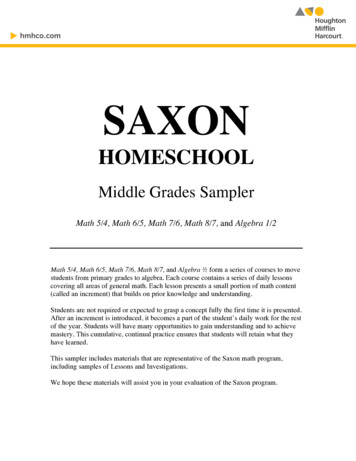
EmphasesData Analysis Representing data Describing, summarizing, and comparing data Analyzing and interpreting data Designing and carrying out a data investigationProbability Describing the probability of an event Describe major features of a set of data represented in a line plot or bar graph, andquantify the description by using medians or fractional parts of the dataBenchmarks Draw conclusions about how 2 groups compare based on summarizing the datafor each groupDesign and carry out an experiment in order to compare two groupsUse a decimal, fraction, or percent to describe and compare the theoreticalprobabilities of events with a certain number of equally likely outcomesGeometry and MeasurementIn their work with geometry and measurement in grade 5, students further develop theirunderstanding of the attributes of two-dimensional (2-D) shapes, find the measure ofangles of polygons, determine the volume of three-dimensional (3-D) shapes, and workwith area and perimeter. Students examine the characteristics of polygons, including avariety of triangles, quadrilaterals, and regular polygons. They consider questions aboutthe classification of geometric figures, for example:Are all squares rectangles?Are all rectangles parallelograms?If all squares are rhombuses, then are all rhombuses squares?10/10/12, v1 TERC, 201213
They investigate angle sizes in a set of polygons and measure angles of 30, 45, 60, 90,120, and 150 degrees by comparing the angles of these shapes. Students also investigateperimeter and area. They consider how changes to the shape of a rectangle can affect oneof the measures and not the other (e.g., two shapes that have the same area don’tnecessarily have the same perimeter), and examine the relationship between area andperimeter in similar figures.Students continue to develop their visualization skills and their understanding of therelationship between 2-D pictures and the 3-D objects they represent. Students determinethe volume of boxes (rectangular prisms) made from 2-D patterns and create patterns forboxes to hold a certain number of cubes. They develop strategies for determining thenumber of cubes in 3-D arrays by mentally organizing the cubes—for example as a stackof three rectangular layers, each three by four cubes. Students deepen their understandingof the relationship between volume and the linear dimensions of length, width, andheight. Once students have developed viable strategies for finding the volume of10/10/12, v1 TERC, 201214
rectangular prisms, they extend their understanding of volume to other solids such aspyramids, cylinders, and cones, measured in cubic units.EmphasesFeatures of Shape Describing and classifying 2-D figures Describing and measuring angles Creating and describing similar shapes Translating between 2-D and 3-D shapesLinear and Area Measurement Finding the perimeter and area of rectanglesVolume Structuring rectangular prisms and determining their volume Structuring prisms, pyramids, cylinders, and cones and determining their volumeBenchmarks Identify different quadrilaterals by attribute, and know that some quadrilateralscan be classified in more than one wayUse known angle sizes to determine the sizes of other angles (30 degrees, 45degrees, 60 degrees, 90 degrees, 120 degrees, and 150 degrees)Determine the perimeter and area of rectanglesIdentify mathematically similar polygonsFind the volume of rectangular prismsUse standard units to measure volumeIdentify how the dimensions of a box change when the volume is changedExplain the relationship between the volumes of prisms and pyramids with thesame base and height10/10/12, v1 TERC, 201215
In Grade 5, students extend their knowledge of the base ten number system, working with numbers in the hundred thousands and beyond. In their place value work, students focus on adding and subtracting multiples of 100 and 1,000 to multi-digit numbers and explaining the results. This work helps them develop reasonable estimates for sums and