Transcription
Tuning Red Hat Enterprise Linux forDatabasesSanjay RaoJune 24, 2015
Objectives of this session Share tuning tips– Aspectsof tuning– Tuning parameters– Results of the tuningBare metal KVM Virtualization– Oracle database tuning considerations Tools
RED HAT ENTERPRISE LINUXMORE THAN A DECADE OF INNOVATIONRED HATADVANCED SERVER 2.1BRINGING LINUX AND OPENSOURCE TO THE ENTERPRISE02030405RED HATENTERPRISE LINUX 4DELIVERING RAS, STORAGE,MILITARY-GRADE SECURITY0607RED HATENTERPRISE LINUX 3MULTI-ARCHITECTURE SUPPORT,MORE CHOICES WITH A FAMILY OFOFFERINGS08RED HATENTERPRISE LINUX 6LINUX BECOMES MAINSTREAM FORPHYSICAL, VIRTUAL, AND CLOUD091011RED HATENTERPRISE LINUX 5VIRTUALIZATION, STATELESS LINUX –ANY APPLICATION, ANYWHERE, ANYTIME121314RED HATENTERPRISE LINUX 7THE FOUNDATION FOR THEOPEN HYBRID CLOUD
RHEL Kernel Architecture Support Architectures– 64 bits Only (with 32bit user space compatibility support)x86 64PPC64s390xKernelXXXHeadersXXXDebugXXXTheoretical Limits on X86 64– Logical CPU – maximum 5120 logical CPUs– Memory – maximum 64T4
What To TuneI/O Memory CPU Network
What is “tuned” ?Tuning framework that dynamically modifies system parameters that affectperformance Pre-existing list of profiles for different sub-systems / application classes Existing profiles can be modified (not recommended) Custom profiles can be created Installed by default in RHEL 7 – Desktop/Workstation:balanced– Server/HPC: throughput-performance Can be rolled back
Tuned: Updates for RHEL7 Re-written for maintainability and extensibility.– Configuration is now consolidated a single tuned.conf file /usr/lib/tuned/ profile-name /tuned.conf– Detail config– Optional hook/callout capability– Adds concept of Inheritance (just like httpd.conf)– Profiles updated for RHEL7 features and characteristics
Tuned: Throughput Profiles - RHEL7TunableInherits From/Notessched min granularity nssched wakeup granularity nsdirty ratiodirty background ratioswappinessI/O Scheduler (Elevator)Filesystem BarriersCPU GovernorDisk Read-aheadDisable THPEnergy Perf Biaskernel.sched migration cost nsmin perf pct (intel pstate only)tcp rmemtcp wmemudp PercentPercentWeight mance4096performance100Max 16777216Max 16777216Max 16777216
Tuned: Latency Profiles - RHEL7TunableInherits From/Notessched min granularity nssched wakeup granularity nsdirty ratiodirty background ratioswappinessI/O Scheduler (Elevator)Filesystem BarriersCPU GovernorDisable THPCPU C-StatesEnergy Perf Biaskernel.sched migration cost nsmin perf pct (intel pstate only)net.core.busy readnet.core.busy pollnet.ipv4.tcp fastopenkernel.numa tpercentWeight 000000010310performanceNoLocked @ 1performanceYes50000001005050EnabledDisabled
Tuned: Virtualization Profiles - RHEL7TunableUnitsthroughput-performanceInherits From/Notessched min granularity nsnanoseconds10000000sched wakeup granularity nsdirty ratiodirty background ssI/O Scheduler (Elevator)Weight 1-10010Filesystem BarriersCPU GovernorBooleanDisk Read-aheadEnergy Perf Biaskernel.sched migration cost nsBytesmin perf pct (intel pstate rmancenanoseconds50000001003030
tuned profile list# tuned-adm listAvailable profiles:- balanced- desktop- latency-performance- network-latency- network-throughput- powersave- sap- throughput-performance- virtual-guest- virtual-hostCurrent active profile: throughput-performance
Tuned – Database workloadOLTP workload - Tuned Profile comparisionlatency-performance vs throughput-performance2520153.10.0-230.el7 - LP – hugepgs3.10.0-230.el7 – TP – hugepgs% diff LP vs TP10510U20U40U60U80U100U0Please note : The latency profiles tweak the CPU power features and they will not work if theBIOS is not configured properly
I/O Tuning – HardwareKnow Your Storage– SAS or SATA? (Performance comes at a premium)– Fibre Channel, Ethernet (Check the PCI slot – PCI / PCI E – x4, x8)– Bandwidth limits (I/O characteristics for desired I/O types) Multiple HBAs– Device-mapper multipath Provides multipathing capabilities and LUN persistence Check for your storage vendors recommendations (upto 20% performance gains withcorrect settings) How to profile your I/O subsystem– Low level I/O tools – dd, iozone, dt, etc.– I/O representative of the database implementation
I/O Tuning – Understanding I/O Elevators Deadline– Twoqueues per device, one for read and one for writes– I/Os dispatched based on time spent in queue– Used for multi-process applications and systems running enterprise storage CFQ– Perprocess queue– Each process queue gets fixed time slice (based on process priority)– Default setting - Slow storage (SATA) – root file system Noop– FIFO– SimpleI/O Merging– Lowest CPU Cost– Low latency storage and applications (Solid State Devices)
I/O Tuning – Configuring I/O ElevatorsBoot-time–Grub command line – elevator deadline/cfq/noop Dynamically, per device–echo “deadline” /sys/block/sda/queue/scheduler tuned–tuned-adm profile throughput-performance
I/O Tuning – File SystemsAvoidDoubleCachingDB CacheMemory(file cache)DIODirect I/O– Avoid double caching– Predictable performance– Reduce CPU overhead Asynchronous I/O– Eliminate synchronous I/O stall– Critical for I/O intensive applications Configure read ahead (for sequential read operations)– Database (parameters to configure read ahead)– Block devices ( commands – “blockdev -- getra / setra”)– Configure device read ahead for large data loads Choosing the right file system– xfs, ext4 Flat files onfile systemsDatabaseConfigure read ahead
I/O Tuning – Effect of read ahead during data loadCompletion time for loading 30G dataDB2 v9.7 (fp4)00:05:46Completion 2600:00:4300:00:002561024
I/O Tuning – Choosing the right file system for your databaseMongoDB - YCSB workloadTrans / MinOracle OLTP workloadext4 – loadxfs – loadFusionIO – ext4FusionIO – xfs10U20U40U60UUser Set80Uext4 – Mixed OLTPxfs – Mixed OLTP100UOps /sec
I/O Tuning – Choosing the right file system for your databaseSybase ASE 15 7 - OLTP WorkloadSybase ASE 16 - OLTP workloadTrans / MinProcess setting in Sybase Kernelext4xfsTrans / Minext4xfs20U40UUser Sets80U20U40U80U
I/O Tuning – Choosing the right file system for your databaseSybase ASE - 16 - Default sybase kernel modeext4 / xfs / rawTrans / MinExt4 – 12 engines – LPxfs – 12 engines – LPRaw – 12 engines20U40U80U
I/O Tuning – Database LayoutSeparate files by I/O (data , logs, undo, temp) OLTP – data files / undo / logs– All transactions generate logs and undo information DSS – data files / temp files– Merge / joins / indexes generally use temp segments Use low latency / high bandwidth devices for hot spots– Use database statistics Linux Tool used for Identifying I/O hotspots iostat -dmxz interval This shows I/O for only the disks that are in use
I/O Tuning – Database LayoutOLTP workload Comparisonwith different I/O configurationsTransactions / minute21193262194074HP EVA – FCData – HP EVA / Logs FusionIOData – Fusion / Logs HP EVAFusionIO782034512012
I/O TuningDatabaseLayoutFibre ChannelDevice:dm 2dm 5dm 6dm 7dm 8dm 18dm 19dm 20dm 0.200.00 289.000.00 1224.500.00 903.600.00 rMB/s0.000.000.000.000.0068.0670.3274.0249.89wMB/s avgrq sz avgqu 77.6284.360.0183.2896.24await r await w 0.01100.01100.01Log on PCI – SSDmonitoring I/Oiostat -dmxz 3fiodfioafiocfiobdm 18dm 19dm 20dm 219.8622.1027.5326.78Data on PCI – SSDfiodfioafiocfiobdm 18dm 19dm 20dm 21dm 10.000.000.000.000.000.000.000.000.00SanDisk PCI 00.000.000.000.00
OLTP WorkloadPCI SSD StorageOLTP WorkloadFibre Channel StorageI/O Tuning – Database layout – 59064156224175922us sy43 433 320 217 219 222 223 224 225 227 226 220 218 219 989908988id wa st4 0 05 0 04 0 03 0 04 0 05 0 03 0 04 0 04 0 04 0 04 0 04 0 05 1 0000000000Memory StatsI/O StatsCPU statsSwap stats
I/O Tuning – dm-cacheCaching in the device mapper stack to improve performance Caching of frequently accessed data in a faster target For more information on how to configure cache device man lvmcache
Database OLTP workloadDM cache - 20G / Writethrough vs WritebackTrans / MinHP EVA – FC – LVMDM-Cache – WTDM-Cache – WBUser Set
Memory TuningNUMA Huge Pages Manage Virtual Memory pages–Flushing of dirty pages–Swapping behavior
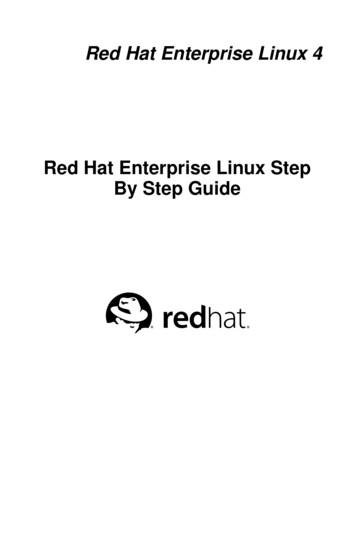
Understanding NUMA (Non Uniform Memory 4M3M1M4M2M3M4M2M4S4S – SocketC – CoreM – Memory Bank – Attached to each SocketD – DatabaseAccess path between socketsAccess path between sockets and memory M2D1S1D2D3D4S2S3S4No NUMA optimizationMulti Socket – Multi core architecture– NUMA required for scaling– Autonuma code provides performance improvement– Additional performance gains by enforcing NUMA placementD1D2D3D4S1S2S3S4NUMA optimization
Memory Tuning – Finding NUMA layout[root@perf30 ]# numactl hardwareavailable: 4 nodes (0 3)node 0 cpus: 0 4 8 12 16 20 24 28 32 36 40 44 48 52 56 60node 0 size: 32649 MBnode 0 free: 30868 MBnode 1 cpus: 1 5 9 13 17 21 25 29 33 37 41 45 49 53 57 61node 1 size: 32768 MBnode 1 free: 29483 MBnode 2 cpus: 2 6 10 14 18 22 26 30 34 38 42 46 50 54 58 62node 2 size: 32768 MBnode 2 free: 31082 MBnode 3 cpus: 3 7 11 15 19 23 27 31 35 39 43 47 51 55 59 63node 3 size: 32768 MBnode 3 free: 31255 MBnode distances:node01230: 10 21 21 211: 21 10 21 212: 21 21 10 213: 21 21 21 10
Memory Tuning – NUMA Enforce NUMA placement– Numactl CPU and memory pinning– Taskset CPU pinning– cgroups cpusets cpu and memory cgroup– Libvirt for KVM guests – CPU pinning
Memory Tuning – Effect of NUMA TuningPerformance improvement is seenwith less cross NUMAactivity by using numa pinning2inst-hugepgs2inst-hugepgs-numapin4 inst-hugepgs4 inst-hugepgs-numapin10U40U80U
Memory Tuning – AutonumaDatabase OLTP workload on 4 Socket System - 4 NUMA nodes - 64 cpus - 128G memory1, 2 and 4 instances with and without Autonuma for 100 User set0-2-4-8-10% DifferenceTrans / Min-6Autonuma onAutonuma off% Diff-12-141 Instance2 Instances4 Instances-16Num of InstancesWith hugepages, there is no performance difference with Autonuma on or off because the memory is wired down # echo 0 /proc/sys/kernel/numa balancing
Memory Tuning – AutonumaDatabase OLTP in VMs - on 4 Socket System - 4 NUMA nodes - 64 cpus - 128G memory1, 2 and 4 VMs running OLTP workload with 100 User set4540352520151051 VM2 Vms4 Vms0% DifferenceTrans / Min30Autonuma onAutonuama off% diff
Memory Tuning – Huge Pages2M pages vs 4K standard linux page Virtual to physical page map is 512 times smaller TLB can map more physical pages, resulting in fewer misses Traditional Huge Pages always pinned Most databases support Huge pages 1G pages supported on newer hardware Transparent Huge Pages in RHEL6 (cannot be used for Database shared memory –only for process private memory) How to configure Huge Pages (16G)– echo 8192 /proc/sys/vm/nr hugepages– vi /etc/sysctl.conf (vm.nr hugepages 8192)
Memory Tuning – huge pages on Bare Metal2 Databases1 Database4 U80U510UThe effect of hugepages are more pronounced with multiple databases80U0
Memory Tuning – huge pages in Virtual Machines1 VM - Database OLTP workload4 VM - Database oltp 10U40U80UThe effect of hugepages are more pronounced with multiple Vms100U0
Tuning Memory – Flushing Caches Drop unused Cache Frees unused memory File cache If the DB uses cache, may notice slowdownFree pagecache echo 1 /proc/sys/vm/drop caches Free slabcache echo 2 /proc/sys/vm/drop caches Free pagecache and slabcache echo 3 /proc/sys/vm/drop caches
Tuning Memory – swappinessNot needed as much in RHEL7 Controls how aggressively the system reclaims “mapped” memory: Default - 60% Decreasing: more aggressive reclaiming of unmapped pagecache memory, therebydelaying swapping Increasing: more aggressive swapping of mapped memory
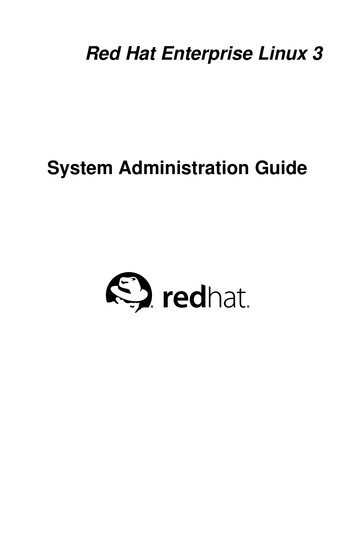
dirty ratio and dirty background ratiopagecache100% of pagecache RAM dirtyflushd and write()'ng processes write dirty buffersIf there is a lot of pagecache pressure onewould want to start background flushingsooner and delay the synchronous writes.This can be done by Lowering the dirty background ratio Increasing the dirty ratiodirty ratio(20% of RAM dirty) – processes start synchronous writesflushd writes dirty buffers in backgrounddirty background ratio(10% of RAM dirty) – wakeup flushddo nothing0% of pagecache RAM dirty
Objectivesof thissessionAnything “Hyper”hasto begood for perfomance.right?Using Hyperthreads improves performance with database workload but the mileage will varydepending on how the database workload scales.Having more CPUs sharing the same physical cache can also help performance in somecasesSome workloads lend themselves to scaling efficiently and they will do very well withhyperthreads but if the scaling factor for workloads are not linear with physical cpus, itprobably won’t be a good candidate for scaling with hyperthreads.
Objectives of this sessionScaling test - Hyperthread vs no HypertheadOLTP workload (96G sga with different CPU counts)1 node – no HT1 node – HTTrans / min2 nodes – no HT2 nodes – HT3 nodes – no HT3 nodes – HT4 nodes – no HT4 nodes – HT10U40U80UUser setsSingle Instance scaled across NUMA nodes, one node at a time. The 1 node test shows the best gain in performance.As more NUMA nodes come into play, the performance difference is hard to predict because of the memory placementand the CPU cache sharing among physical threads and hyperthreads of the CPUsAvg % gain – 1 Node – 30% / 2 Nodes – 20 % / 3 Nodes – 14 % / 4 Nodes – 5.5 %
Objectivesofof thisMulti Instancesdatabase sessionwith and without HyperthreadsTrans / minInstances aligned with Numa Nodes with 16P - 32G mem (24G sga)4 Inst – HT4 Inst – no HT10U20U40U60U80UUser setsEach of the 4 instances were aligned to an individual NUMA node. This test shows the best gain inperformances as other factors influencing performance like NUMA, I/O are not a factor
Hyperthreads Testing with KVMHost - 4 Socket - 32 cores (64 Cores with Hyperthreads Enabled706050Trans / Min38.6736.43403021.1720101 VM2 VM4 Vms0% Difference compared to no Hyperthreads60.03no HT – 32 vcpusHT on host (32 vcpus)HT on host (64 vcpus)%diff 2 Vms%diff 4 Vms
Network Tuning – Databases Network Performance– Separate network for different functions (Private network for database traffic)– Ifon same network, use arp filter to prevent ARP flux– echo 1 /proc/sys/net/ipv4/conf/all/arp filterPrivateH1HardwarePublic– 10GigE Supports RDMA w/ RHEL6 high performance networking package (ROCE)– Infiniband (Consider the cost factor) Packet size (Jumbo frames)Linux Tool used for monitoring network sar -n DEV interval H2
Network tuning – Jumbo Frames with iSCSI storageTransactions / minOLTP Workload1500900010U40U100UDerived metric based on Query completion timeDSS workloads9000MTU1500MTU
Output of “sar -N DEV 3”For a DSS workload running on iSCSI storage using different MTUs1500 MTU01:40:08 PM01:40:11 PM01:40:11 PMIFACErxpck/seth00.34eth5 135016.78txpck/srxkB/s0.340.0219107.72 000.00rxmcst/s0.000.3401:40:14 PM01:40:14 PMeth00.66eth5 133676.740.000.0518911.30 17 PM01:40:17 PMeth00.67eth5 134555.850.000.0519045.15 20 PM01:40:20 PMeth01.00eth5 134116.330.000.0718972.33 197849.550.001325.030.000.000.000.000.671.009000 MTU06:58:43 PM06:58:46 PM06:58:46 PMIFACErxpck/seth00.91eth5 104816.36txpck/srxkB/s0.000.0748617.27 000.00rxmcst/s0.000.9106:58:49 PM06:58:49 PMeth00.00eth5 118269.800.000.0054965.84 :52 PM06:58:52 PMeth00.00eth5 118470.730.000.0054382.44 :55 PM06:58:55 PMeth00.94eth5 115853.050.000.0653515.49 995087.670.000.000.000.000.000.470.003766.28
Database Performance Application tuning Design Reduce locking / waiting Database tools (optimize regularly) Resiliency is not a friend of performance
Redo LogsCheckpoints, Redo Log Size, Multiplexing
Redo LogsCheckpoints, Redo Log Size, Multiplexing
Redo Log size vs Recovery time2 Multiplexed logs - ASM with Enterprise Storage profileOLTP GRedo Log Size2G1G00:00Time (Min:Secs)Trans / Min07:12100UTIME ELAPSED
CgroupResource Management– Memory, cpus, IO, Network– For performance– For application consolidation– Dynamic resource allocation Application Isolation I/O Cgroups– At device level control the % of I/O for each Cgroup if the device is shared– At device level put a cap on the throughput
Cgroup – Resource managementCgroups - to manage resourcesInst 1Inst 2Inst 3Inst 4No Resource ControlCgroup- Resource Control
Cgroup – NUMA pinningCgroups for NUMA pinningWorks with HugepagesWorks with Huge Pages transparentlygiving another 13% gainAligning NUMA by using Cgroupsshows a 30% gainTrans / MinInstInstInstInstno NUMACgroup NUMACgroup NUMA – Hugepgs4321
C-group - Dynamic resource controlTrans / MinDynamic CPU change with CgroupsInstance 1Instance 2Time
Cgroup – Application IsolationMemory Resource ManagementSystem Level Memory SwappingOracle OLTP Workload35 K30 K20 KSwap InSwap Out15 K10 KTransactions Per Minute25 ottledEven though one application does not have resources and starts swapping,other applications are not affected4321
Database on RHEV
Quick Overview – KVM ArchitectureGuests run as a process in userspace on the host A virtual CPU is implemented using a Linux thread– The Linux scheduler is responsible for scheduling a virtual CPU, as it is a normalthread Guests inherit features from the kernel– NUMA– Huge Pages– Support for new hardware
Virtualization Tuning – CachingFigure 1VM1Figure 2VM2VM1HostFile CacheVM2Cache none (Figure 1)– I/O from the guest is not cached on the host Cache writethrough (Figure 2)– I/O from the guest is cached and written through on the host Works well on large systems (lots of memory and CPU) Potential scaling problems with this option with multiple guests (host CPU used tomaintain cache) Can lead to swapping on the host
Virt Tuning – Effect of I/O Cache SettingsOLTP testing in 4 VMsCache WT vs Cache noneTrans / mincache nonecache WTcache WT-run210U20U40UUser set count60U80U
Virt Tuning – Using NUMATrans / min normalized to 1004 Virtual Machines running OLTP workloadno NUMAManual PinNUMAD
Virt Tuning – Tuning Transparent Huge Pages4 VM testingComparision between THP and huge pages on hostTrans / MinTHP-scan 10000THP - scan 100Hugepages10U20U40U60UUser Set80U100U
Virt Tuning – Kernel Samepage Merging (KSM)KSM and THP scanTrans / MinTHP 10000scan, ksm on, mem opt server (150)THP 100scan, ksm on, mem opt server (150)THP 100scan, ksm off, mem opt server(150)THP 100scan, ksm off, no memory opt40U80U100UUser SetUse KSM for- Running Windows Virtual Machines on RHEV- Oversubscribing memory on the host
RHEV 3.3 – MigrationTransactions / minuteMigrating a 108G VM running OLTP 500K Trans/minTPM- regularTPM – Mig BW - 32TPM – Mig BW - 0TimeConfigure – migration max bandwidth Value in /etc/vdsm/vdsm.conf
Virtualization Tuning – NetworkVirtIO VirtIO drivers for network vhost net (low latency – close to line speed) Bypass the qemu layer PCI pass through Bypass the host and pass the PCI device to the guest Can be passed only to one guest SR-IOV (Single root I/O Virtualization) Pass through to the guest Can be shared among multiple guests Limited hardware support
Tools
Performance Monitoring ToolsMonitoring tools– top, vmstat, ps, iostat, netstat, sar, perf Kernel tools– /proc, sysctl, AltSysRq Networking– ethtool, ifconfig Profiling– oprofile, strace, ltrace, systemtap, perf
Performance Monitoring Tool – perf Performance analysis tool– perf top (dynamic)– perf record / report (save and replay)– perf stat command (analyze a particular workload)
Performance Monitoring Tool – perf topMulti Instance OLTP Run without Huge Pages
Performance Monitoring Tool – perf record / reportMulti Instance OLTP Run with Huge Pages
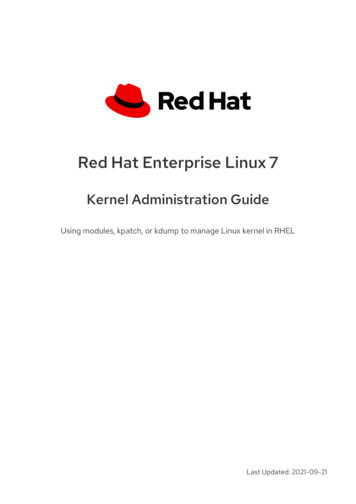
Performance Monitoring Tool – perf stat perf stat command monitors any workload and collects variety of statistics can monitor specific events for any workload with -e flag (“perf list” give list of events)“perf stat” with regular 4k pagesPerformance counter stats for database workload 9,302,532,078task clockcontext switchescpu migrationspage faultscyclesstalled cycles frontendstalled cycles backendinstructions1,585,314,389,085 branches43,276,126,707 branch misses1068.000304798 seconds time 2.67%0.362.05215.8372.73%CPUs utilizedM/secM/secK/secGHzfrontend cycles idlebackend cycles idleinsns per cyclestalled cycles per insnM/secof all 3.35%]
Performance Monitoring Tool – perf stat“perf stat” with 2M huge pagesPerformance counter stats for database workload 33,778,949,221task clockcontext switchescpu migrationspage faultscyclesstalled cycles frontendstalled cycles backendinstructions2,109,143,617,292 branches45,626,829,201 branch misses1054.730657871 seconds time 1.76%0.372.00227.7142.16%CPUs utilizedM/secM/secK/secGHzfrontend cycles idlebackend cycles idleinsns per cyclestalled cycles per insnM/secof all 3.33%]
Performance Monitoring Tool – sarOutput of “sar -N DEV 3”For a DSS workload running on iSCSI storage using different MTUs1500 MTU01:40:08 PM01:40:11 PM01:40:11 PMIFACErxpck/seth00.34eth5 135016.78txpck/srxkB/s0.340.0219107.72 000.00rxmcst/s0.000.3401:40:14 PM01:40:14 PMeth00.66eth5 133676.740.000.0518911.30 17 PM01:40:17 PMeth00.67eth5 134555.850.000.0519045.15 20 PM01:40:20 PMeth01.00eth5 134116.330.000.0718972.33 197849.550.001325.030.000.000.000.000.671.009000 MTU06:58:43 PM06:58:46 PM06:58:46 PMIFACErxpck/seth00.91eth5 104816.36txpck/srxkB/s0.000.0748617.27 000.00rxmcst/s0.000.9106:58:49 PM06:58:49 PMeth00.00eth5 118269.800.000.0054965.84 :52 PM06:58:52 PMeth00.00eth5 118470.730.000.0054382.44 :55 PM06:58:55 PMeth00.94eth5 115853.050.000.0653515.49 995087.670.000.000.000.000.000.470.003766.28
Wrap Up – Bare MetalI/O– Choose the right elevator– Eliminated hot spots– Direct I/O or Asynchronous I/O– Virtualization – Caching Memory– NUMA– Huge Pages– Swapping– Managing Caches RHEL has many tools to help with debugging / tuning
Wrap Up – Bare Metal (cont.)CPU– Check cpuspeed settings Network– Separate networks– arp filter– Packet size
Tuning framework that dynamically modifies system parameters that affect performance Pre-existing list of profiles for different sub-systems / application classes Existing profiles can be modified (not recommended) Custom profiles can be created Installed by default in RHEL 7 -Desktop/Workstation: balanced