Transcription
2020Bill de Blasio MayorAloysee Heredia Jarmoszuk Commissioner & Chair
New York City’s for-hire industry has undergone significantchange in the two years since the Taxi & LimousineCommission (TLC) published its 2018 Factbook. The TLC hascontinued to adapt its regulatory policies to various rapidtechnological advances in ways that serve drivers, passengers,and small business owners in the city.TLC FACTBOOK2 0 2 0In 2019, the TLC implemented rules that mandate minimum per-trippayment for drivers dispatched by the major app companies. The driverpay rules are based on a groundbreaking study of app driver economicsthat took into account the actual expenses of app drivers, who oftenbear the risks and costs of operating in the industry, and developed aminimum pay formula to ensure full-time drivers receive after-expensespay that equals or exceeds the City’s minimum wage of 15 per hour.The New York City Council enacted a one-year pause on issuing newFor-Hire Vehicle (FHV) licenses to ease congestion and gave the TLC, forthe first time, the power to regulate the number of FHV vehicle licenses.The legislation created an exception for wheelchair accessible vehicles(WAVs). One year later, in 2019, the TLC renewed this license pause for anadditional year and added another exception for battery electric vehicles(BEVs). These policies will protect driver pay by while increasing accessiblevehicles and helping the City to meet its goal to reduce carbon emissions.In addition to driver pay and anti-congestion measures, the TLC hasincreased its data collection and analysis since the 2018 Factbook waspublished. The agency is the first regulator in the country to collect tripdata including origin-destination and duration from the newly-createdHigh Volume For-Hire Services (HVFHS) sector. These companies are alsorequired to report driver income to enable the TLC to monitor driver pay.2
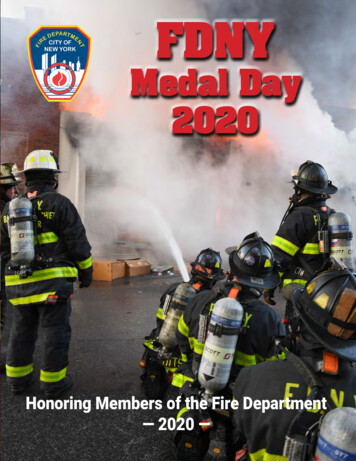
Medallion TaxiGuide to the 2020 FactbookWheelchairAccessibleMedallion TaxiStreet HailLiveryWheelchairAccessibleStreet Hail LiveryHigh VolumeFor-Hire ServicesVehicleTraditional For-HireService VehicleThe 2020 TLC Factbook examines trends in New York City’s forhire industries from January 2018 through December 2019, unlessotherwise noted. Information is included on all segments of theindustry. The TLC has released a separate publication summarizingthe COVID-19 pandemic’s impact on the FHV sector; this period isgenerally not analyzed here in order to present industry trends ofthe larger time period in general terms. Segments of the for-hireindustries are detailed in the “Regulated Industries” section of theFactbook.Drivers and vehicles are referred to in the Factbook as active and/or licensed. In this context, a “licensed” driver or vehicle means onecurrently in good standing with the TLC’s Licensing division. As well,“active” refers to drivers or vehicles that completed at least one tripin a specified time period.This page shows the colors and icons used throughout the Factbookto represent the vehicle sectors the TLC regulates.Wheelchair AccessibleHigh Volume andTraditional For-HireService VehicleColor LegendYellow Medallion TaxiGreen Street Hail LiveryCommuterVanHigh Volume For-Hire VehicleTraditional For-Hire VehicleParatransitVehicle3
T LC -Re g ul a ted I nd us tr i e sMedallion taxicabs are often referred to as Yellowtaxis. A fixed number of medallion licenses grantaccess for these vehicles to perform street hails andelectronically-hailed trips (E-Hail) anywhere in thecity. Vehicles are inspected three times per year; twoinspections occurring at the TLC’s inspection facility,and another occurring at any NYS-certifiedinspection facility. When hailed on the street, taxifares are set by the TLC and based on an initialcharge, elapsed time and distance, plus surcharges.The TLC is also piloting the use of binding, upfront farequotes in taxis through licensed E-Hail companies.by FHV bases that provide under 10,000 trips per dayand include the black car, livery and luxurylimousine segments. If a base dispatches over 10,000trips per day, it will need to acquire an additionalHVFHS license. HVFHS bases are subject toheightened data reporting requirements. Currently,the four FHV bases that fall into the HVFHS categoryare app-based ridesharing companies, Lyft, Uber,Via, and Juno1. Combined, these bases account formore than 80% of all FHV trips. Across the FHV sector,vehicles are inspected every other year at the TLC’sinspection facility, and three times per year at a DMVfacility. FHVs cannot pick up street hails anywhere inNew York City.Street Hail Liveries (SHLs) are also known asGreen or boro taxis. They began providing service toNew Yorkers in August 2013. Fares are set by the TLCon street hails to match those in Yellow taxis, whilefares for Green taxis can accept street hails andE-Hails in Upper Manhattan, and anywhere in theBronx, Brooklyn, Queens, and Staten Island. Greentaxis can also be dispatched by FHV bases forpre-arranged trips. They cannot pick up passengersat airports unless the trip is pre-arranged through abase. SHLs are inspected twice per year by the TLC.Commuter vans operate flat-rate ridesthroughout New York City within specific serviceareas approved by the New York City Department ofTransportation, typically in areas that lack alternativepublic transportation options. Commuter vans mustbe visually inspected by the TLC every two years andrequire a DOT inspection every 6 months.Paratransit vehicles provide pre-arrangedservice for medical-related purposes. Trips are usuallyto and from healthcare facilities, and vehicles mustbe dispatched by a paratransit base. These vehiclesmust be visually inspected by TLC every two yearsand require a DOT inspection every 6 months.FHV service is divided into two distinct groupsbased on the dispatching base: Traditional FHV andHigh Volume For-Hire Services (HVFHS). TraditionalFHV service encompasses trips that are dispatched1As of November 2019, Juno no longer operates in New York City.4
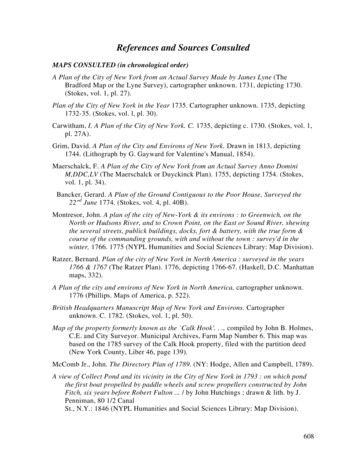
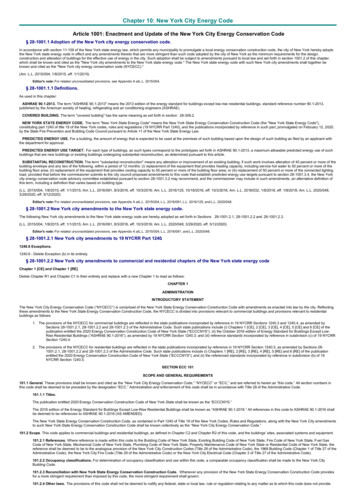
Industry OverviewLicensed VehiclesVehicle CountOperationAverage Age13,587Provides street hail and pre-arrangedservice via E-Hail applications4.5 years2,895Provides street hail and pre-arrangedservice from Upper Manhattan andthe outer boroughs7.5 years78,620Pre-arranged trips dispatched froma High Volume base (HVFHS)4.2 years23,043Pre-arranged trips dispatched from atraditional base, including Black Car,Livery, and Luxury Limousine5.3 years92Provide flat rate trips in areas typicallywith low transit access9.0 years161Medically-related transportation thatis dispatched from an affiliated base5.0 yearsYellow taxisGreen taxisHVFHSTraditional FHVCommuter vanParatransit5
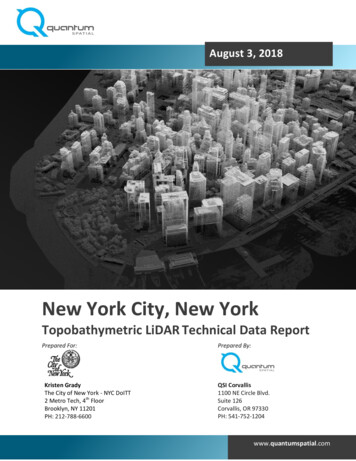
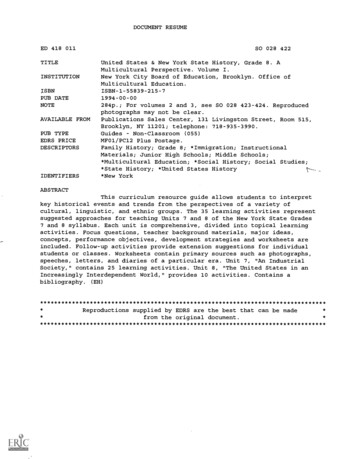
Engine 8 Battery Electric FHVsThe TLC currently licenses over 118,000vehicles and nearly 185,000 drivers operatingfrom over 1,000 bases.As of Summer 2020, 59% of all Yellow taxis,42% of Green taxis, and 20% of FHVs havehybrid engines. Notably, the FHV sector alsohas a significant number of BEVs, with 268zero emissions vehicles to date. The mostcommon TLC-licensed vehicle across allindustry sectors is the Toyota Camry. ToyotaPriuses are common to both Yellow andGreen taxis. The former Taxi of Tomorrow,the Nissan NV200, is still a Yellow. Amongtraditional and High Volume, ToyotaHighlanders, Honda Accords, and ToyotaSiennas are also all common.Top Vehicle Models by SectorToyota CamryToyota CamryToyota CamryToyota CamryNissan NV200Ford EscapeToyota HighlanderToyota SiennaToyota PriusToyota PriusHonda AccordToyota Highlander6
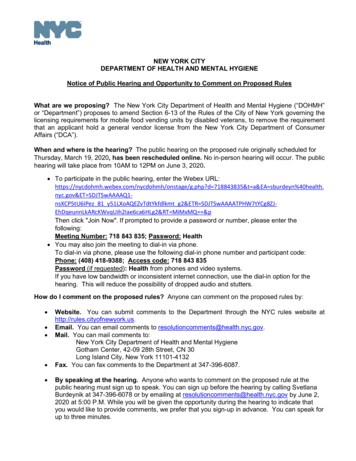
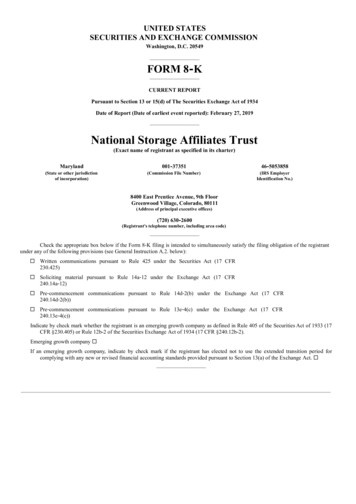
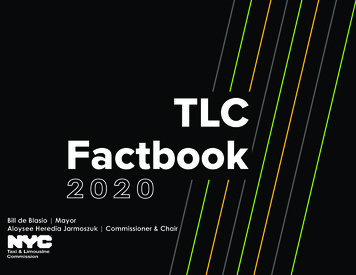
Trip TrendsTrip Counts Per DayThe highest daily trip count on record is 1.37million trips, which occurred on Saturday,October 27th, 2018. The lowest trip countduring this time period occurred on January4th, 2018 with 483,000 trips and coincided witha major snowstorm in New York City.Average Daily Trip VolumeProportions by Sector6%11%36%4%23%50%201769%Count of TripsAs displayed on the right, daily trip counts inTLC-licensed vehicles have increased steadilyin the past three years, from 870,000 in early2017 to just over 1,000,000 by the end of 2019.Jan 20172%Jul 2017Jan 2018Jul 2018Jan 2019Jul 2019Trip volume growth in the recent past is largelydue to the growth of the HVFHS sector. Thesecompanies completed an average of 439,000 tripsper day in 2017 compared to 701,000 averagedaily trips in 2019. As a result of this increase, HVFHSaccounted for 69% of daily average trips in 2019,compared to 50% in 2017.20197
Average Weekday Trips by AM3AM12AM9PM6PM3PM12PM9AM6AM3AMTLC-licensed vehicles across all sectors are most active during the weekday rush hour and also on Saturdayevenings. While Yellow cabs reach their peak trip period during the morning and afternoon rush hours, theyare nearly as active during the weekday mid-day hours. FHVs display a similar pattern, but with higher peaksduring the rush hours and a noticeable dip during weekday mid-day hours.Average Weekend Trips by HourSaturdaySunday35k30kSaturday and Sunday evenings showa much higher volume of activity,along with fewer trips earlier in theday, compared to weekdays.25k20kHigh Volume For-Hire Services’weekend trip averages demonstratethat the sector’s trip volumes are farmore variable during the eveninghours than many of the other 12PM9AM6AM3AM5k12AM12AM5kAverage Count of TripsAverage Count of Trips35k
Sector Activity by Borough: Pick UpsHVFHS accounted for over 85% of passengerpickups in all boroughs except Manhattan,where Yellow taxis accounted for 44% ofall pickups in 2018 and 2019. Airports andneighborhoods in Midtown and DowntownManhattan comprise the majority ofmedallion passenger pickup locationsduring this time period.Passengers travelling to and from New YorkCity’s two airports, John F. Kennedy andLaGuardia, accounted for over 47 milliontrips from the beginning of 2018 through theend of 2019. During that time, passengerpickups accounted for 53% of all airporttrips. Passengers utilized Yellow taxis far morefor pickups than drop-offs at airports.Highest Average Monthly Pick-Ups byNeighborhood 2018-2019Upper East Side: 315,000East Harlem: 41,000East Village: 330,000Flushing: 10,0009
Sector Activity by Borough: Drop-OffsYellow taxis are highly utilized fortravel within Manhattan. Ninety-sevenpercent of medallion pickups occurredin Manhattan and 92% of drop-offsoccurred within the other four boroughs.HVFHS are universally used both in andoutside of Manhattan.Passengers are more inclined to useHVFHS to travel to a New York airportthan from the airport. HVFHS accountedfor 80% of drop-offs at LaGuardia andJFK.Highest Average Monthly Drop-Offs byNeighborhood 2018-2019Upper East Side: 294,000East Harlem: 20,400JFK Airport: 356,000JFK Airport: 14,00010
Trip Accessibility and SafetyAccessibility201520172019In 2018 the TLC required all FHV basesto provide accessible service. As aresult, licensed WAVs in the Livery andBlack Car sectors increased sixty-fold,from 20 vehicles at the end of 2015, to1,210 by the end of 2019. During thesame time period, Yellow taxis also sawan increase in WAVs from 543 to k55k50kAverage Daily WAV TripsIn January 2018, WAVs accountedfor around 37,000 trips per day acrossall sectors. By December 2019,the number of trips done in WAVsincreased by 70%, to be around 63,000trips per day. Through the TLC’s TaxiImprovement Fund (TIF) program,funding is available for WAV Yellowand Green taxi owners and drivers tooffset costs. In 2018 and 2019, 21.9million was granted through the fund,paid for by a 30-cent surcharge on allYellow and Green taxi trips.Average Daily Trips in WAV45k40k35k30k25k20k15k10k5k20171120182019
Accessible Dispatch Trip Volumes10k9k8k7kThe safety of passengers, drivers, and the pedestrians,cyclists and others they share the streets with, is a toppriority of the TLC. To recognize safe driving, the TLC hostsan annual Driver Honor Roll ceremony. This ceremonycelebrates drivers with outstanding consecutive years-longsafety records. The 2019 Honor Roll included 433 driversfrom all industry sectors.Crashes with Injuries5k4k10003k9502k1kJan 18May 18Sep 18Jan 19May 19Sep 19The TLC’s Accessible Dispatch program wasinitiated in 2012 within Manhattan, allowingNew Yorkers to request wheelchair accessiblevehicles (WAVs) in advance or on demand. InJanuary 2018, the program was expanded to all 5boroughs.As shown above, trips have increased steadilysince the program’s expansion, from 7,200 inJanuary 2018 to almost 9,500 in December 2019,an increase of more than 30%.Number of Crashes Resulting in InjuryTotal Accessible Dispatch Trips6kSafety & Honor epOctNovDecAs a lead Vision Zero agency, TLC monitors all crashesinvolving TLC-licensed vehicles. As displayed above, from2018 to 2019, the average number of crashes involving a TLClicensed vehicle resulting in an injury declined from 883 to 819per month. TLC-licensed vehicles were involved in 40 crashesresulting in serious injury or fatality in 2018 and 32 in 2019, asserious injury crashes declined by half to just 12 in 2019.12
Driver DemographicsThere are currently 185,000 TLC-licensed drivers. A TLC-licensed driver has the ability to work for any sector ofthe industry at any time, as long as the license is active. For analytical purposes, the TLC sometimes attributesa driver to particular sector by using the highest trip count from each sector the driver works in. This is doneusing a combination of vehicle and trip records. Where applicable, the results in the following pages arecalculated using this methodology.Driver ResidenceDriver GenderTLC-licensed drivers active in 2018 and 2019 were 95%male and 5% female. The Traditional FHV sector has thehighest proportion of female drivers, at 5%, while themedallion segment has the lowest, with fewer than 1%.Both FHV sectors have seen increases in the proportionof female drivers within the last few years.Proportion of Female Drivers 2018-2019Over 86% of active TLC-licensed drivers live in NewYork City. Of these, the majority (80%) live outsideof Manhattan. Queens is the borough where mostdrivers live (34%), followed by Brooklyn (25%).Queens is also the most popular borough for driversat the sector level, with a notable 49% of medalliondrivers and 40% of HVFHS drivers residing in theborough.Yellow 1% FemaleHigh Volume: 4% Female13Green: 1% FemaleTraditional FHV: 5% Female
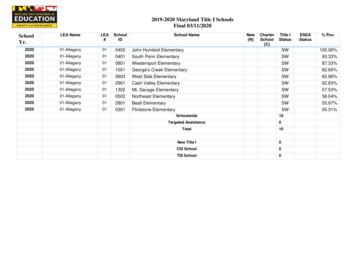
Driver Age56To the right, the blue line indicates the averageage of all TLC-licensed drivers, across sectors.5452Average Driver Age in YearsThe High Volume For-Hire Services sector has, onaverage, the youngest drivers, with an averageage of 40.1 years old by the end of 2019. Greentaxi drivers tend to be the oldest group, withan average age of 52. The average for themedallion cab sector is 50.50484644424038Country of Birth By IndustryYellow MedallionBangladesh 23%Pakistan 9%India 8%Haiti 6%United States 4%Ghana 4%Egypt 4%Morocco 3%Dominican Republic 2%Senegal 2%3620162017High VolumeStreet Hail LiveryDominican Republic 14%United States 9%Bangladesh 9%Pakistan 9%India 5%Uzbekistan 3%China 3%Haiti 3%Egypt 3%Nepal 3%Bangladesh 23%Pakistan 12%Dominican Republic 12%India 8%Ecuador 3%United States 3%Haiti 3%Egypt 3%Guinea 3%Côte d'Ivoire 2%1420182019Traditional FHVDominican Republic 31%United States 8%Pakistan 6%Ecuador 6%China 5%India 4%Bangladesh 4%Uzbekistan 3%Haiti 3%Egypt 2%
Primary Languages Spoken40%TLC-licensed drivers speak 123 languages. The five mostspoken languages are English (42%), Spanish (18%),Bengali (7%), Russian (5%), and Arabic (5%).Driver Exams by LanguageBefore earning their TLC license, prospective drivers arerequired to complete a 24-hour course and pass an80-question exam that covers traffic safety, customerservice, geography, and the City’s Human Rights Law.30%Percent of Active DriversEnglish and Bengali are the most spoken primarylanguage among Yellow and Green drivers, whileSpanish is the common primary language in traditionalFHV and HVFHS sectors.35%15%10%The courses and exams are offered in Arabic,Bengali, Chinese, English, Russian, Spanish, and Urdu.The second quarter of 2017 had the highest numberof exams taken, at 10,543. The fourth quarter of 2019had the lowest number of exams taken, at 2,239.This decrease mirrors the decrease in driver licenseapplications after the City paused the issuance ofnew vehicle licenses in 2018.10k9k8kDriver Exam Taken20%5%11kExams in English7k25%6k5k4kDrivers have completed more than 200,000wheelchair accessible vehicle trainings to improvethe passenger experience for those with limitedmobility.3kExams not inEnglish2k1kQ3 2017Q1 2018Q3 2018Q1 2019Q3 201915
AcknowledgementsThe 2020 Factbook was created by the Office of Policy &External AffairsCommissioner & ChairAloysee Heredia JarmoszukActing Deputy Commissioner, Policy & External AffairsKala WrightProject TeamJosh Henderson / Policy AnalystElizabeth Major / Senior Geospatial AnalystTed Metz / Policy AnalystNikita Voevodin / Senior Data AnalystAdditional ThanksMichael Anderson / Director, Financial AnalyticsJonathan Internicola / Director, Licensing AnalyticsKatie Miller / Multimedia CoordinatorFausto Lopez / Director, Data Engineering & AnalyticsCeline Zakaryan / Director, Policy ResearchDesign & ProductionTed MetzKatie Miller16
industry sectors is the Toyota Camry. Toyota Priuses are common to both Yellow and Green taxis. The former Taxi of Tomorrow, the Nissan NV200, is still a Yellow. Among traditional and High Volume, Toyota Highlanders, Honda Accords, and Toyota Siennas are also all common. Conventional Gasoline Hybrid 58% 90% 59% 42% 10% 41% 268 Battery Electric FHVs