Transcription
New York City Independent Budget OfficeFiscal BrieNew York CityPublic SchoolIndicators:Teachers: Demographics,Work History, Training,and Characteristics ofTheir SchoolsJune 2017IBONew York CityIndependent Budget OfficeRonnie Lowenstein, Director110 William St., 14th floorNew York, NY 10038Tel. (212) 442-0632Fax (212) 442-0350iboenews@ibo.nyc.ny.uswww.ibo.nyc.ny.us
bNYC Independent Budget OfficeJune 2017
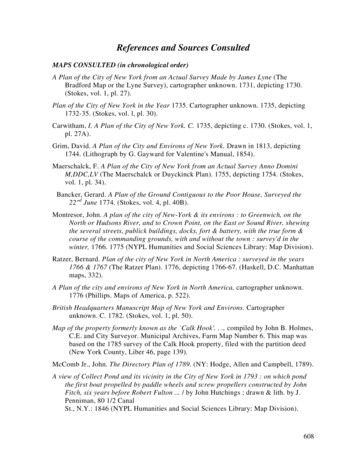
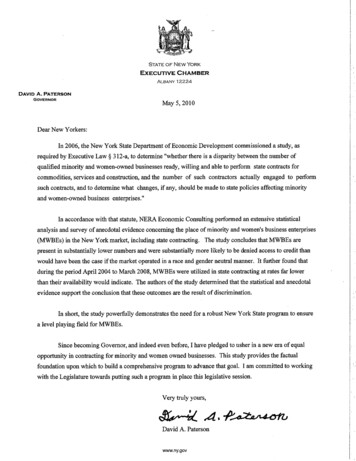
Basic Characteristics of Teachers: Demographics & Work History, 2005-2006 Through 2014-2015DemographicsTotal Number of 1020112011201220122013201320142014201578,816 ,040Percentage %76.4%90th Percentile of AgeDistribution57575858585959585858Median Age4040393940404040403910th Percentile of AgeDistribution25252526262728272727General Education Teachers62,11162,522 62,86762,374 59,40256,82554,77854,53553,91754,008Special Education Teachers14,82315,364 410.110.410.610.610.610.4Work Experience in NYCTraditional Public SchoolsAverage Years as Teacher9.09.19.2NOTE: Includes teachers with less than one full year of experience.Teachers’ Race and Ethnicity, 2014-2015Percent of Special Education Teachers Working inDistricts 1-32 and District 75, 2014-2015Districts 1-3276.9%District 7523.1%NOTE: District 75 provides citywide educational, vocational, andbehavior support programs for students who qualify for particularspecial education services.New York City Independent Budget OfficeNYC Independent Budget OfficeNew York City Independent Budget her2.1%NOTE: May not add due to rounding.New York City Independent Budget OfficeJune 20171
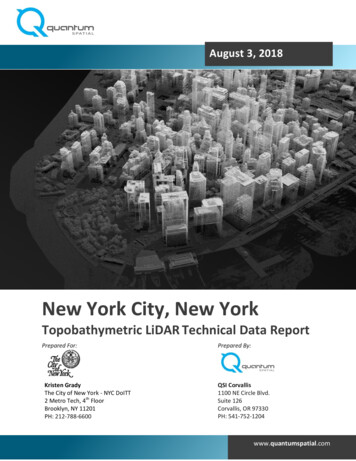
Tracking Teacher Cohorts: Retention After First School Assignment, 2000-2001 - 2014-2015Percent Who Remained Teaching in Original NYC Traditional Public SchoolYear of New TeacherCohortPercent Who Remained Percent Who Remained Percent Who RemainedNumber of TeachersAfter 1 YearAfter 5 YearsAfter 10 %2012-20135,29980%2013-20145,48720%84%Percent Who Remained in NYC Traditional Public Schools in any CapacityYear of New TeacherCohortNumber of TeachersPercent Who Remained Percent Who Remained Percent Who RemainedAfter 1 YearAfter 5 YearsAfter 10 %2012-20135,29990%2013-20145,48792%44%NOTE: The percent who remained in New York City traditional public schools includes individuals employed by the Department of Education in anycapacity.New York City Independent Budget Office2NYC Independent Budget OfficeJune 2017
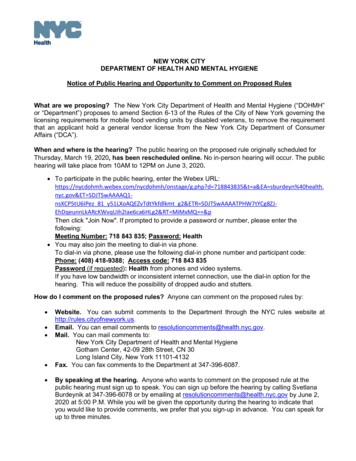
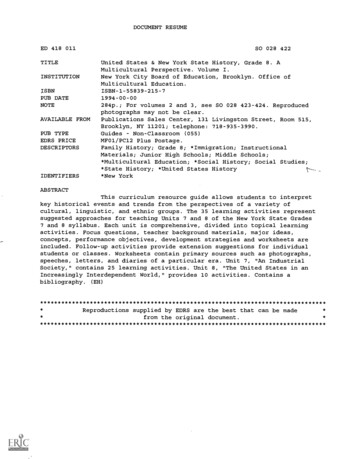
Basic Characteristics of Teachers by School Poverty Level, 2014-2015All SchoolsElementary& MiddleSchoolsNumber of TeachersPercent FemaleHigh Poverty SchoolsHighSchoolsElementary& MiddleSchools44,81217,396Medium PovertySchoolsHighSchoolsElementary& MiddleSchools11,6423,986Low Poverty SchoolsHighSchoolsElementary& %58.4%82.8%57.9%82.0%57.5%88.2%59.0%90th Percentile of Age5757575657565758Median Age393740364036393910th Percentile of rk Experience in NYCPublic SchoolsAverage Years as aTeacherNOTES: Table reflects only those teachers in schools with known poverty level. Includes teachers with less than one full year of experience. Highschools include schools that serve at least one student in grades 9-12.New York City Independent Budget OfficeTeachers’ Race and Ethnicity by School Poverty Level,2014-2015School Poverty her1.9%1.8%1.8%NOTE: Table reflects only those teachers who work in schools with aknown poverty level.New York City Independent Budget OfficeTracking Teacher Retention by School Poverty Level, 2014-2015High Poverty SchoolsNumber of Teachers in 2013-2014Percent of Teachers Who Remained atTheir School in 2014-2015Medium Poverty SchoolsLow Poverty SchoolsElementary &Middle SchoolsHighSchoolsElementary &Middle SchoolsHighSchoolsElementary &Middle 883.9%79.4%86.5%79.5%89.2%87.2%NOTES: Table reflects only those teachers who work in schools with a known poverty level. High schools include schools that serve at least onestudent in grades 9-12.New York City Independent Budget OfficeNYC Independent Budget OfficeJune 20173
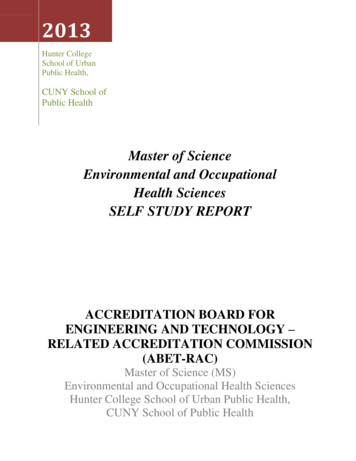
Teacher Training Program Graduates by School Poverty Level, 2014-2015School Poverty LevelNumber of TeachersHighMediumLow1,77436.1%38.2%25.7%Teach NYC Select Recruits76129.8%29.6%40.6%Teach for America37753.6%34.8%11.7%58,43824.4%29.1%46.5%NYC Teaching FellowsTraditional PathwayNOTES: Table reflects only those teachers in schools with a known poverty level. Includes teachers with less than one full year of experience.New York City Independent Budget OfficeTracking Teacher Retention by Training Program: 2011-2012 Cohort of New TeachersNYC TeachingFellowsTeachNYC SelectRecruitsTeach 2014-201541.1%51.6%23.9%60.3%Number of New Teachers in 2011-2012Percent who Remained at their Original School in:New York City Independent Budget Office4NYC Independent Budget OfficeJune 2017
New York City Independent Budget Office New York City Public School Indicators: Teachers: Demographics, Work History, Training, and Characteristics of Their Schools June 2017 New York City Independent Budget Office Ronnie Lowenstein, Director 110 William St., 14th floor New York, NY 10038 Tel. (212) 442-0632 Fax (212) 442-0350 iboenews@ibo.nyc .