Transcription
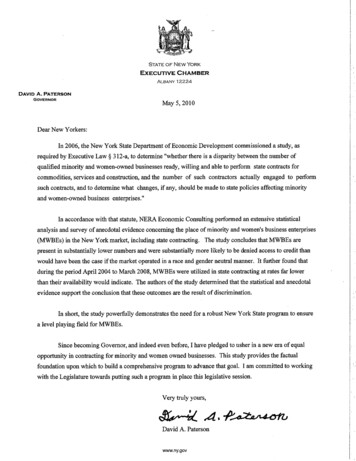
April 29, 2010The State of Minority- and WomanOwned Business Enterprise:Evidence from New YorkPrepared for the New York State Department of EconomicDevelopment
Project TeamJon Wainwright, Ph.D., Vice President, NERAColette Holt, J.D., Colette Holt & AssociatesKim Stewart, M.S., Research Analyst, NERAJ. Wesley Stewart, A.A., Research Assistant, NERAAbt SRBI, Inc.J&D Data ServicesRMBDC, Inc.Spectrum Personal Communications CorporationAcknowledgmentsThis Study would not have been possible without the assistance of personnel throughout New YorkState government, especially at the Department of Economic Development. Special thanks go to theState’s project manager for this study, Jeff Metzler, Vice President for Economic Empowerment,Empire State Development Corporation.NERA Economic Consultingth1006 East 39 St.Austin, Texas 78751Tel: 1 512 371 8995Fax: 1 512 371 9612www.nera.com
About the Project Team—NERA Economic ConsultingNERA Economic Consulting is a global firm of experts dedicated to applying economic,finance, and quantitative principles to complex business and legal challenges. For half a century,NERA's economists have been creating strategies, studies, reports, expert testimony, and policyrecommendations for government authorities and the world's leading law firms and corporations.We bring academic rigor, objectivity, and real world industry experience to bear on issues arisingfrom competition, regulation, public policy, strategy, finance, and litigation.NERA’s clients value our ability to apply and communicate state-of-the-art approaches clearly andconvincingly, our commitment to deliver unbiased findings, and our reputation for quality andindependence. Our clients rely on the integrity and skills of our unparalleled team of economistsand other experts backed by the resources and reliability of one of the world’s largest economicconsultancies. With its main office in New York City, NERA serves clients from over 20 officesacross North America, Europe, and Asia Pacific.NERA’s employment and labor experts advise clients on a wide range of issues both inside andoutside the courtroom. We have provided expert testimony on statistical issues both at the classcertification phase (on issues of commonality and typicality) and at the liability phase (for class orpattern-and-practice cases). Our experts have extensive experience examining issues of statisticalliability in discrimination and other wrongful termination claims. We also provide detailed statisticalanalyses of workforce composition to identify potential disparities in hiring, layoffs, promotions, pay,and performance assessments and have conducted studies on labor union issues and onaffirmative action programs for historically disadvantaged business enterprises.NERA Vice President Dr. Jon Wainwright led the NERA project team for this Study. Dr. Wainwrightheads NERA’s disparity study practice and is a nationally recognized expert on businessdiscrimination and affirmative action. He has authored books, papers, and numerous researchstudies on the subject, and has been repeatedly qualified to testify on these and other issues as anexpert in state and federal courts. At NERA, Dr. Wainwright directs and conducts economic andstatistical studies of discrimination for attorneys, corporations, governments, and non-profitorganizations. He also directs and conducts research and provides clients with advice on adverseimpact and economic damage matters arising from their hiring, performance assessment,compensation, promotion, termination, or contracting activities.NERA Economic Consultingth1006 East 39 St.Austin, Texas 78751Tel: 1 512 371 8995Fax: 1 512 371 9612www.nera.com
About the Project Team—NERA Research PartnersC olette Holt & Associates is a Chicago-based law practice specializing in public sectoraffirmative action programs. The firm provides legal and consulting services to governments andbusinesses relating to procurement and contracting; employment discrimination; regulatorycompliance; organizational change; program development, evaluation and implementation; andissues relating to inclusion, diversity and affirmative action. Colette Holt, J.D. is a nationallyrecognized expert in designing and implementing legally defensible affirmative action programsand is a frequent author and media commentator in this area. On this Study, Colette Holt served aslegal counsel for NERA, providing advice and recommendations for the study’s design andimplementation, conducting interviews with business owners and state procurement officials, anddrafting key study findings, among other duties.Abt SRBI is a New York-based business with a national reputation for excellence in computerassisted telephone interviewing. Abt SRBI provides analysis in the rapidly evolving markets andpublic policy areas of communications, financial services, utilities, transportation, media, health andbusiness services. The firm was founded in 1981 with the explicit purpose of combining high qualityanalytic capabilities with in-house control of the research implementation to ensure accurate, timelyand actionable research use by decision makers working in rapidly changing environments. AbtSRBI clients include the Eagleton Institute at Rutgers, the Annenburg Institute at the University ofPennsylvania, and the major networks. Abt SRBI has conducted numerous surveys of M/WBEsand non-M/WBEs on behalf of the NERA team. On this Study, Abt SRBI conducted telephonesurveys of race and gender misclassification and of mail survey non-response under thesupervision of Abt SRBI Project Manager Andrew Evans.J&D Data Services is a small business enterprise owned by Mr. Joe Deegan and based inPlano, Texas. After a long career with ScanTron, Mr. Deegan started his own business to offer asolid and proven alternative to the time consuming and expensive job of key data entry longassociated with mail surveys. The firm helps its clients conserve their surveying resources bydesigning and delivering survey instruments that can be electronically and automatically scannedupon return and sent directly to electronic format. J&D Data Services has conducted numeroussurveys of M/WBEs and non-M/WBEs on behalf of the NERA team. On this assignment theyprovided printing, postage, mail-out and mail-back service for the subcontract data collection, themail survey, and the business owner interview invitations.NERA Economic Consultingth1006 East 39 St.Austin, Texas 78751Tel: 1 512 371 8995Fax: 1 512 371 9612www.nera.com
About the Project Team—NERA Research PartnersR MBDC, Inc. is a small business with offices in Rochester and Albany. The firm’s primaryfocus is the design and implementation of programs and services that provide meaningfuleconomic participation for enterprises owned by minorities and women in public and privatesectors. RMBDC is certified as a M/WBE and DBE with New York State and the NYS DormitoryAuthority and is also a certified SBA 8(a) business. Previous clients include the City of Rochester,Dormitory Authority of the State of New York, and the New York State Department ofTransportation. On this assignment RMBDC provided outreach and support to populate thebusiness owner interview sessions in Albany, Rochester, and Buffalo.Spectrum Personal Communications Corp. is a small business founded in 1994 asa diversified business consulting firm and is located in New York City. The firm is a certified MBEwith the State of New York, New York City, New York City School Construction Authority, the PortAuthority of NY and NJ, and the Metropolitan Transit Authority. CEO Mark O’Luck has over 20years experience as a consultant to major corporations and governments. Mr. O’Luck is a graduateof Norfolk University and holds an Honorary Doctor of Law degree from St. Joseph’s College.Spectrum offers its clients advisory, development, implementation and support services on a widearray of business topics including Local/Small/Disadvantaged/Minority/Women-Owned businessconsulting services. On this assignment, Spectrum provided outreach and support to populate thebusiness owner interview sessions in New York City, Long Island, and Westchester.NERA Economic Consultingth1006 East 39 St.Austin, Texas 78751Tel: 1 512 371 8995Fax: 1 512 371 9612www.nera.com
NoticeThis report sets forth the information required by the terms of NERA’s engagement by the New YorkState Department of Economic Development and is prepared in the form expressly required thereby.This report is intended to be read and used as a whole and not in parts. Separation or alteration of anysection or page from the main body of this report is expressly forbidden and invalidates this report.This report is not intended to be used, reproduced, quoted or distributed for any purpose other thanthose stipulated in the terms of NERA’s engagement by the New York State Department of EconomicDevelopment without the prior written permission of NERA.Information furnished by others, upon which all or portions of this report are based, is believed to bereliable but has not been verified. No warranty is given as to the accuracy of such information. Publicinformation and industry and statistical data, including contracting, subcontracting, and procurementdata are from sources we deem to be reliable; however, we make no representation as to the accuracyor completeness of such information and have accepted the information without further verification.The findings contained in this report may contain predictions based on current data and historicaltrends. Any such predictions are subject to inherent risks and uncertainties. In particular, actual resultscould be impacted by future events which cannot be predicted or controlled, including, without limitation,changes in business strategies, the development of future products and services, changes in marketand industry conditions, the outcome of contingencies, changes in management, changes in law orregulations. NERA accepts no responsibility for actual results or future events.The opinions expressed in this report are valid only for the purpose stated herein and as of the date ofthis report. No obligation is assumed to revise this report to reflect changes, events or conditions, whichoccur subsequent to the date hereof.All decisions in connection with the implementation or use of advice or recommendations contained inthis report are the sole responsibility of the New York State Department of Economic Development. Thisreport does not represent investment advice nor does it provide an opinion regarding the fairness of anytransaction to any and all parties.This report is for the exclusive use of New York State Department of Economic Development. There areno third party beneficiaries with respect to this report, and NERA does not accept any liability to any thirdparty. In particular, NERA shall not have any liability to any third party in respect of the contents of thisreport or any actions taken or decisions made as a consequence of the results, advice orrecommendations set forth herein.NERA Economic Consultingth1006 East 39 St.Austin, Texas 78751Tel: 1 512 371 8995Fax: 1 512 371 9612www.nera.com
Table of ContentsTable of ContentsList of Tables . ix Executive Summary .1 A. Introduction.1 B. Legal Standards for Government Affirmative Action Contracting Programs .1 C. Defining the Relevant Markets .2 D. M/WBE Availability in the State’s Market Area.2 E. Statistical Disparities in Minority and Female Business Formation and BusinessOwner Earnings .3 F. Statistical Disparities in Credit/Capital Markets.5 G. M/WBE Public Sector Utilization vs. Availability in the State’s Contracting andProcurement Markets, FY 2004–2008.6 H. Anecdotal Evidence .9 I. M/WBE Program Overview and Feedback Interviews .10 J. Conclusion .11 I. Introduction .13 A. History of New York State’s Affirmative Action Contracting Programs.13 B. Study Outline .14 II. Legal Standards for Government Affirmative Action Contracting Programs .17 A. General Overview of Strict Scrutiny.17 B. New York’s Compelling Interest in Remedying Identified Discrimination in ItsContracting Marketplaces .33 C. Narrowly Tailoring a Minority-Owned and Women-Owned Business EnterpriseProcurement Program for the State of New York.37 D. Table of Authorities .43 III. Defining the Relevant Markets .47 A. Preparing the Master Contract/Subcontract Database .47 B. Geographic Market Definition for Contracting and Procurement .53 C. Product Market Definition for Contracting and Procurement .56 D. Tables.57 IV. M/WBE Availability in New York’s Marketplace.71 A. Identifying Businesses in the Relevant Markets.71 B. Estimates of M/WBE Availability by Detailed Race, Sex, and Industry .76 C. Tables.78 V. Statistical Disparities in Minority and Female Business Formation and Business OwnerEarnings .139 A. Review of Relevant Literature .139 B. Race and Sex Disparities in Earnings .143 C. Race and Sex Disparities in Business Formation .149 vii
Table of ContentsD. Expected Business Formation Rates—Implications for Current M/WBE Availability .154 E. Evidence from the Survey of Business Owners.155 Tables.158 VI. Statistical Disparities in Capital Markets .187 A. Theoretical Framework and Review of the Literature.188 B. Empirical Framework and Description of the Data .191 C. Qualitative Evidence.194 D. Differences in Loan Denial Rates by Race, Ethnicity or Gender .196 E. Differences in Interest Rates Charged on Approved Loans.202 F. Loan Approval Rates and Access to Credit .203 G. Analysis of Credit Market Discrimination in the U.S. in 1998 .205 H. Analysis of Credit Market Discrimination in the U.S. in 2003 .210 I. Further Analysis of Credit Market Discrimination: NERA Surveys 1999-2007.213 J. Conclusions.214 K. Tables.217 VII. M/WBE Utilization and Disparity in the State’s Markets.247 A. Introduction.247 B. M/WBE Utilization.248 C. Disparity Analysis.249 D. Current versus Expected Availability .250 E. Tables.251 VIII. Anecdotal Evidence of Disparities in the State’s Marketplace.357 A. Business Experience Surveys .358 B. Business Owner Interviews.363 C. Tables.378 IX. New York State’s Minority- and Women-Owned Business Enterprise Program .389 A. Overview of New York State’s Minority- and Women-Owned Business EnterpriseProgram.389 B. Business Owner Interviews.391 X. References.423 Appendix A—Master Directory Sources.431 A. Entities whose lists of M/WBE firms that were duplicative of previously collectedlists .431 B. Entities who had no directory, or their directory did not identify race and sex.435 C. Entities that were non responsive to repeated contacts.439 D. Entities that refused to provide the requested information .441 Appendix B—State Agencies, Authorities, and Other Budget Entities Subject to Article 15-A 443 Appendix C—Glossary.445 viii
List of TablesList of TablesTable A. Overall Current Availability—By Major Procurement Category and Overall. 3 Table B. M/WBE Utilization in NYS Contracting and Procurement, 2004-2008. 6 Table C. Disparity Results for NYS Contracting, Overall and By Procurement Category, 20042008. 7 Table D. Expected Availability and Actual Current Availability, Overall and By MajorProcurement Category . 8 Table 3.A. Distribution of State Contracts and Purchase Orders by Procurement Category andSubcontractable Opportunities. 49 Table 3.B. Agencies and Sub-Agencies Included in the Study . 50 Table 3.C. Distribution of Prime Contracts and Subcontracts Award Dollars by State and County,2004-2008 . 54 Table 3.1. Summary of Master Contract/Subcontract Database: Prime Contracts andSubcontracts by Procurement Category, 2004-2008 . 57 Table 3.2. Summary of Master Contract/Subcontract Database: Prime Contracts by Year ofAward. 58 Table 3.3. Summary of Master Contract/Subcontract Database: Prime Contracts by State Agency. 60 Table 3.4. Distribution of State Contracting and Procurement Dollars by Geographic Location 63 Table 3.5. Distribution of Contract and Subcontract Dollars Awarded by Industry Sub-sector:Construction. 64 Table 3.6. Distribution of Contract and Subcontract Dollars Awarded by Industry Sub-sector:CRS . 65 Table 3.7. Distribution of Contract and Subcontract Dollars Awarded by Industry Sub-sector:Services . 66 Table 3.8. Distribution of Contract and Subcontract Dollars Awarded by Industry Sub-sector:Commodities . 68 Table 4.1. Construction—Number of Businesses and Industry Weight, by NAICS Code, 2010 78 Table 4.2. CRS—Number of Businesses and Industry Weight, by NAICS Code, 2010. 83 ix
List of TablesTable 4.3. Services—Number of Businesses and Industry Weight, by NAICS Code, 2010. 85 Table 4.4. Commodities—Number of Businesses and Industry Weight, by NAICS Code, 2010 89 Table 4.5. Construction—Number of Listed M/WBEs and Industry Weight, by NAICS Code,2010. 93 Table 4.6. CRS—Number of Listed M/WBEs and Industry Weight, by NAICS Code, 2010 . 97 Table 4.7. Services—Number of Listed M/WBEs and Industry Weight, by NAICS Code, 201099 Table 4.8. Commodities—Number of Listed M/WBEs and Industry Weight, by NAICS Code,2010. 103 Table 4.9. Listed M/WBE Survey—Amount of Misclassification, by NAICS Code Grouping 107 Table 4.10. Listed M/WBE Survey—Amount of Misclassification, by Putative M/WBE Type108 Table 4.11. Unclassified Businesses Survey —By NAICS Code Grouping . 109 Table 4.12. Unclassified Businesses Survey—By Race and Sex . 110 Table 4.13. Detailed M/WBE Availability—Construction, 2010. 111 Table 4.14. Detailed M/WBE Availability—CRS, 2010. 119 Table 4.15. Detailed M/WBE Availability—Services, 2010. 123 Table 4.16. Detailed M/WBE Availability—Commodities, 2010. 130 Table 4.17. Estimated Availability—Overall and By Procurement Category. 138 Table 5.1. Annual Wage Earnings Regressions, All Industries, 2006–2008. 158 Table 5.2. Annual Wage Earnings Regressions, All Industries, 1980-1991. 159 Table 5.3. Annual Wage Earnings Regressions, All Industries, 1992-2008. 160 Table 5.4. Annual Wage Earnings Regressions, Construction and Related Industries, 2006–2008. 161 Table 5.5. Annual Wage Earnings Regressions, Construction and Related Industries, 1980-1991. 162 Table 5.6. Annual Wage Earnings Regressions, Construction and Related Industries, 1992-2008. 163 Table 5.7. Annual Business Owner Earnings Regressions, All Industries, 2006–2008 . 164 x
List of TablesTable 5.8. Annual Business Owner Earnings Regressions, All Industries, 1980-1991. 165 Table 5.9. Annual Business Owner Earnings Regressions, All Industries, 1992-2008. 166 Table 5.10. Business Owner Earnings Regressions, Construction and Related Industries, 2006–2008. 167 Table 5.11. Business Owner Earnings Regressions, Construction and Related Industries, 19801991. 168 Table 5.12. Business Owner Earnings Regressions, Construction and Related Industries, 19922008. 169 Table 5.13. Self-Employment Rates in 2006–2008 for Selected Race and Sex Groups: UnitedStates and the New York State Market Area, All Industries . 170 Table 5.14. Self-Employment Rates in 2006–2008 for Selected Race and Sex Groups: UnitedStates and the New York State Market Area, Construction and CRS Sectors and Goodsand Services Sectors . 170 Table 5.15. Business Formation Regressions, All Industries, 2006–2008 . 171 Table 5.16. Business Formation Regressions, All Industries, 1980-1991 . 172 Table 5.17. Business Formation Regressions, All Industries, 1992-2008 . 173 Table 5.18a. Business Formation Regressions, Construction and Related Industries, 2006–2008. 174 Table 5.18b. Business Formation Regressions, Goods and Services Industries, 2006–2008. 175 Table 5.19. Business Formation Regressions, Construction and Related Industries, 1980-1991. 176 Table 5.20. Business Formation Regressions, Construction and Related Industries, 1992-2008. 177 Table 5.21. Actual and Potential Business Formation Rates in the New York State Market Area. 178 Table 5.22. Disparity Indices from the 2002 Survey of Business Owners: United States, AllIndustries. 179 Table 5.23. Disparity Indices from the 2002 Survey of Business Owners: NY-NJ-CT, AllIndustries. 180 Table 5.24. Disparity Indices from the 2002 Survey of Business Owners: United States,Construction and CRS Industries. 181 xi
List of TablesTable 5.25. Disparity Indices from the 2002 Survey of Business Owners: NY-NJ-CT,Construction and CRS Industries. 182 Table 5.26. Disparity Indices from the 2002 Survey of Business Owners: United States, Goodsand Services Industries .
business owner interview sessions in Albany, Rochester, and Buffalo. Spectrum Personal Communications Corp. is a small business founded in 1994 as a diversified business consulting firm and is located in New York City. The firm is a certified MBE with the State of New York, New York City, New York City School Construction Authority, the Port


